Kingston, MA Map & Demographics
Kingston Map
Kingston Overview
$57,631
PER CAPITA INCOME
$140,203
AVG FAMILY INCOME
$124,048
AVG HOUSEHOLD INCOME
34.1%
WAGE / INCOME GAP [ % ]
65.9¢/ $1
WAGE / INCOME GAP [ $ ]
0.40
INEQUALITY / GINI INDEX
6,090
TOTAL POPULATION
3,092
MALE POPULATION
2,998
FEMALE POPULATION
103.14
MALES / 100 FEMALES
96.96
FEMALES / 100 MALES
45.1
MEDIAN AGE
2.9
AVG FAMILY SIZE
2.4
AVG HOUSEHOLD SIZE
3,751
LABOR FORCE [ PEOPLE ]
72.6%
PERCENT IN LABOR FORCE
2.3%
UNEMPLOYMENT RATE
Kingston Zip Codes
Income in Kingston
Income Overview in Kingston
Per Capita Income in Kingston is $57,631, while median incomes of families and households are $140,203 and $124,048 respectively.
| Characteristic | Number | Measure |
| Per Capita Income | 6,090 | $57,631 |
| Median Family Income | 1,640 | $140,203 |
| Mean Family Income | 1,640 | $167,216 |
| Median Household Income | 2,504 | $124,048 |
| Mean Household Income | 2,504 | $142,779 |
| Income Deficit | 1,640 | $0 |
| Wage / Income Gap (%) | 6,090 | 34.11% |
| Wage / Income Gap ($) | 6,090 | 65.89¢ per $1 |
| Gini / Inequality Index | 6,090 | 0.40 |
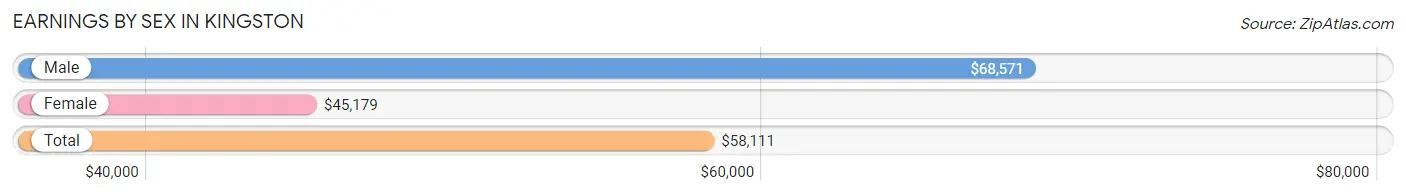
Earnings by Sex in Kingston
Average Earnings in Kingston are $58,111, $68,571 for men and $45,179 for women, a difference of 34.1%.
| Sex | Number | Average Earnings |
| Male | 2,012 (52.0%) | $68,571 |
| Female | 1,860 (48.0%) | $45,179 |
| Total | 3,872 (100.0%) | $58,111 |
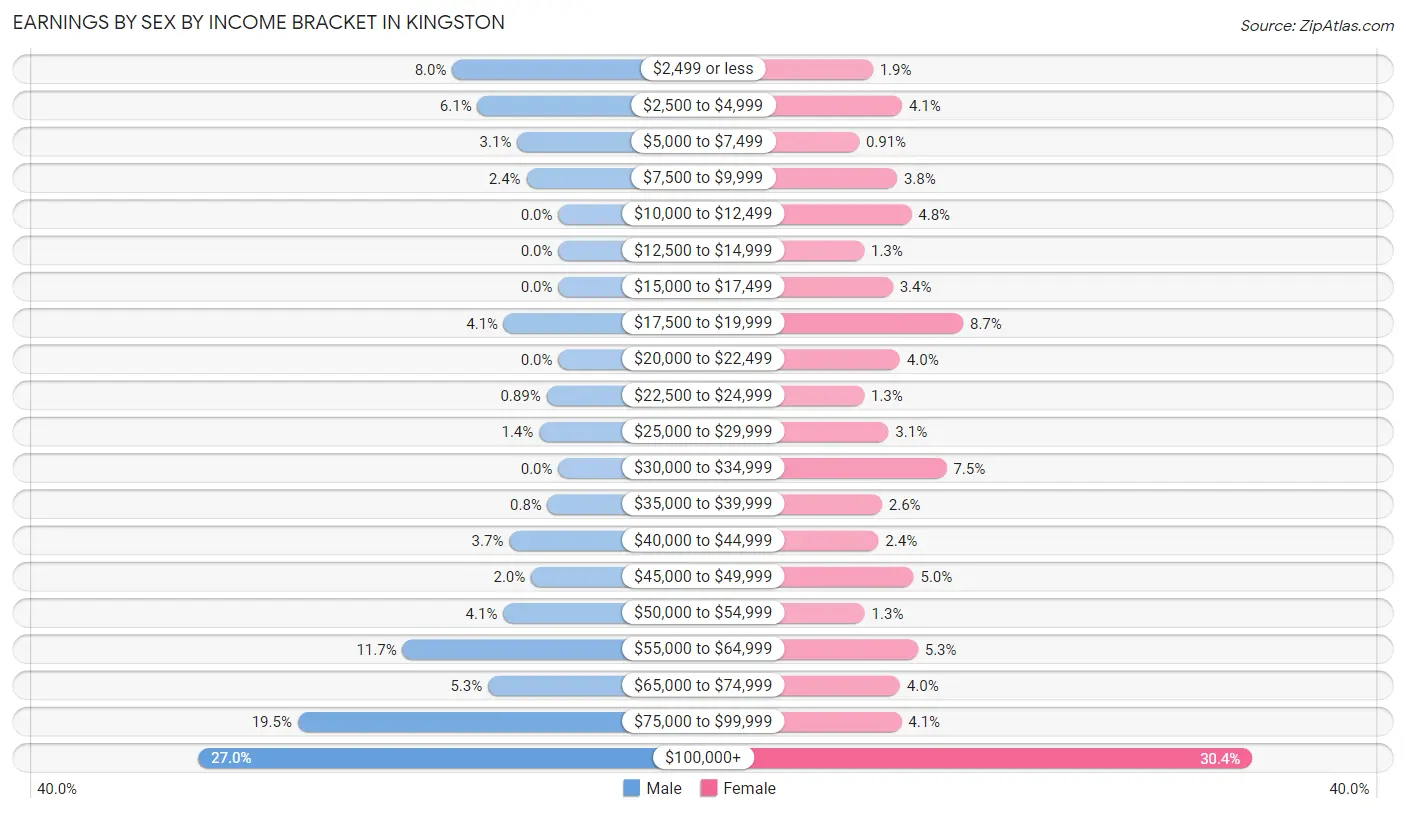
Earnings by Sex by Income Bracket in Kingston
The most common earnings brackets in Kingston are $100,000+ for men (543 | 27.0%) and $100,000+ for women (565 | 30.4%).
| Income | Male | Female |
| $2,499 or less | 160 (8.0%) | 36 (1.9%) |
| $2,500 to $4,999 | 122 (6.1%) | 77 (4.1%) |
| $5,000 to $7,499 | 62 (3.1%) | 17 (0.9%) |
| $7,500 to $9,999 | 48 (2.4%) | 70 (3.8%) |
| $10,000 to $12,499 | 0 (0.0%) | 90 (4.8%) |
| $12,500 to $14,999 | 0 (0.0%) | 24 (1.3%) |
| $15,000 to $17,499 | 0 (0.0%) | 64 (3.4%) |
| $17,500 to $19,999 | 82 (4.1%) | 162 (8.7%) |
| $20,000 to $22,499 | 0 (0.0%) | 74 (4.0%) |
| $22,500 to $24,999 | 18 (0.9%) | 24 (1.3%) |
| $25,000 to $29,999 | 29 (1.4%) | 58 (3.1%) |
| $30,000 to $34,999 | 0 (0.0%) | 139 (7.5%) |
| $35,000 to $39,999 | 16 (0.8%) | 49 (2.6%) |
| $40,000 to $44,999 | 74 (3.7%) | 44 (2.4%) |
| $45,000 to $49,999 | 41 (2.0%) | 93 (5.0%) |
| $50,000 to $54,999 | 83 (4.1%) | 25 (1.3%) |
| $55,000 to $64,999 | 235 (11.7%) | 99 (5.3%) |
| $65,000 to $74,999 | 106 (5.3%) | 74 (4.0%) |
| $75,000 to $99,999 | 393 (19.5%) | 76 (4.1%) |
| $100,000+ | 543 (27.0%) | 565 (30.4%) |
| Total | 2,012 (100.0%) | 1,860 (100.0%) |
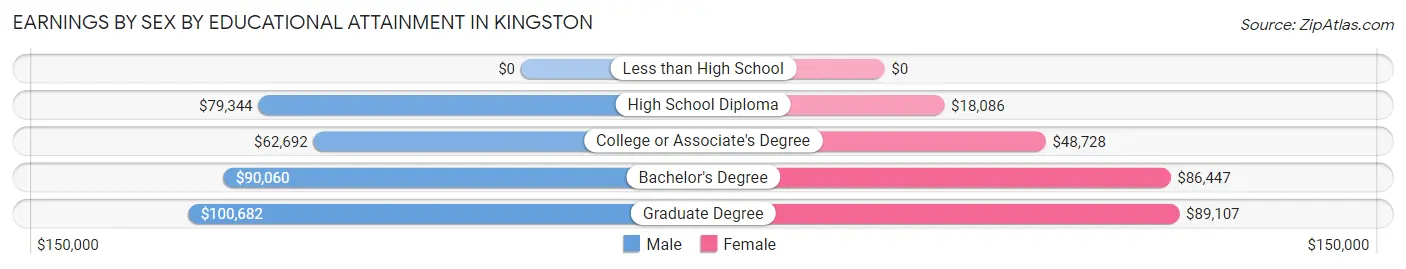
Earnings by Sex by Educational Attainment in Kingston
Average earnings in Kingston are $78,188 for men and $48,500 for women, a difference of 38.0%. Men with an educational attainment of graduate degree enjoy the highest average annual earnings of $100,682, while those with college or associate's degree education earn the least with $62,692. Women with an educational attainment of graduate degree earn the most with the average annual earnings of $89,107, while those with high school diploma education have the smallest earnings of $18,086.
| Educational Attainment | Male Income | Female Income |
| Less than High School | - | - |
| High School Diploma | $79,344 | $18,086 |
| College or Associate's Degree | $62,692 | $48,728 |
| Bachelor's Degree | $90,060 | $86,447 |
| Graduate Degree | $100,682 | $89,107 |
| Total | $78,188 | $48,500 |
Family Income in Kingston
Family Income Brackets in Kingston
According to the Kingston family income data, there are 392 families falling into the $100,000 to $149,999 income range, which is the most common income bracket and makes up 23.9% of all families.
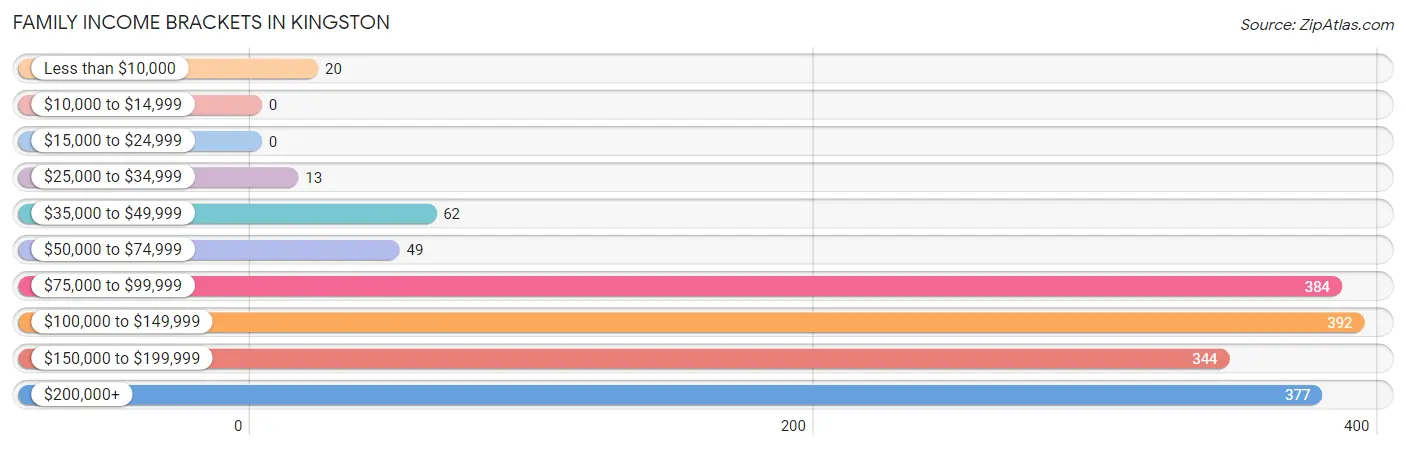
| Income Bracket | # Families | % Families |
| Less than $10,000 | 20 | 1.2% |
| $10,000 to $14,999 | 0 | 0.0% |
| $15,000 to $24,999 | 0 | 0.0% |
| $25,000 to $34,999 | 13 | 0.8% |
| $35,000 to $49,999 | 62 | 3.8% |
| $50,000 to $74,999 | 49 | 3.0% |
| $75,000 to $99,999 | 384 | 23.4% |
| $100,000 to $149,999 | 392 | 23.9% |
| $150,000 to $199,999 | 344 | 21.0% |
| $200,000+ | 377 | 23.0% |
Family Income by Famaliy Size in Kingston
6-person families (42 | 2.6%) account for the highest median family income in Kingston with $234,643 per family, while 2-person families (871 | 53.1%) have the highest median income of $53,451 per family member.
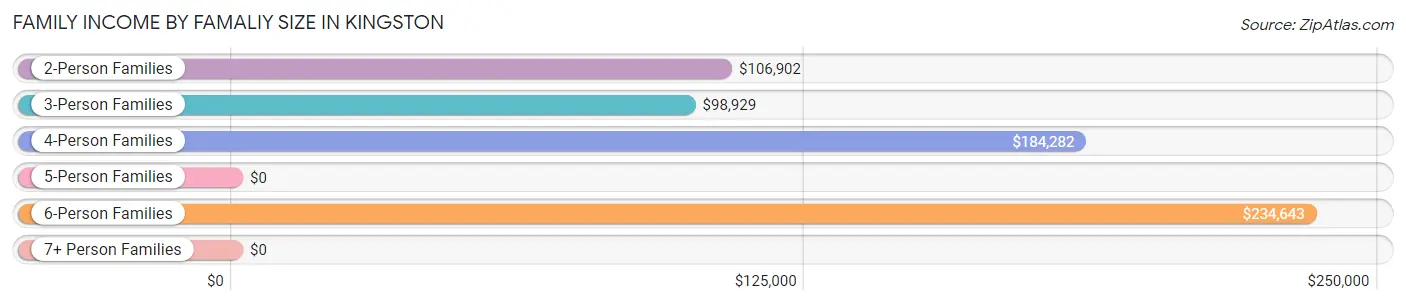
| Income Bracket | # Families | Median Income |
| 2-Person Families | 871 (53.1%) | $106,902 |
| 3-Person Families | 246 (15.0%) | $98,929 |
| 4-Person Families | 389 (23.7%) | $184,282 |
| 5-Person Families | 14 (0.9%) | $0 |
| 6-Person Families | 42 (2.6%) | $234,643 |
| 7+ Person Families | 78 (4.8%) | $0 |
| Total | 1,640 (100.0%) | $140,203 |
Family Income by Number of Earners in Kingston
The median family income in Kingston is $140,203, with families comprising 3+ earners (379) having the highest median family income of $184,330, while families with no earners (176) have the lowest median family income of $79,306, accounting for 23.1% and 10.7% of families, respectively.
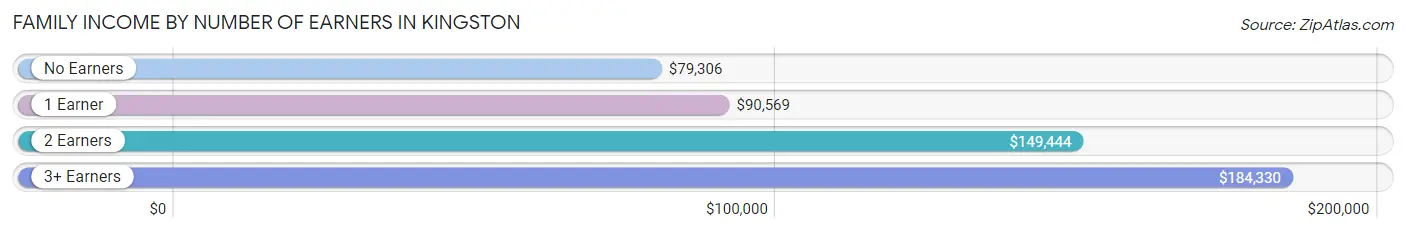
| Number of Earners | # Families | Median Income |
| No Earners | 176 (10.7%) | $79,306 |
| 1 Earner | 341 (20.8%) | $90,569 |
| 2 Earners | 744 (45.4%) | $149,444 |
| 3+ Earners | 379 (23.1%) | $184,330 |
| Total | 1,640 (100.0%) | $140,203 |
Household Income in Kingston
Household Income Brackets in Kingston
With 561 households falling in the category, the $100,000 to $149,999 income range is the most frequent in Kingston, accounting for 22.4% of all households. In contrast, only 35 households (1.4%) fall into the $10,000 to $14,999 income bracket, making it the least populous group.
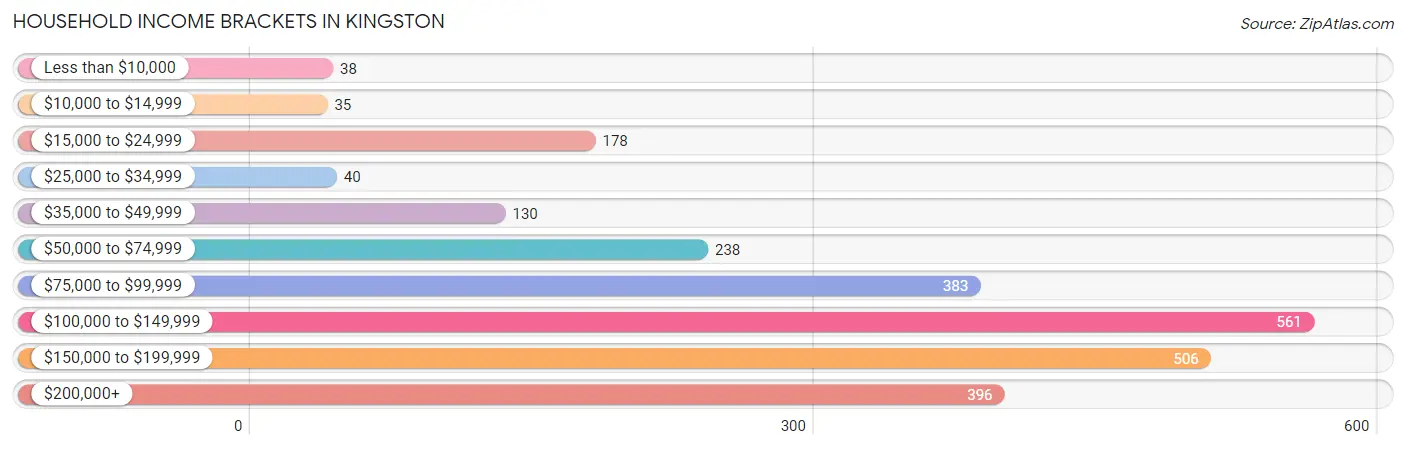
| Income Bracket | # Households | % Households |
| Less than $10,000 | 38 | 1.5% |
| $10,000 to $14,999 | 35 | 1.4% |
| $15,000 to $24,999 | 178 | 7.1% |
| $25,000 to $34,999 | 40 | 1.6% |
| $35,000 to $49,999 | 130 | 5.2% |
| $50,000 to $74,999 | 238 | 9.5% |
| $75,000 to $99,999 | 383 | 15.3% |
| $100,000 to $149,999 | 561 | 22.4% |
| $150,000 to $199,999 | 506 | 20.2% |
| $200,000+ | 396 | 15.8% |
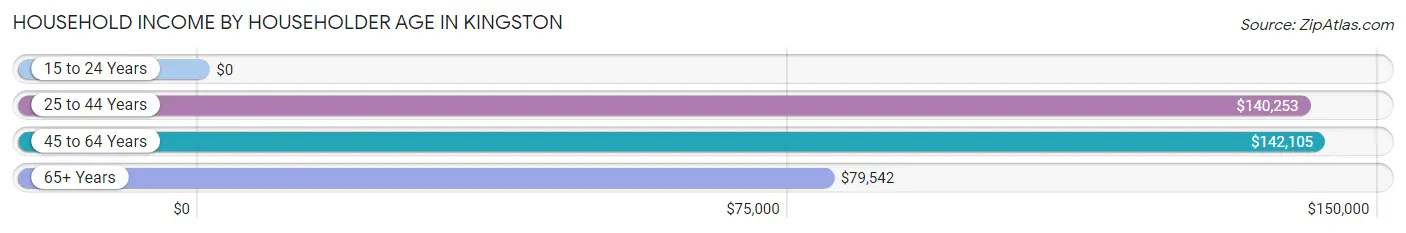
Household Income by Householder Age in Kingston
The median household income in Kingston is $124,048, with the highest median household income of $142,105 found in the 45 to 64 years age bracket for the primary householder. A total of 936 households (37.4%) fall into this category.
| Income Bracket | # Households | Median Income |
| 15 to 24 Years | 0 (0.0%) | $0 |
| 25 to 44 Years | 695 (27.8%) | $140,253 |
| 45 to 64 Years | 936 (37.4%) | $142,105 |
| 65+ Years | 873 (34.9%) | $79,542 |
| Total | 2,504 (100.0%) | $124,048 |
Poverty in Kingston
Income Below Poverty by Sex and Age in Kingston
With 2.8% poverty level for males and 1.5% for females among the residents of Kingston, 55 to 64 year old males and 12 to 14 year old females are the most vulnerable to poverty, with 39 males (25.2%) and 7 females (12.5%) in their respective age groups living below the poverty level.
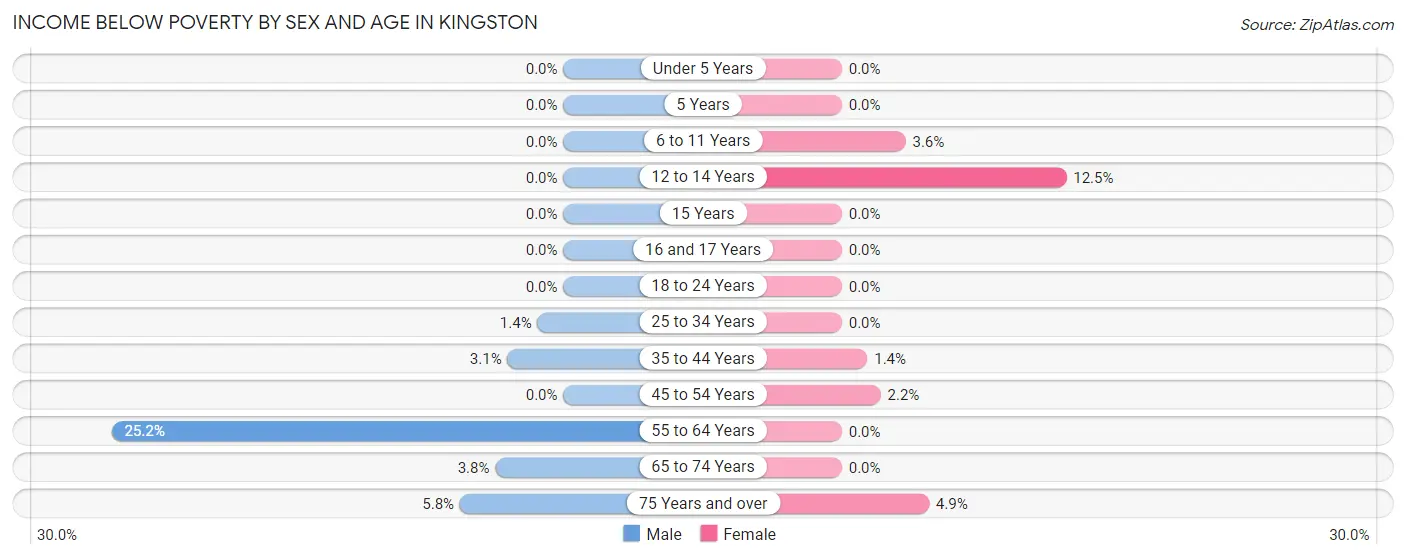
| Age Bracket | Male | Female |
| Under 5 Years | 0 (0.0%) | 0 (0.0%) |
| 5 Years | 0 (0.0%) | 0 (0.0%) |
| 6 to 11 Years | 0 (0.0%) | 7 (3.5%) |
| 12 to 14 Years | 0 (0.0%) | 7 (12.5%) |
| 15 Years | 0 (0.0%) | 0 (0.0%) |
| 16 and 17 Years | 0 (0.0%) | 0 (0.0%) |
| 18 to 24 Years | 0 (0.0%) | 0 (0.0%) |
| 25 to 34 Years | 6 (1.4%) | 0 (0.0%) |
| 35 to 44 Years | 9 (3.1%) | 8 (1.4%) |
| 45 to 54 Years | 0 (0.0%) | 13 (2.2%) |
| 55 to 64 Years | 39 (25.2%) | 0 (0.0%) |
| 65 to 74 Years | 19 (3.8%) | 0 (0.0%) |
| 75 Years and over | 11 (5.8%) | 11 (4.9%) |
| Total | 84 (2.8%) | 46 (1.5%) |
Income Above Poverty by Sex and Age in Kingston
According to the poverty statistics in Kingston, males aged under 5 years and females aged under 5 years are the age groups that are most secure financially, with 100.0% of males and 100.0% of females in these age groups living above the poverty line.
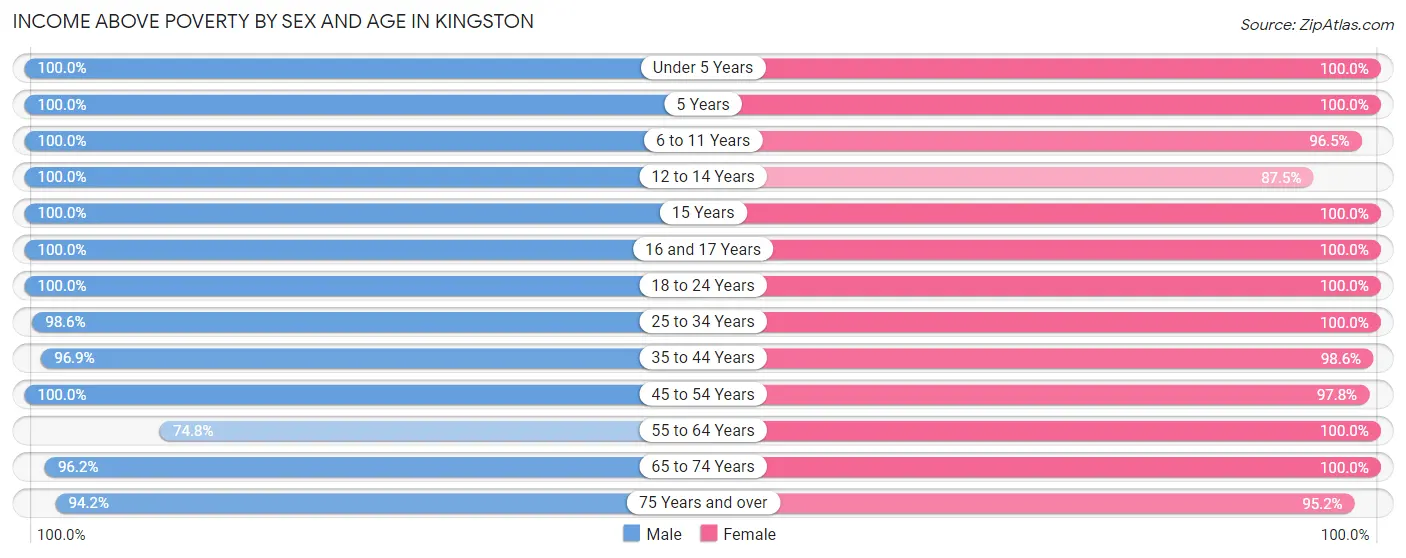
| Age Bracket | Male | Female |
| Under 5 Years | 137 (100.0%) | 44 (100.0%) |
| 5 Years | 18 (100.0%) | 79 (100.0%) |
| 6 to 11 Years | 147 (100.0%) | 190 (96.5%) |
| 12 to 14 Years | 113 (100.0%) | 49 (87.5%) |
| 15 Years | 37 (100.0%) | 20 (100.0%) |
| 16 and 17 Years | 69 (100.0%) | 208 (100.0%) |
| 18 to 24 Years | 301 (100.0%) | 54 (100.0%) |
| 25 to 34 Years | 412 (98.6%) | 200 (100.0%) |
| 35 to 44 Years | 280 (96.9%) | 556 (98.6%) |
| 45 to 54 Years | 666 (100.0%) | 589 (97.8%) |
| 55 to 64 Years | 116 (74.8%) | 355 (100.0%) |
| 65 to 74 Years | 482 (96.2%) | 366 (100.0%) |
| 75 Years and over | 180 (94.2%) | 216 (95.2%) |
| Total | 2,958 (97.2%) | 2,926 (98.5%) |
Income Below Poverty Among Married-Couple Families in Kingston
The poverty statistics for married-couple families in Kingston show that 0.8% or 11 of the total 1,302 families live below the poverty line. Families with no children have the highest poverty rate of 1.5%, comprising of 11 families. On the other hand, families with 1 or 2 children have the lowest poverty rate of 0.0%, which includes 0 families.
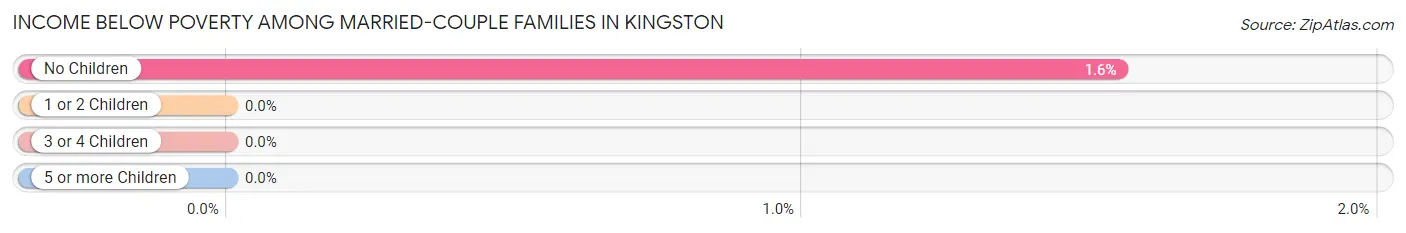
| Children | Above Poverty | Below Poverty |
| No Children | 698 (98.5%) | 11 (1.5%) |
| 1 or 2 Children | 495 (100.0%) | 0 (0.0%) |
| 3 or 4 Children | 98 (100.0%) | 0 (0.0%) |
| 5 or more Children | 0 (0.0%) | 0 (0.0%) |
| Total | 1,291 (99.2%) | 11 (0.8%) |
Income Below Poverty Among Single-Parent Households in Kingston
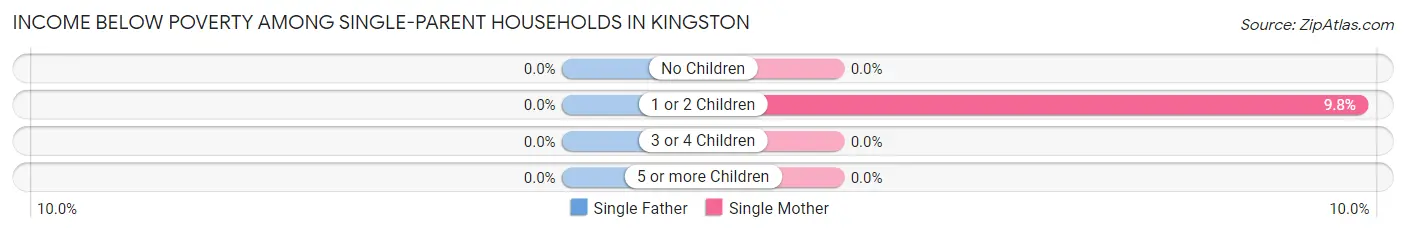
| Children | Single Father | Single Mother |
| No Children | 0 (0.0%) | 0 (0.0%) |
| 1 or 2 Children | 0 (0.0%) | 8 (9.8%) |
| 3 or 4 Children | 0 (0.0%) | 0 (0.0%) |
| 5 or more Children | 0 (0.0%) | 0 (0.0%) |
| Total | 0 (0.0%) | 8 (3.5%) |
Income Below Poverty Among Married-Couple vs Single-Parent Households in Kingston
The poverty data for Kingston shows that 11 of the married-couple family households (0.8%) and 8 of the single-parent households (2.4%) are living below the poverty level. Within the married-couple family households, those with no children have the highest poverty rate, with 11 households (1.5%) falling below the poverty line. Among the single-parent households, those with 1 or 2 children have the highest poverty rate, with 8 household (4.2%) living below poverty.
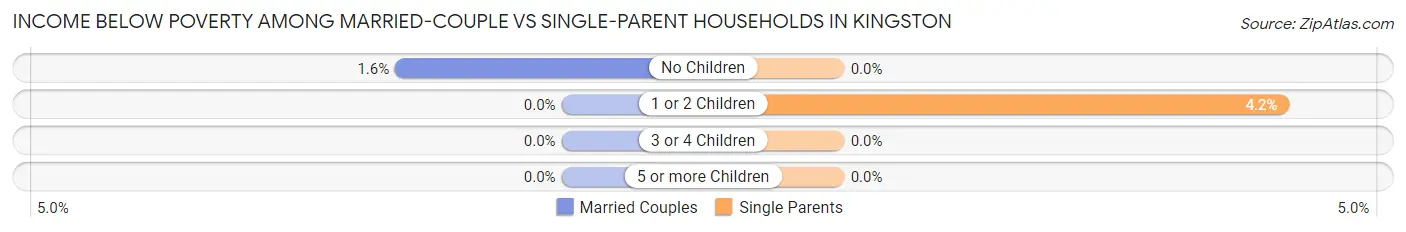
| Children | Married-Couple Families | Single-Parent Households |
| No Children | 11 (1.5%) | 0 (0.0%) |
| 1 or 2 Children | 0 (0.0%) | 8 (4.2%) |
| 3 or 4 Children | 0 (0.0%) | 0 (0.0%) |
| 5 or more Children | 0 (0.0%) | 0 (0.0%) |
| Total | 11 (0.8%) | 8 (2.4%) |
Race in Kingston
The most populous races in Kingston are White / Caucasian (5,941 | 97.6%), Hispanic or Latino (185 | 3.0%), and Two or more Races (104 | 1.7%).
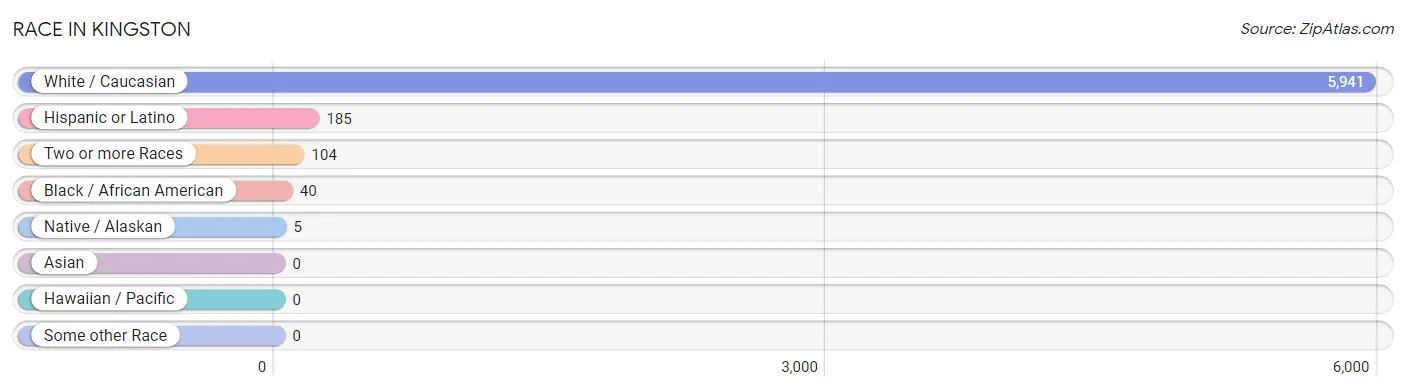
| Race | # Population | % Population |
| Asian | 0 | 0.0% |
| Black / African American | 40 | 0.7% |
| Hawaiian / Pacific | 0 | 0.0% |
| Hispanic or Latino | 185 | 3.0% |
| Native / Alaskan | 5 | 0.1% |
| White / Caucasian | 5,941 | 97.6% |
| Two or more Races | 104 | 1.7% |
| Some other Race | 0 | 0.0% |
| Total | 6,090 | 100.0% |
Ancestry in Kingston
The most populous ancestries reported in Kingston are Irish (2,404 | 39.5%), English (1,228 | 20.2%), Italian (627 | 10.3%), German (461 | 7.6%), and European (349 | 5.7%), together accounting for 83.2% of all Kingston residents.
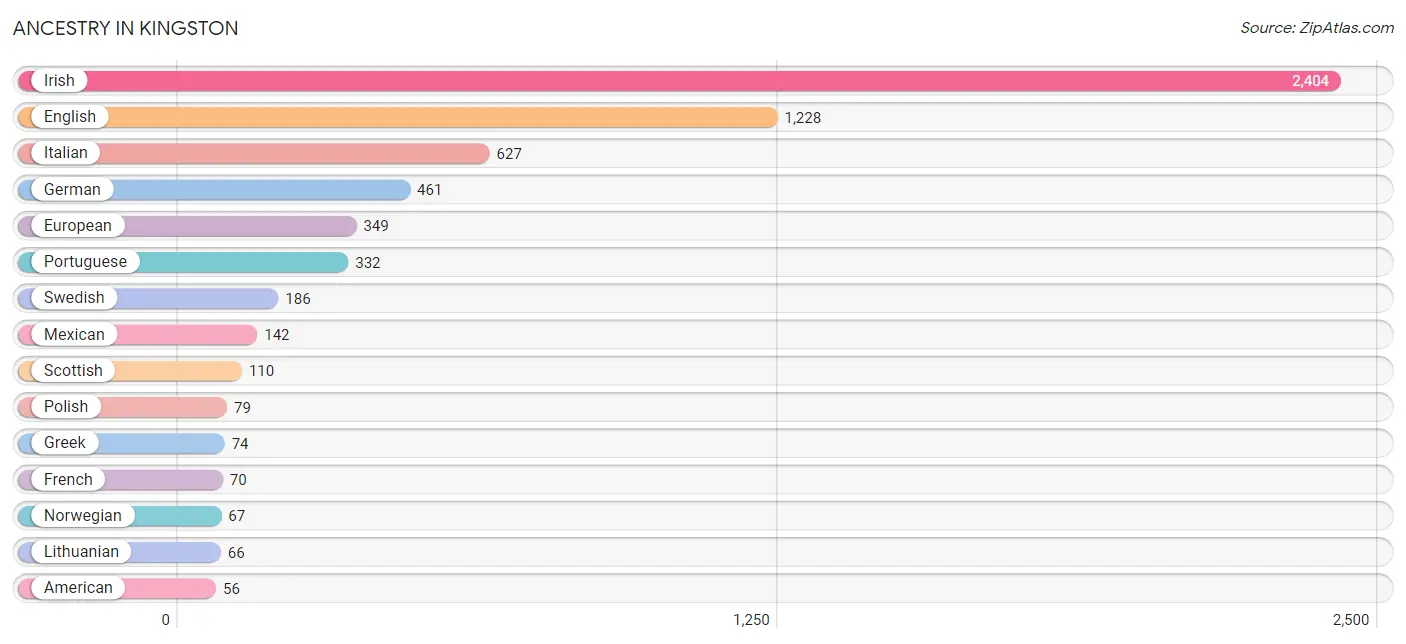
| Ancestry | # Population | % Population |
| American | 56 | 0.9% |
| Arab | 13 | 0.2% |
| British | 49 | 0.8% |
| Canadian | 11 | 0.2% |
| Czech | 13 | 0.2% |
| Dutch | 56 | 0.9% |
| Eastern European | 20 | 0.3% |
| English | 1,228 | 20.2% |
| European | 349 | 5.7% |
| Finnish | 18 | 0.3% |
| French | 70 | 1.1% |
| French Canadian | 18 | 0.3% |
| German | 461 | 7.6% |
| Greek | 74 | 1.2% |
| Iranian | 43 | 0.7% |
| Irish | 2,404 | 39.5% |
| Italian | 627 | 10.3% |
| Lebanese | 13 | 0.2% |
| Lithuanian | 66 | 1.1% |
| Mexican | 142 | 2.3% |
| Norwegian | 67 | 1.1% |
| Polish | 79 | 1.3% |
| Portuguese | 332 | 5.4% |
| Russian | 29 | 0.5% |
| Scotch-Irish | 41 | 0.7% |
| Scottish | 110 | 1.8% |
| Spaniard | 43 | 0.7% |
| Swedish | 186 | 3.0% |
| Ukrainian | 19 | 0.3% | View All 29 Rows |
Immigrants in Kingston
The most numerous immigrant groups reported in Kingston came from Europe (107 | 1.8%), Northern Europe (80 | 1.3%), England (31 | 0.5%), Southern Europe (27 | 0.4%), and Portugal (15 | 0.3%), together accounting for 4.3% of all Kingston residents.
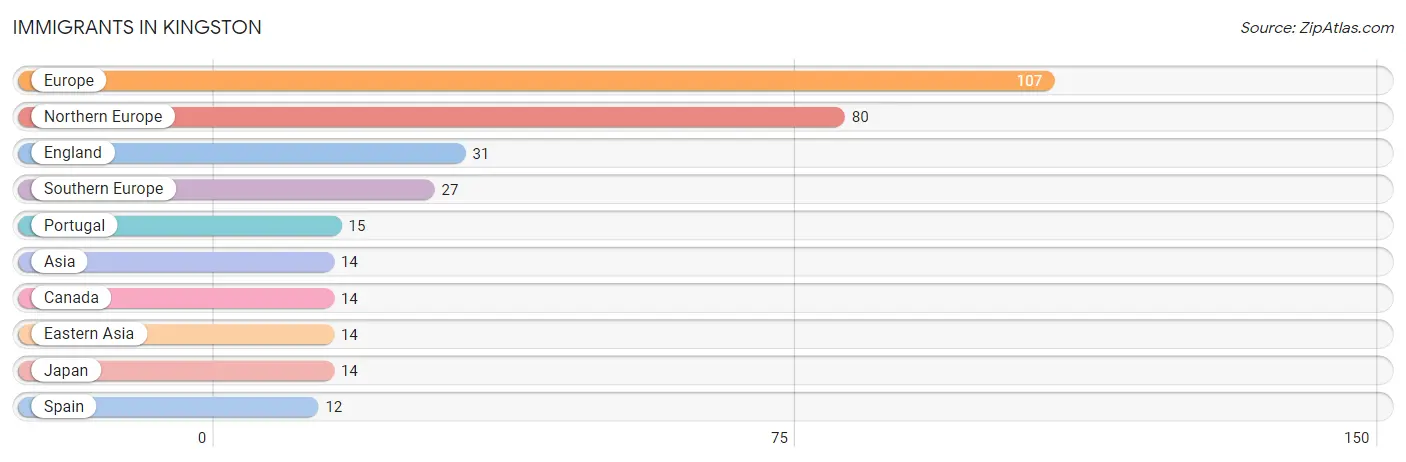
| Immigration Origin | # Population | % Population |
| Asia | 14 | 0.2% |
| Canada | 14 | 0.2% |
| Eastern Asia | 14 | 0.2% |
| England | 31 | 0.5% |
| Europe | 107 | 1.8% |
| Japan | 14 | 0.2% |
| Northern Europe | 80 | 1.3% |
| Portugal | 15 | 0.3% |
| Southern Europe | 27 | 0.4% |
| Spain | 12 | 0.2% | View All 10 Rows |
Sex and Age in Kingston
Sex and Age in Kingston
The most populous age groups in Kingston are 45 to 49 Years (370 | 12.0%) for men and 50 to 54 Years (484 | 16.1%) for women.
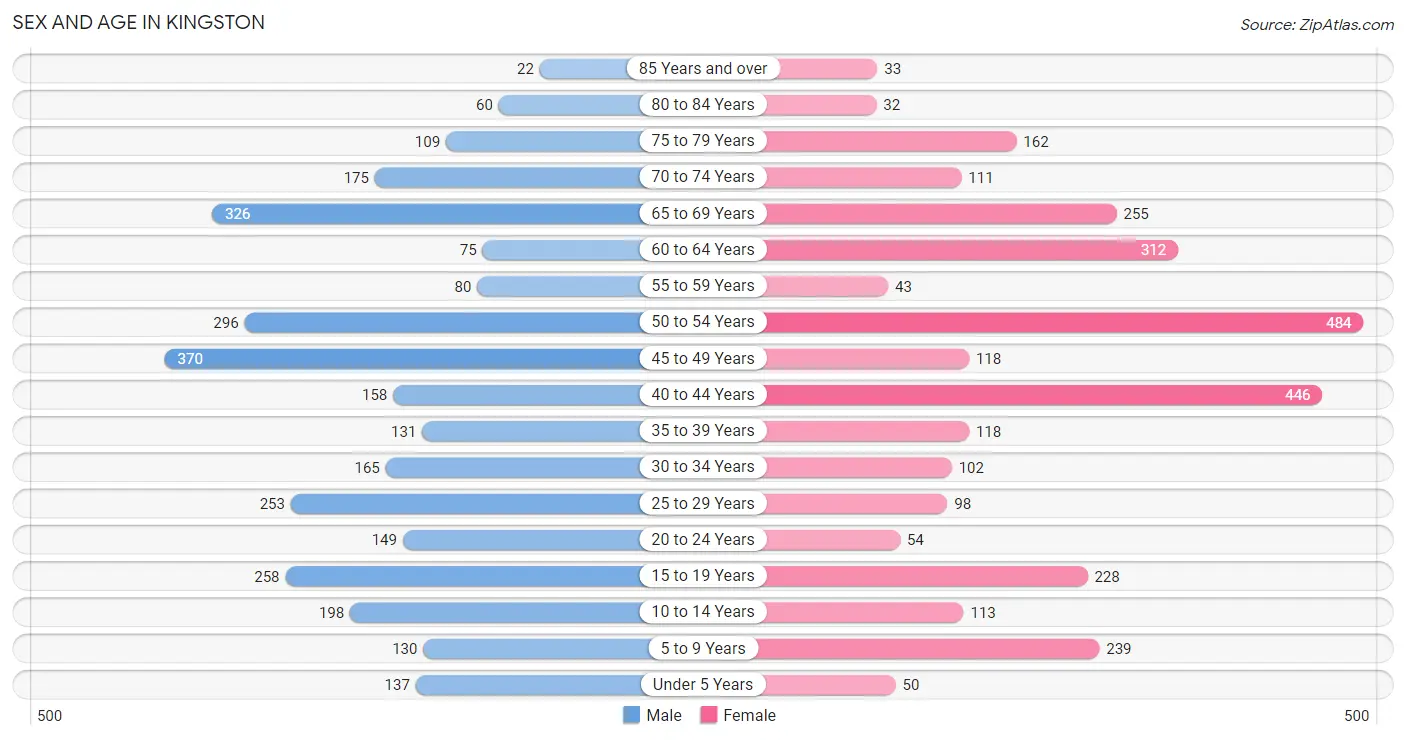
| Age Bracket | Male | Female |
| Under 5 Years | 137 (4.4%) | 50 (1.7%) |
| 5 to 9 Years | 130 (4.2%) | 239 (8.0%) |
| 10 to 14 Years | 198 (6.4%) | 113 (3.8%) |
| 15 to 19 Years | 258 (8.3%) | 228 (7.6%) |
| 20 to 24 Years | 149 (4.8%) | 54 (1.8%) |
| 25 to 29 Years | 253 (8.2%) | 98 (3.3%) |
| 30 to 34 Years | 165 (5.3%) | 102 (3.4%) |
| 35 to 39 Years | 131 (4.2%) | 118 (3.9%) |
| 40 to 44 Years | 158 (5.1%) | 446 (14.9%) |
| 45 to 49 Years | 370 (12.0%) | 118 (3.9%) |
| 50 to 54 Years | 296 (9.6%) | 484 (16.1%) |
| 55 to 59 Years | 80 (2.6%) | 43 (1.4%) |
| 60 to 64 Years | 75 (2.4%) | 312 (10.4%) |
| 65 to 69 Years | 326 (10.5%) | 255 (8.5%) |
| 70 to 74 Years | 175 (5.7%) | 111 (3.7%) |
| 75 to 79 Years | 109 (3.5%) | 162 (5.4%) |
| 80 to 84 Years | 60 (1.9%) | 32 (1.1%) |
| 85 Years and over | 22 (0.7%) | 33 (1.1%) |
| Total | 3,092 (100.0%) | 2,998 (100.0%) |
Families and Households in Kingston
Median Family Size in Kingston
The median family size in Kingston is 2.94 persons per family, with married-couple families (1,302 | 79.4%) accounting for the largest median family size of 3.12 persons per family. On the other hand, single male/father families (111 | 6.8%) represent the smallest median family size with 2.07 persons per family.
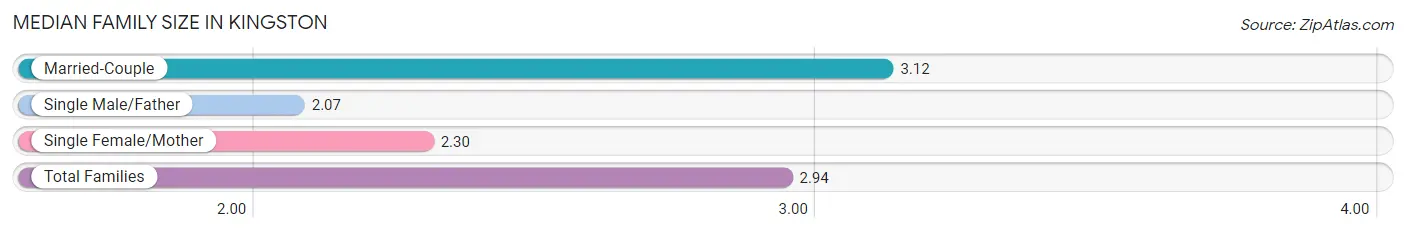
| Family Type | # Families | Family Size |
| Married-Couple | 1,302 (79.4%) | 3.12 |
| Single Male/Father | 111 (6.8%) | 2.07 |
| Single Female/Mother | 227 (13.8%) | 2.30 |
| Total Families | 1,640 (100.0%) | 2.94 |
Median Household Size in Kingston
The median household size in Kingston is 2.43 persons per household, with married-couple households (1,302 | 52.0%) accounting for the largest median household size of 3.17 persons per household. non-family households (864 | 34.5%) represent the smallest median household size with 1.24 persons per household.
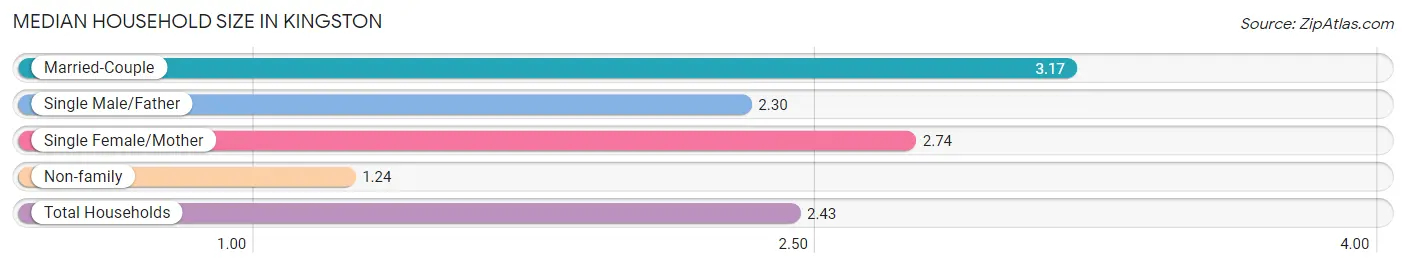
| Household Type | # Households | Household Size |
| Married-Couple | 1,302 (52.0%) | 3.17 |
| Single Male/Father | 111 (4.4%) | 2.30 |
| Single Female/Mother | 227 (9.1%) | 2.74 |
| Non-family | 864 (34.5%) | 1.24 |
| Total Households | 2,504 (100.0%) | 2.43 |
Household Size by Marriage Status in Kingston
Out of a total of 2,504 households in Kingston, 1,640 (65.5%) are family households, while 864 (34.5%) are nonfamily households. The most numerous type of family households are 2-person households, comprising 746, and the most common type of nonfamily households are 1-person households, comprising 718.
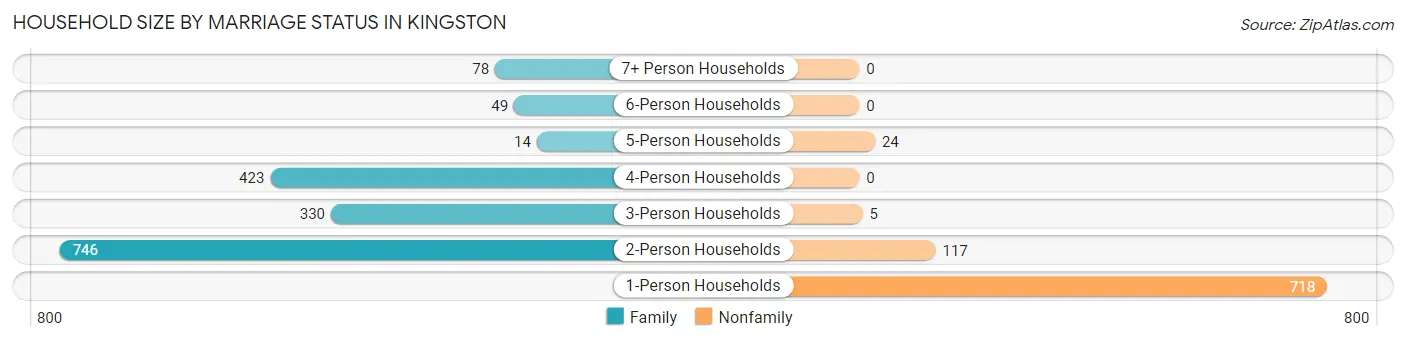
| Household Size | Family Households | Nonfamily Households |
| 1-Person Households | - | 718 (28.7%) |
| 2-Person Households | 746 (29.8%) | 117 (4.7%) |
| 3-Person Households | 330 (13.2%) | 5 (0.2%) |
| 4-Person Households | 423 (16.9%) | 0 (0.0%) |
| 5-Person Households | 14 (0.6%) | 24 (1.0%) |
| 6-Person Households | 49 (2.0%) | 0 (0.0%) |
| 7+ Person Households | 78 (3.1%) | 0 (0.0%) |
| Total | 1,640 (65.5%) | 864 (34.5%) |
Female Fertility in Kingston
Fertility by Age in Kingston
Average fertility rate in Kingston is 8.0 births per 1,000 women. Women in the age bracket of 20 to 34 years have the highest fertility rate with 35.0 births per 1,000 women. Women in the age bracket of 20 to 34 years acount for 100.0% of all women with births.
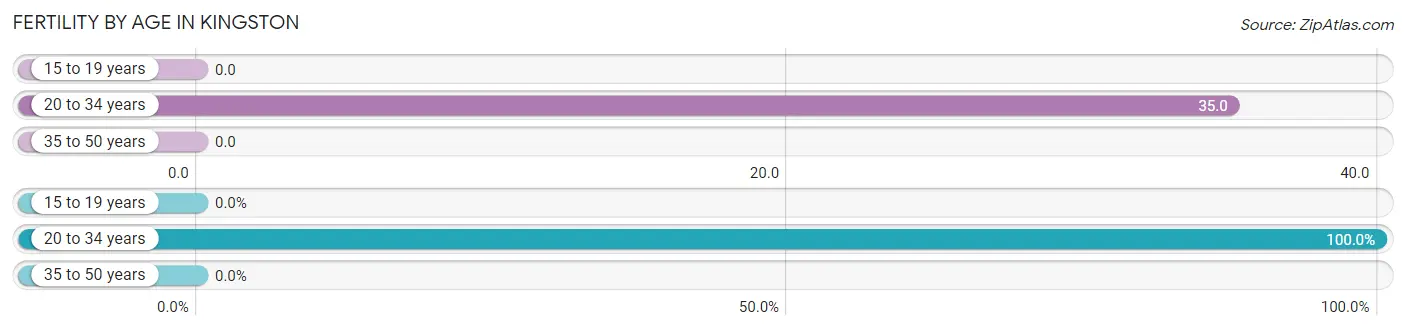
| Age Bracket | Women with Births | Births / 1,000 Women |
| 15 to 19 years | 0 (0.0%) | 0.0 |
| 20 to 34 years | 9 (100.0%) | 35.0 |
| 35 to 50 years | 0 (0.0%) | 0.0 |
| Total | 9 (100.0%) | 8.0 |
Fertility by Age by Marriage Status in Kingston
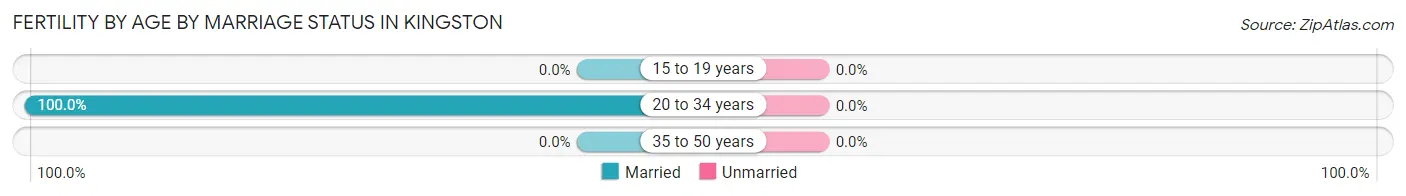
| Age Bracket | Married | Unmarried |
| 15 to 19 years | 0 (0.0%) | 0 (0.0%) |
| 20 to 34 years | 9 (100.0%) | 0 (0.0%) |
| 35 to 50 years | 0 (0.0%) | 0 (0.0%) |
| Total | 9 (100.0%) | 0 (0.0%) |
Fertility by Education in Kingston
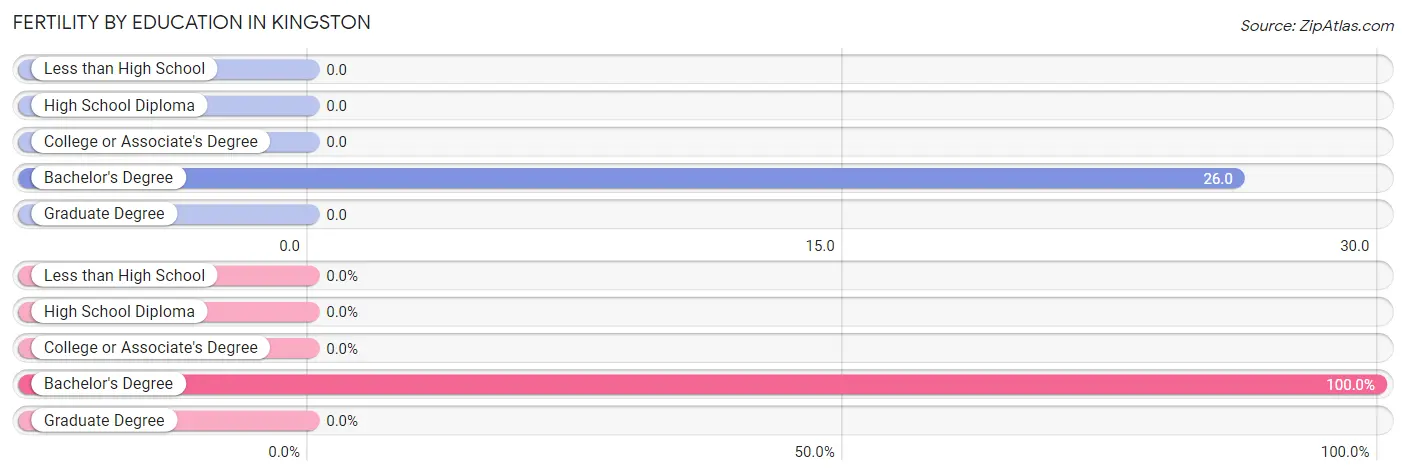
| Educational Attainment | Women with Births | Births / 1,000 Women |
| Less than High School | 0 (0.0%) | 0.0 |
| High School Diploma | 0 (0.0%) | 0.0 |
| College or Associate's Degree | 0 (0.0%) | 0.0 |
| Bachelor's Degree | 9 (100.0%) | 26.0 |
| Graduate Degree | 0 (0.0%) | 0.0 |
| Total | 9 (100.0%) | 8.0 |
Fertility by Education by Marriage Status in Kingston
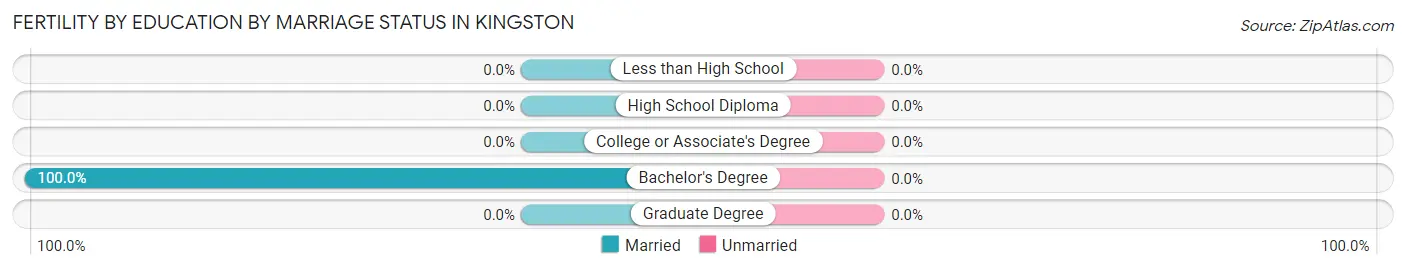
| Educational Attainment | Married | Unmarried |
| Less than High School | 0 (0.0%) | 0 (0.0%) |
| High School Diploma | 0 (0.0%) | 0 (0.0%) |
| College or Associate's Degree | 0 (0.0%) | 0 (0.0%) |
| Bachelor's Degree | 9 (100.0%) | 0 (0.0%) |
| Graduate Degree | 0 (0.0%) | 0 (0.0%) |
| Total | 9 (100.0%) | 0 (0.0%) |
Employment Characteristics in Kingston
Employment by Class of Employer in Kingston
Among the 3,622 employed individuals in Kingston, private company employees (2,250 | 62.1%), not-for-profit organizations (391 | 10.8%), and self-employed (not incorporated) (278 | 7.7%) make up the most common classes of employment.
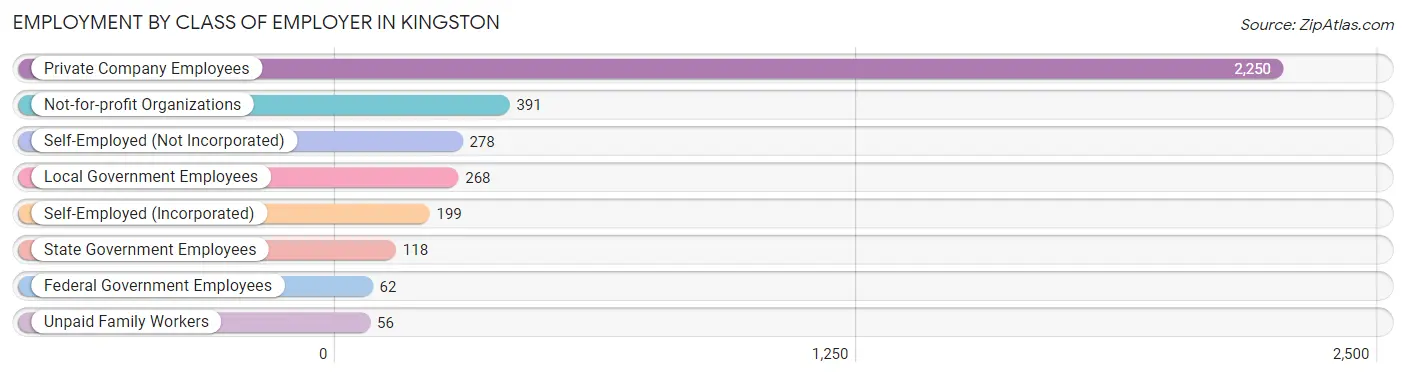
| Employer Class | # Employees | % Employees |
| Private Company Employees | 2,250 | 62.1% |
| Self-Employed (Incorporated) | 199 | 5.5% |
| Self-Employed (Not Incorporated) | 278 | 7.7% |
| Not-for-profit Organizations | 391 | 10.8% |
| Local Government Employees | 268 | 7.4% |
| State Government Employees | 118 | 3.3% |
| Federal Government Employees | 62 | 1.7% |
| Unpaid Family Workers | 56 | 1.5% |
| Total | 3,622 | 100.0% |
Employment Status by Age in Kingston
According to the labor force statistics for Kingston, out of the total population over 16 years of age (5,166), 72.6% or 3,751 individuals are in the labor force, with 2.3% or 86 of them unemployed. The age group with the highest labor force participation rate is 55 to 59 years, with 100.0% or 123 individuals in the labor force. Within the labor force, the 45 to 54 years age range has the highest percentage of unemployed individuals, with 6.3% or 77 of them being unemployed.
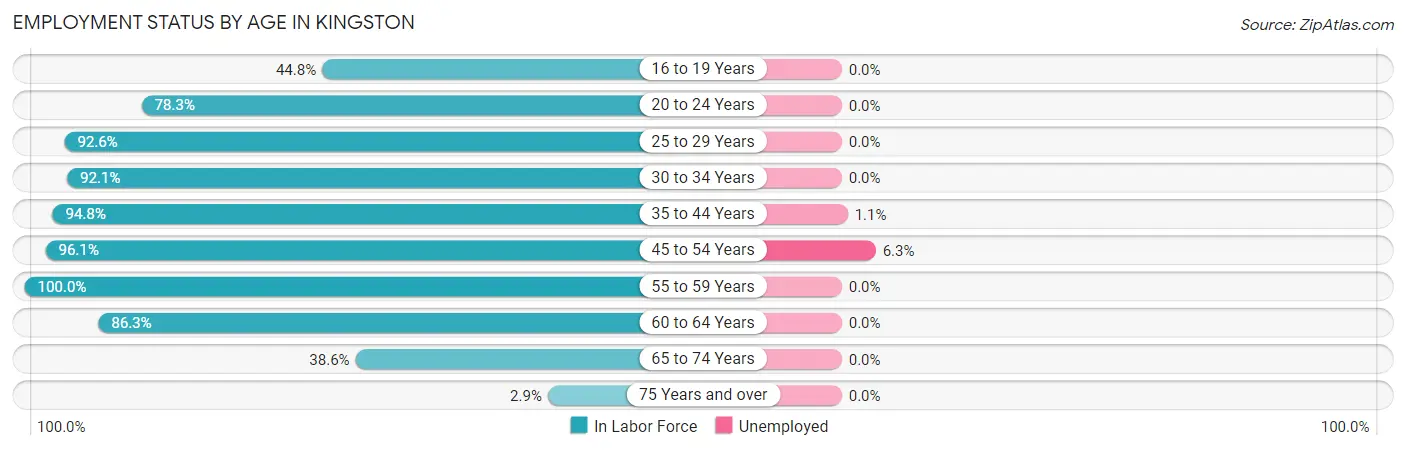
| Age Bracket | In Labor Force | Unemployed |
| 16 to 19 Years | 192 (44.8%) | 0 (0.0%) |
| 20 to 24 Years | 159 (78.3%) | 0 (0.0%) |
| 25 to 29 Years | 325 (92.6%) | 0 (0.0%) |
| 30 to 34 Years | 246 (92.1%) | 0 (0.0%) |
| 35 to 44 Years | 809 (94.8%) | 9 (1.1%) |
| 45 to 54 Years | 1,219 (96.1%) | 77 (6.3%) |
| 55 to 59 Years | 123 (100.0%) | 0 (0.0%) |
| 60 to 64 Years | 334 (86.3%) | 0 (0.0%) |
| 65 to 74 Years | 335 (38.6%) | 0 (0.0%) |
| 75 Years and over | 12 (2.9%) | 0 (0.0%) |
| Total | 3,751 (72.6%) | 86 (2.3%) |
Employment Status by Educational Attainment in Kingston
According to labor force statistics for Kingston, 94.0% of individuals (3,054) out of the total population between 25 and 64 years of age (3,249) are in the labor force, with 2.8% or 86 of them being unemployed. The group with the highest labor force participation rate are those with the educational attainment of bachelor's degree or higher, with 96.0% or 1,712 individuals in the labor force. Within the labor force, individuals with bachelor's degree or higher education have the highest percentage of unemployment, with 4.5% or 77 of them being unemployed.
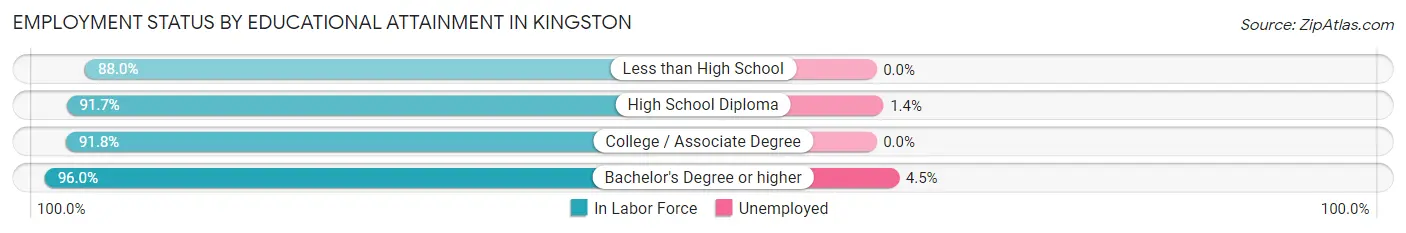
| Educational Attainment | In Labor Force | Unemployed |
| Less than High School | 44 (88.0%) | 0 (0.0%) |
| High School Diploma | 652 (91.7%) | 10 (1.4%) |
| College / Associate Degree | 647 (91.8%) | 0 (0.0%) |
| Bachelor's Degree or higher | 1,712 (96.0%) | 80 (4.5%) |
| Total | 3,054 (94.0%) | 91 (2.8%) |
Employment Occupations by Sex in Kingston
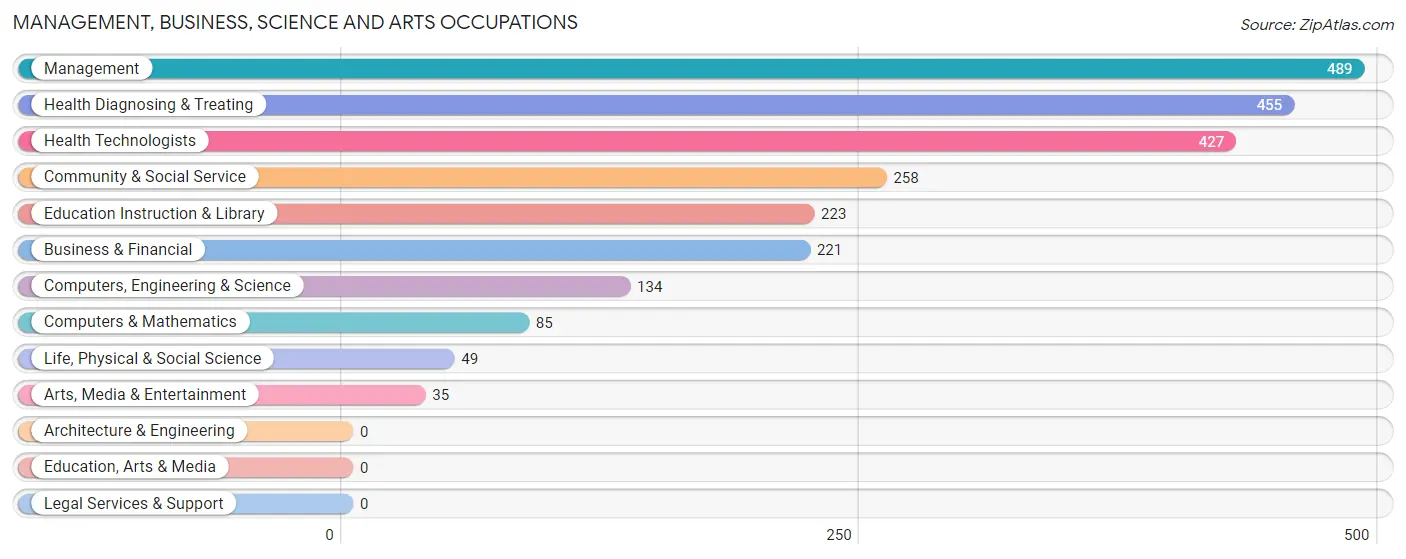
Management, Business, Science and Arts Occupations
The most common Management, Business, Science and Arts occupations in Kingston are Management (489 | 13.3%), Health Diagnosing & Treating (455 | 12.4%), Health Technologists (427 | 11.6%), Community & Social Service (258 | 7.0%), and Education Instruction & Library (223 | 6.1%).
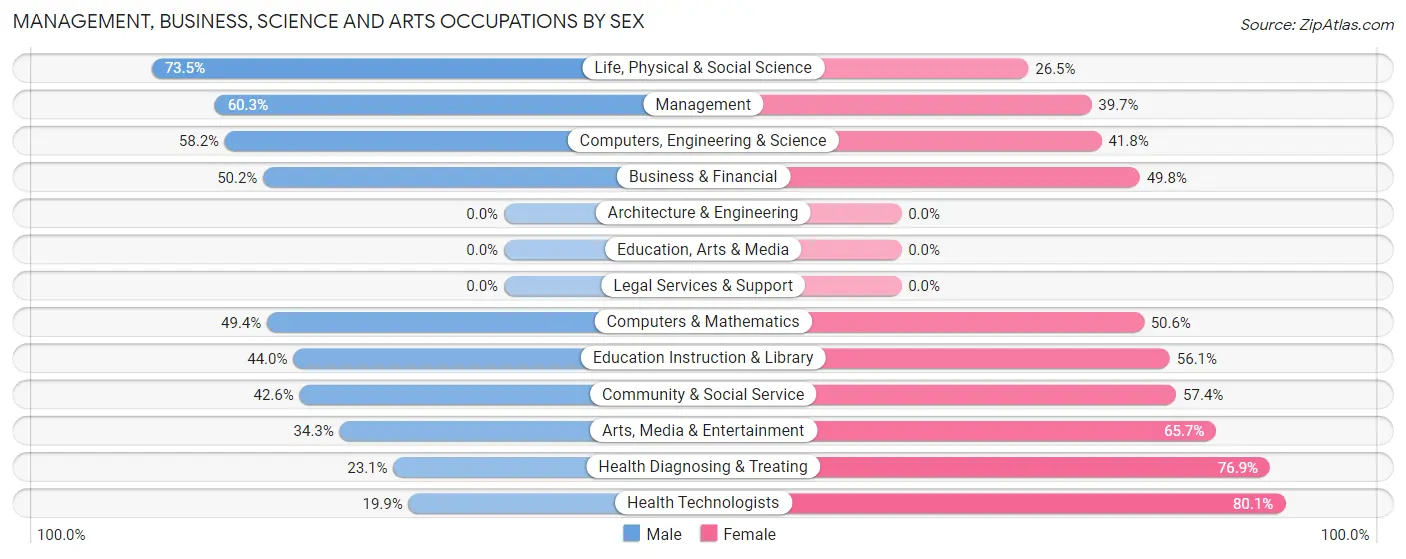
Management, Business, Science and Arts Occupations by Sex
Within the Management, Business, Science and Arts occupations in Kingston, the most male-oriented occupations are Life, Physical & Social Science (73.5%), Management (60.3%), and Computers, Engineering & Science (58.2%), while the most female-oriented occupations are Health Technologists (80.1%), Health Diagnosing & Treating (76.9%), and Arts, Media & Entertainment (65.7%).
| Occupation | Male | Female |
| Management | 295 (60.3%) | 194 (39.7%) |
| Business & Financial | 111 (50.2%) | 110 (49.8%) |
| Computers, Engineering & Science | 78 (58.2%) | 56 (41.8%) |
| Computers & Mathematics | 42 (49.4%) | 43 (50.6%) |
| Architecture & Engineering | 0 (0.0%) | 0 (0.0%) |
| Life, Physical & Social Science | 36 (73.5%) | 13 (26.5%) |
| Community & Social Service | 110 (42.6%) | 148 (57.4%) |
| Education, Arts & Media | 0 (0.0%) | 0 (0.0%) |
| Legal Services & Support | 0 (0.0%) | 0 (0.0%) |
| Education Instruction & Library | 98 (44.0%) | 125 (56.0%) |
| Arts, Media & Entertainment | 12 (34.3%) | 23 (65.7%) |
| Health Diagnosing & Treating | 105 (23.1%) | 350 (76.9%) |
| Health Technologists | 85 (19.9%) | 342 (80.1%) |
| Total (Category) | 699 (44.9%) | 858 (55.1%) |
| Total (Overall) | 1,954 (53.3%) | 1,713 (46.7%) |
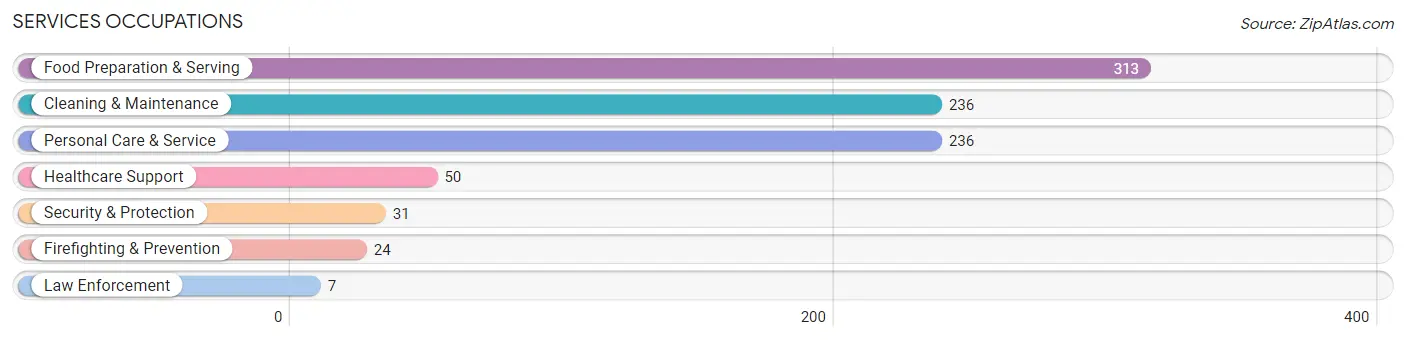
Services Occupations
The most common Services occupations in Kingston are Food Preparation & Serving (313 | 8.5%), Cleaning & Maintenance (236 | 6.4%), Personal Care & Service (236 | 6.4%), Healthcare Support (50 | 1.4%), and Security & Protection (31 | 0.9%).
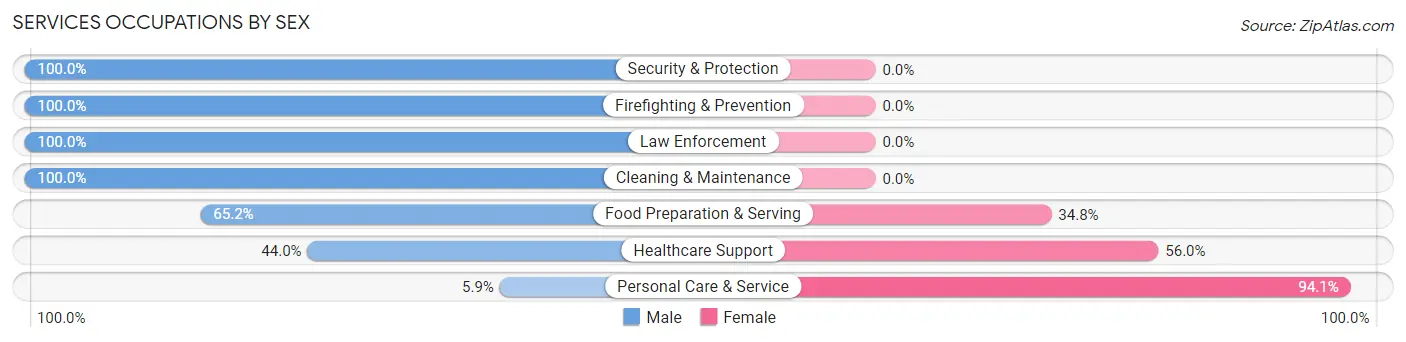
Services Occupations by Sex
Within the Services occupations in Kingston, the most male-oriented occupations are Security & Protection (100.0%), Firefighting & Prevention (100.0%), and Law Enforcement (100.0%), while the most female-oriented occupations are Personal Care & Service (94.1%), Healthcare Support (56.0%), and Food Preparation & Serving (34.8%).
| Occupation | Male | Female |
| Healthcare Support | 22 (44.0%) | 28 (56.0%) |
| Security & Protection | 31 (100.0%) | 0 (0.0%) |
| Firefighting & Prevention | 24 (100.0%) | 0 (0.0%) |
| Law Enforcement | 7 (100.0%) | 0 (0.0%) |
| Food Preparation & Serving | 204 (65.2%) | 109 (34.8%) |
| Cleaning & Maintenance | 236 (100.0%) | 0 (0.0%) |
| Personal Care & Service | 14 (5.9%) | 222 (94.1%) |
| Total (Category) | 507 (58.6%) | 359 (41.4%) |
| Total (Overall) | 1,954 (53.3%) | 1,713 (46.7%) |
Sales and Office Occupations
The most common Sales and Office occupations in Kingston are Sales & Related (476 | 13.0%), and Office & Administration (144 | 3.9%).
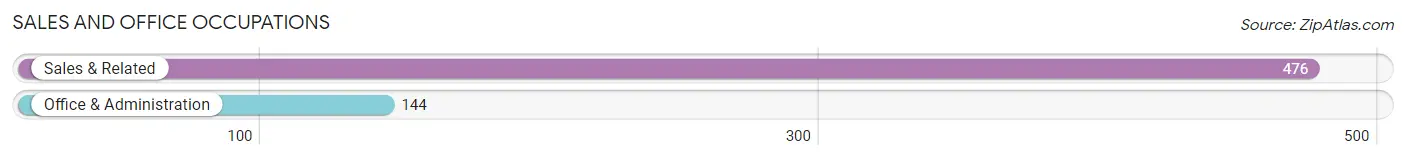
Sales and Office Occupations by Sex
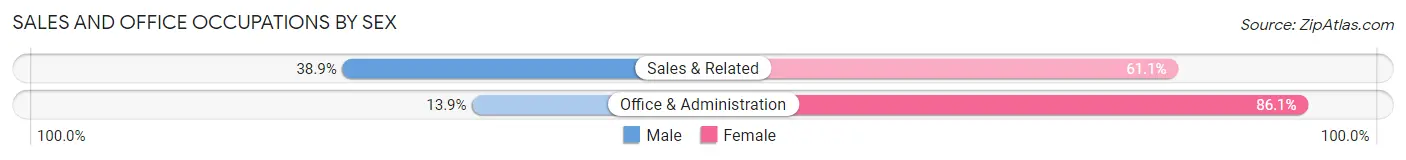
| Occupation | Male | Female |
| Sales & Related | 185 (38.9%) | 291 (61.1%) |
| Office & Administration | 20 (13.9%) | 124 (86.1%) |
| Total (Category) | 205 (33.1%) | 415 (66.9%) |
| Total (Overall) | 1,954 (53.3%) | 1,713 (46.7%) |
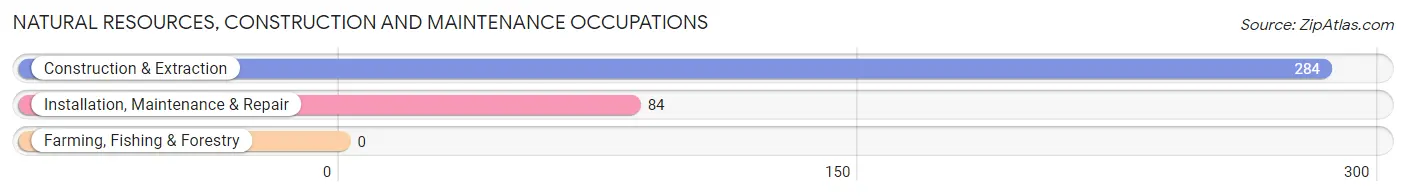
Natural Resources, Construction and Maintenance Occupations
The most common Natural Resources, Construction and Maintenance occupations in Kingston are Construction & Extraction (284 | 7.7%), and Installation, Maintenance & Repair (84 | 2.3%).
Natural Resources, Construction and Maintenance Occupations by Sex
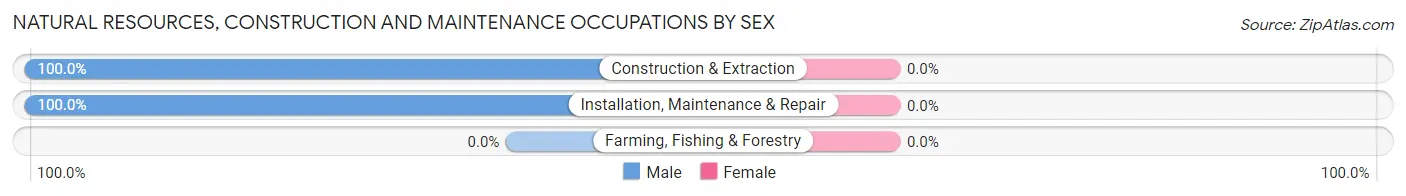
| Occupation | Male | Female |
| Farming, Fishing & Forestry | 0 (0.0%) | 0 (0.0%) |
| Construction & Extraction | 284 (100.0%) | 0 (0.0%) |
| Installation, Maintenance & Repair | 84 (100.0%) | 0 (0.0%) |
| Total (Category) | 368 (100.0%) | 0 (0.0%) |
| Total (Overall) | 1,954 (53.3%) | 1,713 (46.7%) |
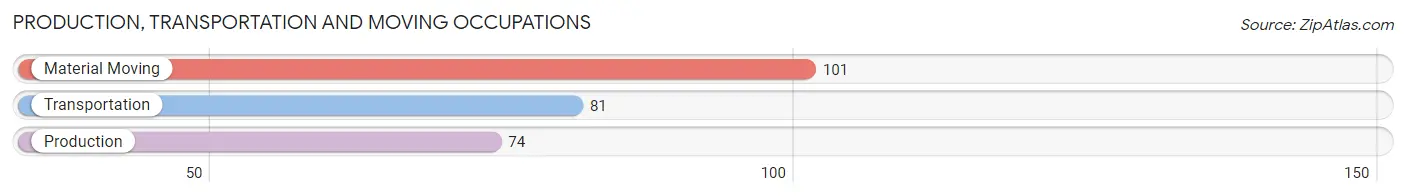
Production, Transportation and Moving Occupations
The most common Production, Transportation and Moving occupations in Kingston are Material Moving (101 | 2.8%), Transportation (81 | 2.2%), and Production (74 | 2.0%).
Production, Transportation and Moving Occupations by Sex
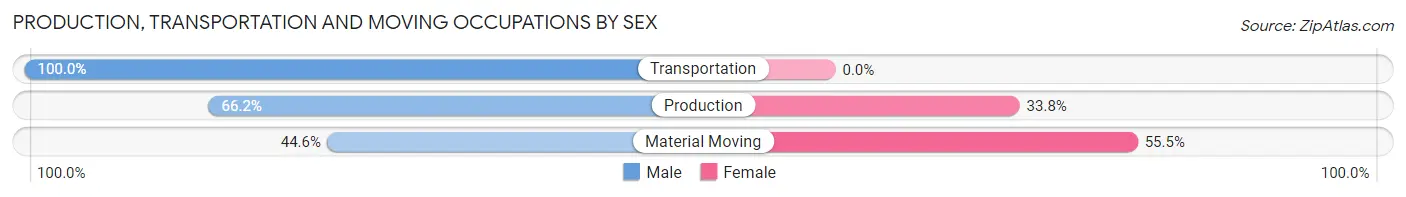
| Occupation | Male | Female |
| Production | 49 (66.2%) | 25 (33.8%) |
| Transportation | 81 (100.0%) | 0 (0.0%) |
| Material Moving | 45 (44.6%) | 56 (55.4%) |
| Total (Category) | 175 (68.4%) | 81 (31.6%) |
| Total (Overall) | 1,954 (53.3%) | 1,713 (46.7%) |
Employment Industries by Sex in Kingston
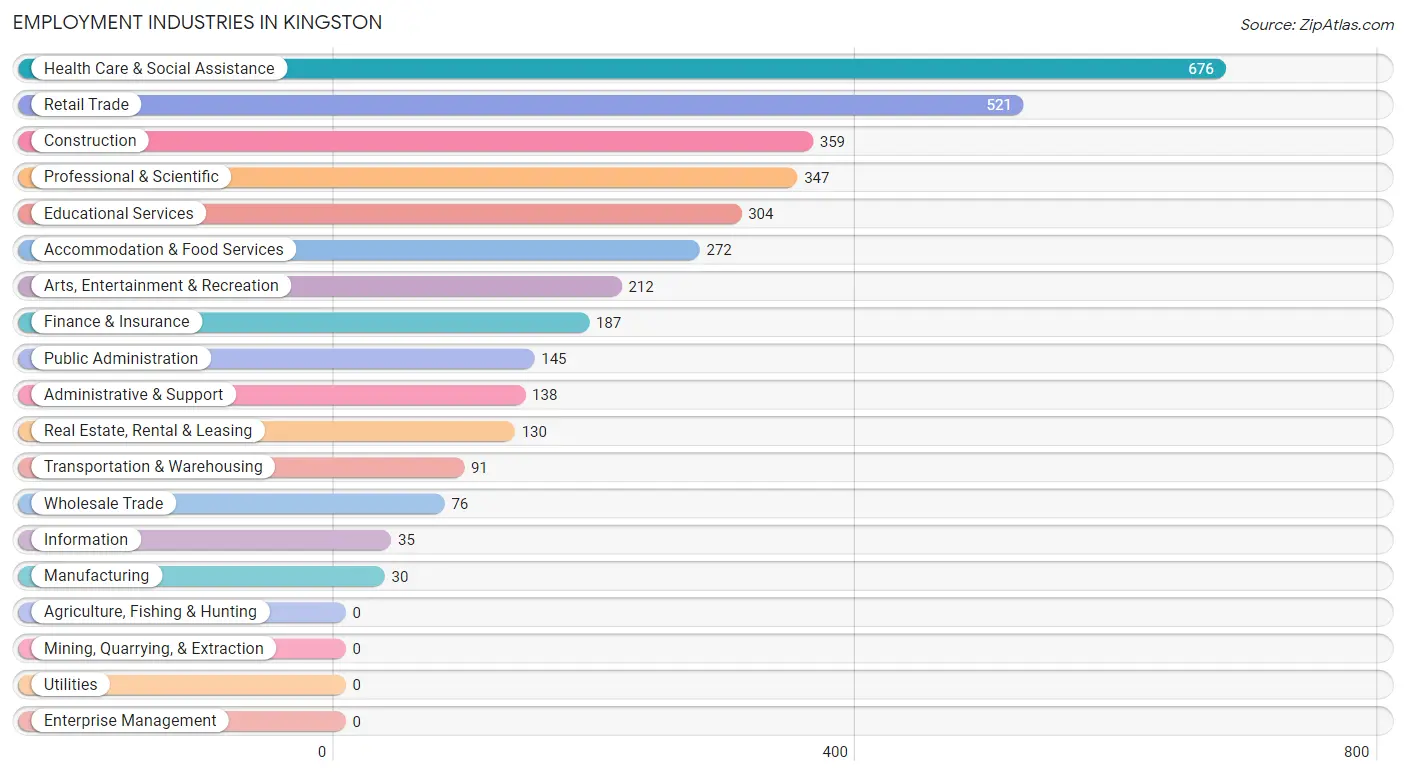
Employment Industries in Kingston
The major employment industries in Kingston include Health Care & Social Assistance (676 | 18.4%), Retail Trade (521 | 14.2%), Construction (359 | 9.8%), Professional & Scientific (347 | 9.5%), and Educational Services (304 | 8.3%).
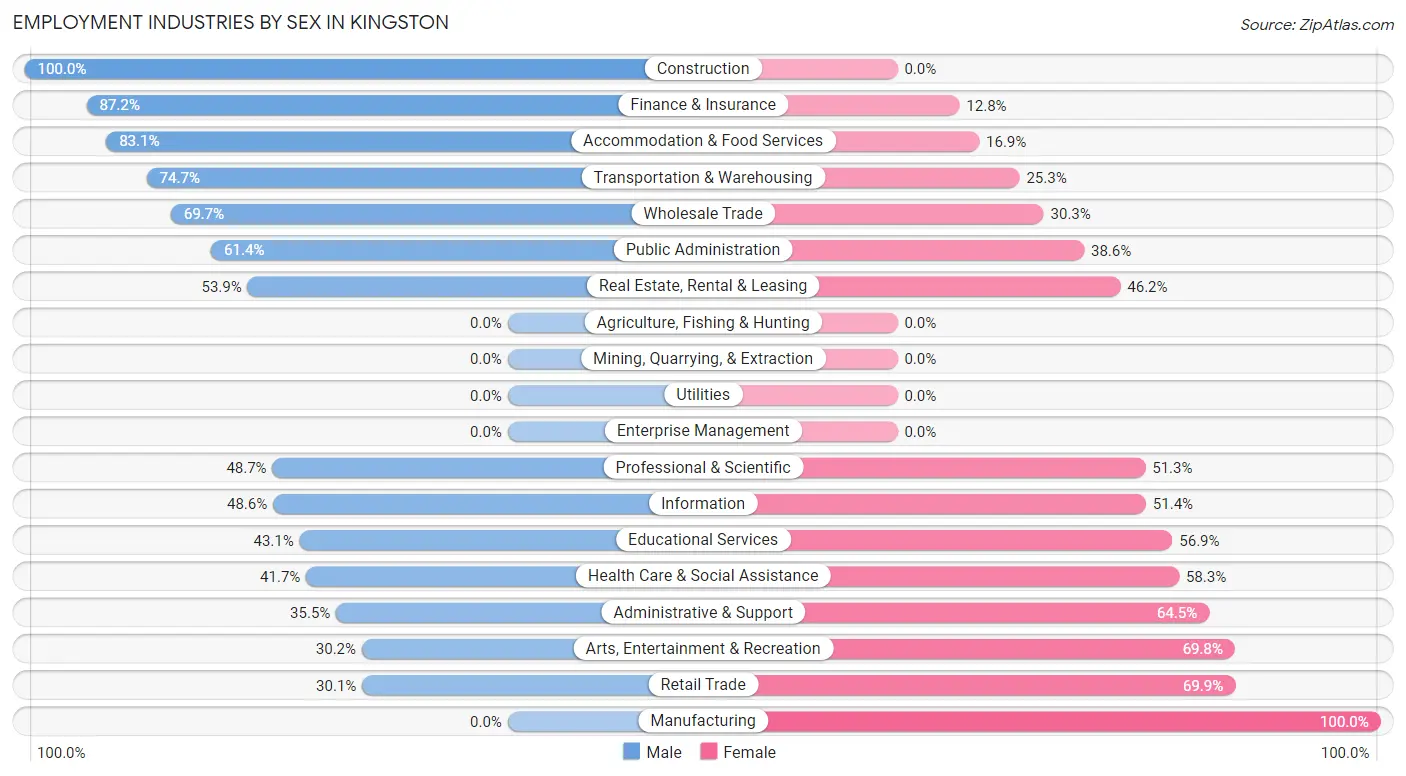
Employment Industries by Sex in Kingston
The Kingston industries that see more men than women are Construction (100.0%), Finance & Insurance (87.2%), and Accommodation & Food Services (83.1%), whereas the industries that tend to have a higher number of women are Manufacturing (100.0%), Retail Trade (69.9%), and Arts, Entertainment & Recreation (69.8%).
| Industry | Male | Female |
| Agriculture, Fishing & Hunting | 0 (0.0%) | 0 (0.0%) |
| Mining, Quarrying, & Extraction | 0 (0.0%) | 0 (0.0%) |
| Construction | 359 (100.0%) | 0 (0.0%) |
| Manufacturing | 0 (0.0%) | 30 (100.0%) |
| Wholesale Trade | 53 (69.7%) | 23 (30.3%) |
| Retail Trade | 157 (30.1%) | 364 (69.9%) |
| Transportation & Warehousing | 68 (74.7%) | 23 (25.3%) |
| Utilities | 0 (0.0%) | 0 (0.0%) |
| Information | 17 (48.6%) | 18 (51.4%) |
| Finance & Insurance | 163 (87.2%) | 24 (12.8%) |
| Real Estate, Rental & Leasing | 70 (53.8%) | 60 (46.2%) |
| Professional & Scientific | 169 (48.7%) | 178 (51.3%) |
| Enterprise Management | 0 (0.0%) | 0 (0.0%) |
| Administrative & Support | 49 (35.5%) | 89 (64.5%) |
| Educational Services | 131 (43.1%) | 173 (56.9%) |
| Health Care & Social Assistance | 282 (41.7%) | 394 (58.3%) |
| Arts, Entertainment & Recreation | 64 (30.2%) | 148 (69.8%) |
| Accommodation & Food Services | 226 (83.1%) | 46 (16.9%) |
| Public Administration | 89 (61.4%) | 56 (38.6%) |
| Total | 1,954 (53.3%) | 1,713 (46.7%) |
Education in Kingston
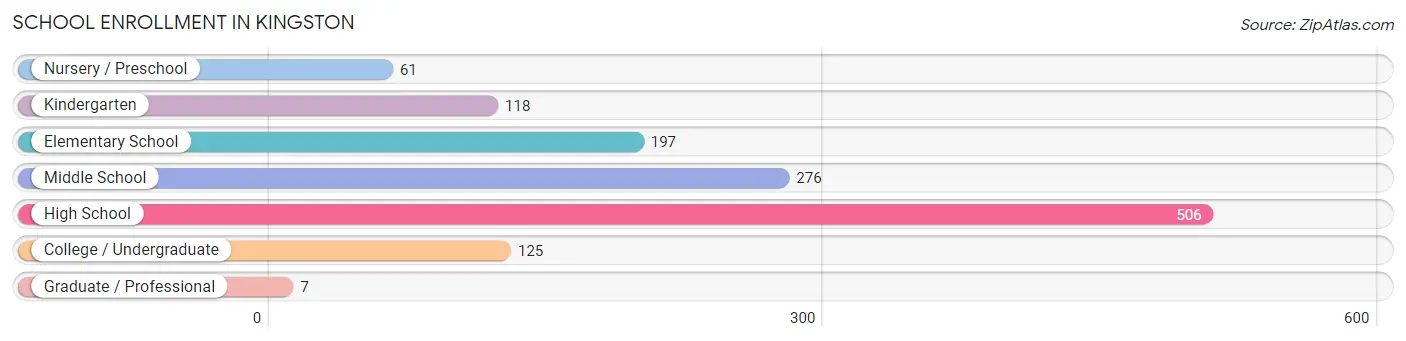
School Enrollment in Kingston
The most common levels of schooling among the 1,290 students in Kingston are high school (506 | 39.2%), middle school (276 | 21.4%), and elementary school (197 | 15.3%).
| School Level | # Students | % Students |
| Nursery / Preschool | 61 | 4.7% |
| Kindergarten | 118 | 9.1% |
| Elementary School | 197 | 15.3% |
| Middle School | 276 | 21.4% |
| High School | 506 | 39.2% |
| College / Undergraduate | 125 | 9.7% |
| Graduate / Professional | 7 | 0.5% |
| Total | 1,290 | 100.0% |
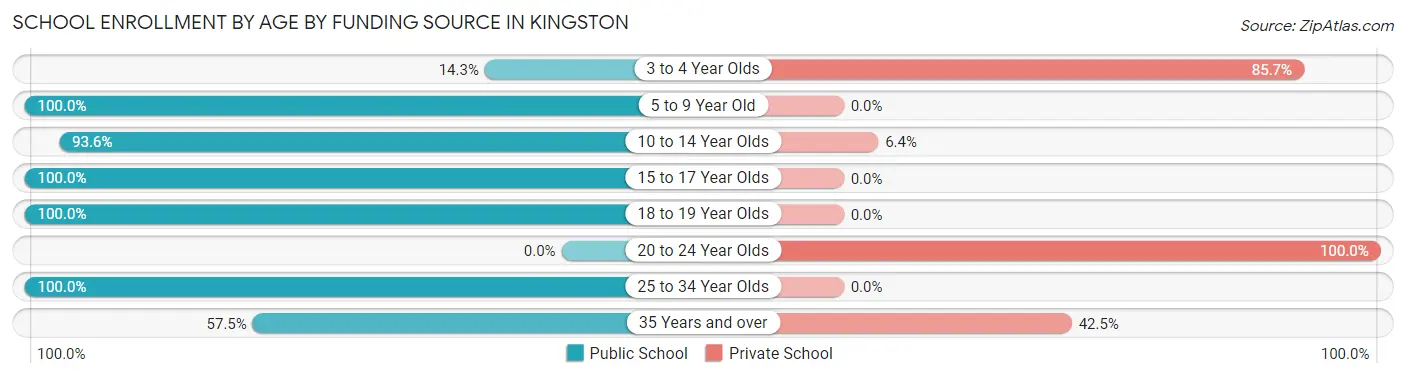
School Enrollment by Age by Funding Source in Kingston
Out of a total of 1,290 students who are enrolled in schools in Kingston, 107 (8.3%) attend a private institution, while the remaining 1,183 (91.7%) are enrolled in public schools. The age group of 20 to 24 year olds has the highest likelihood of being enrolled in private schools, with 20 (100.0% in the age bracket) enrolled. Conversely, the age group of 5 to 9 year old has the lowest likelihood of being enrolled in a private school, with 334 (100.0% in the age bracket) attending a public institution.
| Age Bracket | Public School | Private School |
| 3 to 4 Year Olds | 6 (14.3%) | 36 (85.7%) |
| 5 to 9 Year Old | 334 (100.0%) | 0 (0.0%) |
| 10 to 14 Year Olds | 291 (93.6%) | 20 (6.4%) |
| 15 to 17 Year Olds | 334 (100.0%) | 0 (0.0%) |
| 18 to 19 Year Olds | 152 (100.0%) | 0 (0.0%) |
| 20 to 24 Year Olds | 0 (0.0%) | 20 (100.0%) |
| 25 to 34 Year Olds | 24 (100.0%) | 0 (0.0%) |
| 35 Years and over | 42 (57.5%) | 31 (42.5%) |
| Total | 1,183 (91.7%) | 107 (8.3%) |
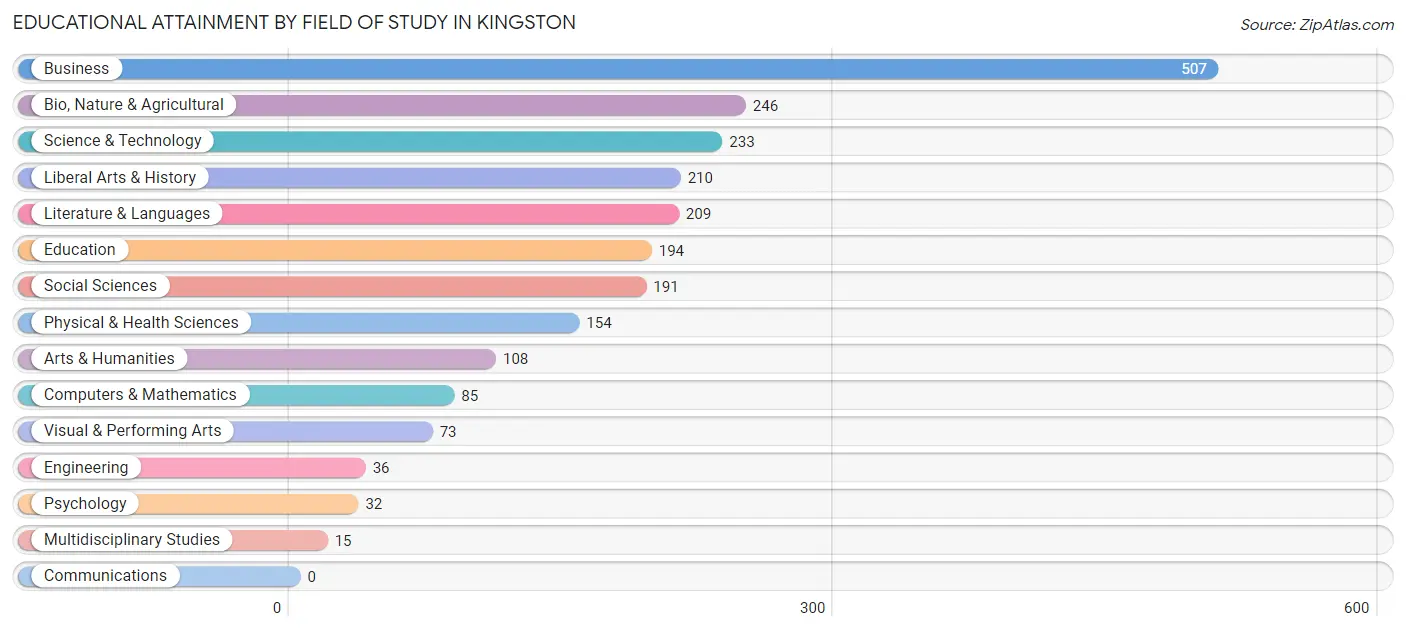
Educational Attainment by Field of Study in Kingston
Business (507 | 22.1%), bio, nature & agricultural (246 | 10.7%), science & technology (233 | 10.2%), liberal arts & history (210 | 9.2%), and literature & languages (209 | 9.1%) are the most common fields of study among 2,293 individuals in Kingston who have obtained a bachelor's degree or higher.
| Field of Study | # Graduates | % Graduates |
| Computers & Mathematics | 85 | 3.7% |
| Bio, Nature & Agricultural | 246 | 10.7% |
| Physical & Health Sciences | 154 | 6.7% |
| Psychology | 32 | 1.4% |
| Social Sciences | 191 | 8.3% |
| Engineering | 36 | 1.6% |
| Multidisciplinary Studies | 15 | 0.6% |
| Science & Technology | 233 | 10.2% |
| Business | 507 | 22.1% |
| Education | 194 | 8.5% |
| Literature & Languages | 209 | 9.1% |
| Liberal Arts & History | 210 | 9.2% |
| Visual & Performing Arts | 73 | 3.2% |
| Communications | 0 | 0.0% |
| Arts & Humanities | 108 | 4.7% |
| Total | 2,293 | 100.0% |
Transportation & Commute in Kingston
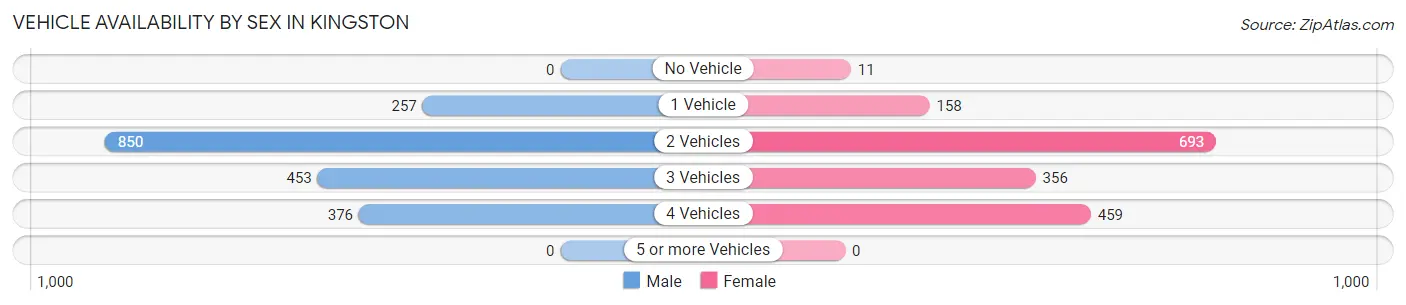
Vehicle Availability by Sex in Kingston
The most prevalent vehicle ownership categories in Kingston are males with 2 vehicles (850, accounting for 43.9%) and females with 2 vehicles (693, making up 50.7%).
| Vehicles Available | Male | Female |
| No Vehicle | 0 (0.0%) | 11 (0.7%) |
| 1 Vehicle | 257 (13.3%) | 158 (9.4%) |
| 2 Vehicles | 850 (43.9%) | 693 (41.3%) |
| 3 Vehicles | 453 (23.4%) | 356 (21.2%) |
| 4 Vehicles | 376 (19.4%) | 459 (27.4%) |
| 5 or more Vehicles | 0 (0.0%) | 0 (0.0%) |
| Total | 1,936 (100.0%) | 1,677 (100.0%) |
Commute Time in Kingston
The most frequently occuring commute durations in Kingston are 30 to 34 minutes (621 commuters, 18.7%), 60 to 89 minutes (471 commuters, 14.2%), and 15 to 19 minutes (391 commuters, 11.8%).
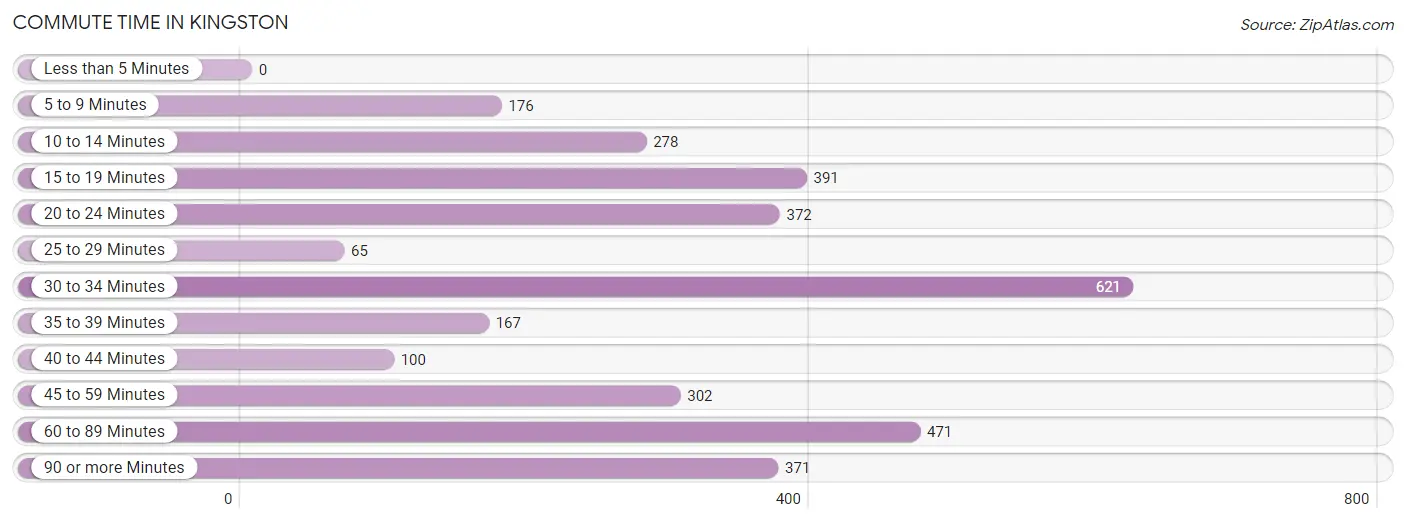
| Commute Time | # Commuters | % Commuters |
| Less than 5 Minutes | 0 | 0.0% |
| 5 to 9 Minutes | 176 | 5.3% |
| 10 to 14 Minutes | 278 | 8.4% |
| 15 to 19 Minutes | 391 | 11.8% |
| 20 to 24 Minutes | 372 | 11.2% |
| 25 to 29 Minutes | 65 | 2.0% |
| 30 to 34 Minutes | 621 | 18.7% |
| 35 to 39 Minutes | 167 | 5.0% |
| 40 to 44 Minutes | 100 | 3.0% |
| 45 to 59 Minutes | 302 | 9.1% |
| 60 to 89 Minutes | 471 | 14.2% |
| 90 or more Minutes | 371 | 11.2% |
Commute Time by Sex in Kingston
The most common commute times in Kingston are 90 or more minutes (301 commuters, 16.8%) for males and 30 to 34 minutes (442 commuters, 29.1%) for females.
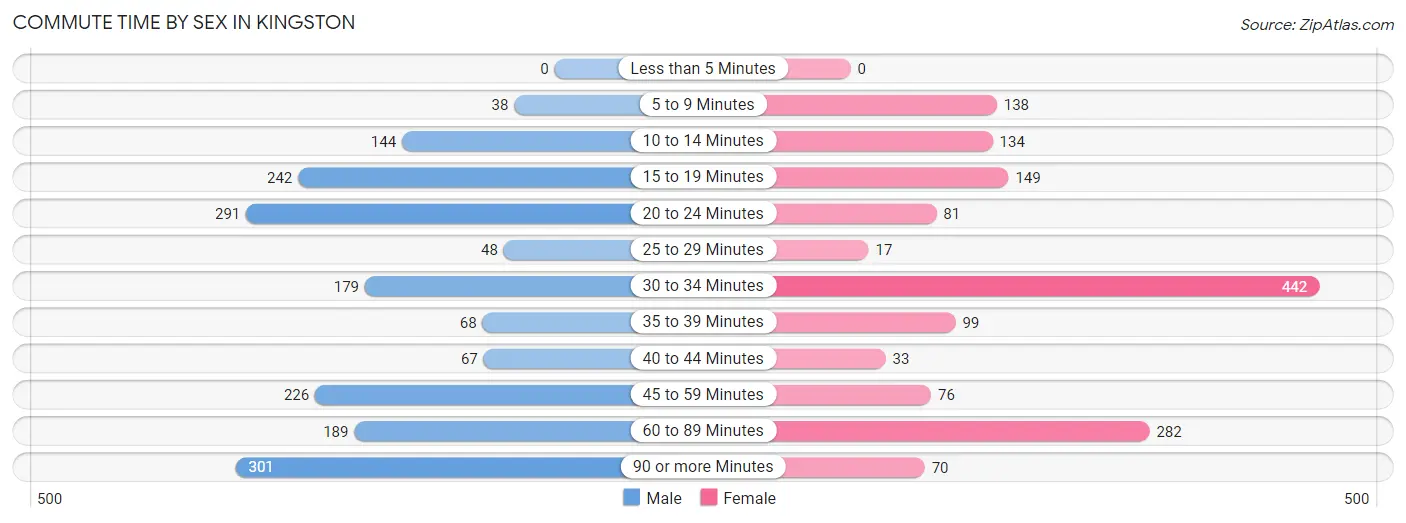
| Commute Time | Male | Female |
| Less than 5 Minutes | 0 (0.0%) | 0 (0.0%) |
| 5 to 9 Minutes | 38 (2.1%) | 138 (9.1%) |
| 10 to 14 Minutes | 144 (8.0%) | 134 (8.8%) |
| 15 to 19 Minutes | 242 (13.5%) | 149 (9.8%) |
| 20 to 24 Minutes | 291 (16.2%) | 81 (5.3%) |
| 25 to 29 Minutes | 48 (2.7%) | 17 (1.1%) |
| 30 to 34 Minutes | 179 (10.0%) | 442 (29.1%) |
| 35 to 39 Minutes | 68 (3.8%) | 99 (6.5%) |
| 40 to 44 Minutes | 67 (3.7%) | 33 (2.2%) |
| 45 to 59 Minutes | 226 (12.6%) | 76 (5.0%) |
| 60 to 89 Minutes | 189 (10.5%) | 282 (18.5%) |
| 90 or more Minutes | 301 (16.8%) | 70 (4.6%) |
Time of Departure to Work by Sex in Kingston
The most frequent times of departure to work in Kingston are 7:00 AM to 7:29 AM (316, 17.6%) for males and 9:00 AM to 9:59 AM (314, 20.6%) for females.
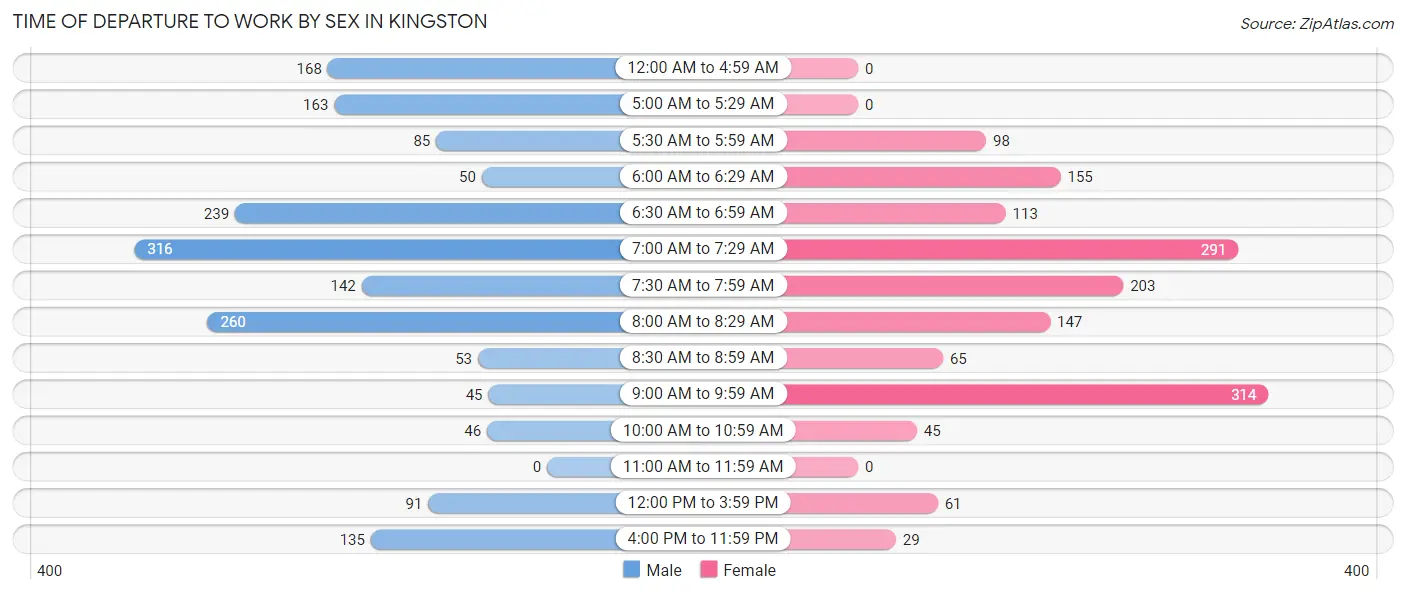
| Time of Departure | Male | Female |
| 12:00 AM to 4:59 AM | 168 (9.4%) | 0 (0.0%) |
| 5:00 AM to 5:29 AM | 163 (9.1%) | 0 (0.0%) |
| 5:30 AM to 5:59 AM | 85 (4.7%) | 98 (6.4%) |
| 6:00 AM to 6:29 AM | 50 (2.8%) | 155 (10.2%) |
| 6:30 AM to 6:59 AM | 239 (13.3%) | 113 (7.4%) |
| 7:00 AM to 7:29 AM | 316 (17.6%) | 291 (19.1%) |
| 7:30 AM to 7:59 AM | 142 (7.9%) | 203 (13.4%) |
| 8:00 AM to 8:29 AM | 260 (14.5%) | 147 (9.7%) |
| 8:30 AM to 8:59 AM | 53 (3.0%) | 65 (4.3%) |
| 9:00 AM to 9:59 AM | 45 (2.5%) | 314 (20.6%) |
| 10:00 AM to 10:59 AM | 46 (2.6%) | 45 (3.0%) |
| 11:00 AM to 11:59 AM | 0 (0.0%) | 0 (0.0%) |
| 12:00 PM to 3:59 PM | 91 (5.1%) | 61 (4.0%) |
| 4:00 PM to 11:59 PM | 135 (7.5%) | 29 (1.9%) |
| Total | 1,793 (100.0%) | 1,521 (100.0%) |
Housing Occupancy in Kingston
Occupancy by Ownership in Kingston
Of the total 2,504 dwellings in Kingston, owner-occupied units account for 2,141 (85.5%), while renter-occupied units make up 363 (14.5%).
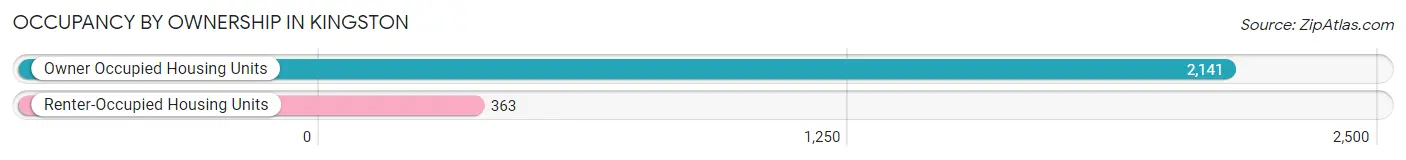
| Occupancy | # Housing Units | % Housing Units |
| Owner Occupied Housing Units | 2,141 | 85.5% |
| Renter-Occupied Housing Units | 363 | 14.5% |
| Total Occupied Housing Units | 2,504 | 100.0% |
Occupancy by Household Size in Kingston
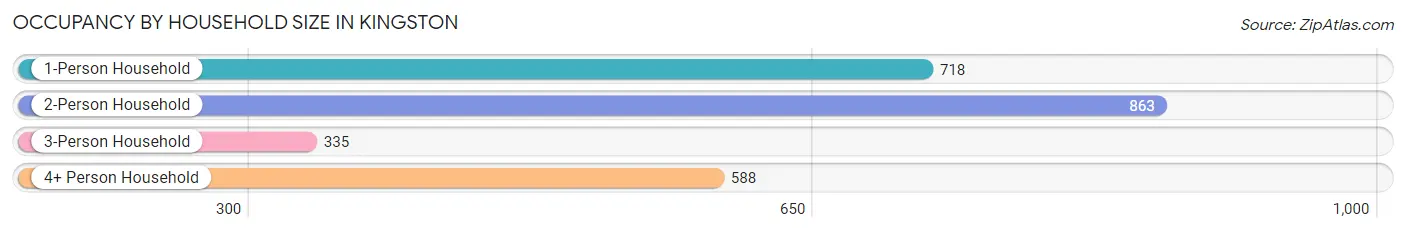
| Household Size | # Housing Units | % Housing Units |
| 1-Person Household | 718 | 28.7% |
| 2-Person Household | 863 | 34.5% |
| 3-Person Household | 335 | 13.4% |
| 4+ Person Household | 588 | 23.5% |
| Total Housing Units | 2,504 | 100.0% |
Occupancy by Ownership by Household Size in Kingston
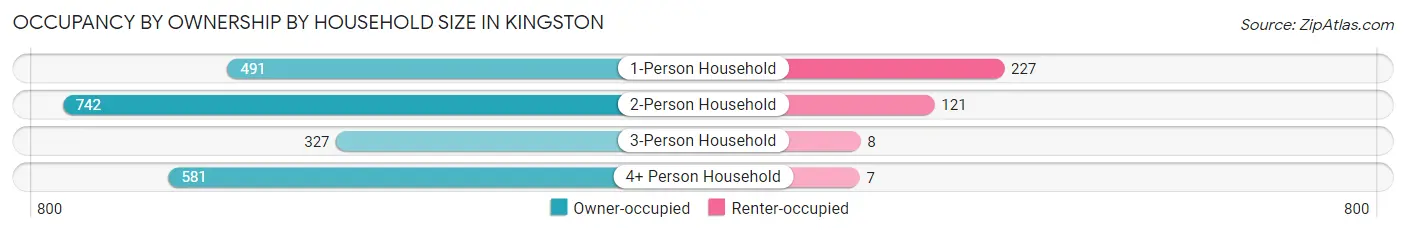
| Household Size | Owner-occupied | Renter-occupied |
| 1-Person Household | 491 (68.4%) | 227 (31.6%) |
| 2-Person Household | 742 (86.0%) | 121 (14.0%) |
| 3-Person Household | 327 (97.6%) | 8 (2.4%) |
| 4+ Person Household | 581 (98.8%) | 7 (1.2%) |
| Total Housing Units | 2,141 (85.5%) | 363 (14.5%) |
Occupancy by Educational Attainment in Kingston
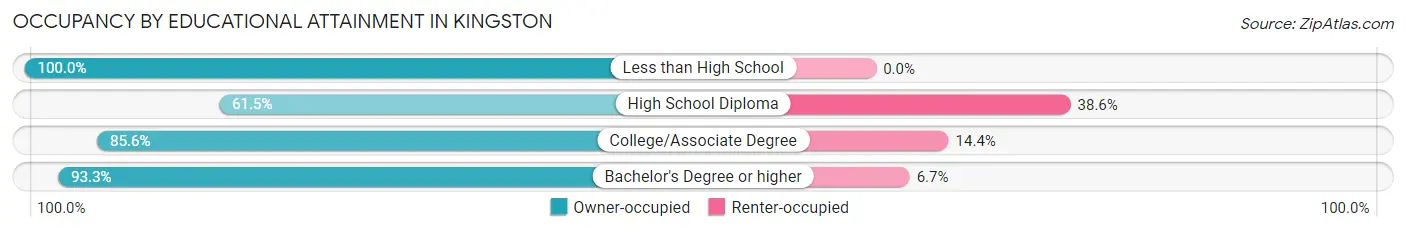
| Household Size | Owner-occupied | Renter-occupied |
| Less than High School | 16 (100.0%) | 0 (0.0%) |
| High School Diploma | 279 (61.5%) | 175 (38.6%) |
| College/Associate Degree | 584 (85.6%) | 98 (14.4%) |
| Bachelor's Degree or higher | 1,262 (93.3%) | 90 (6.7%) |
Occupancy by Age of Householder in Kingston
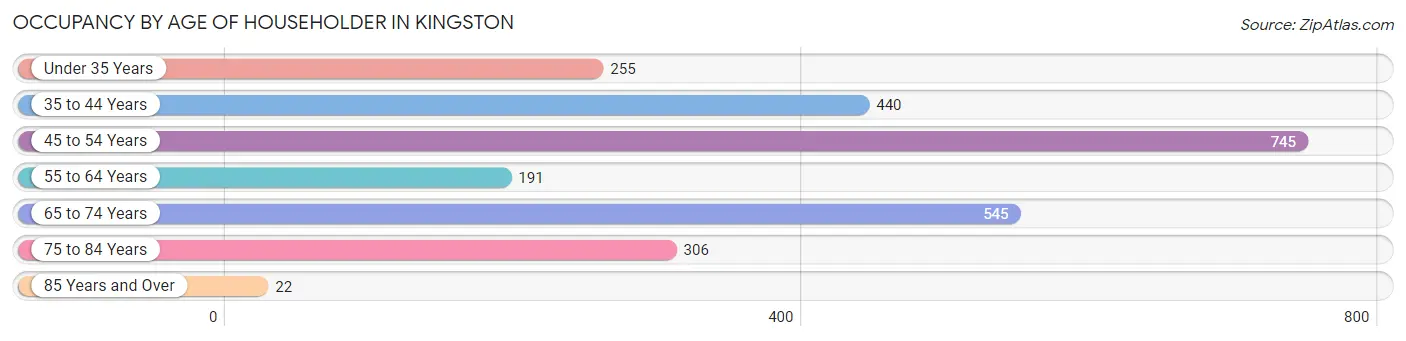
| Age Bracket | # Households | % Households |
| Under 35 Years | 255 | 10.2% |
| 35 to 44 Years | 440 | 17.6% |
| 45 to 54 Years | 745 | 29.7% |
| 55 to 64 Years | 191 | 7.6% |
| 65 to 74 Years | 545 | 21.8% |
| 75 to 84 Years | 306 | 12.2% |
| 85 Years and Over | 22 | 0.9% |
| Total | 2,504 | 100.0% |
Housing Finances in Kingston
Median Income by Occupancy in Kingston
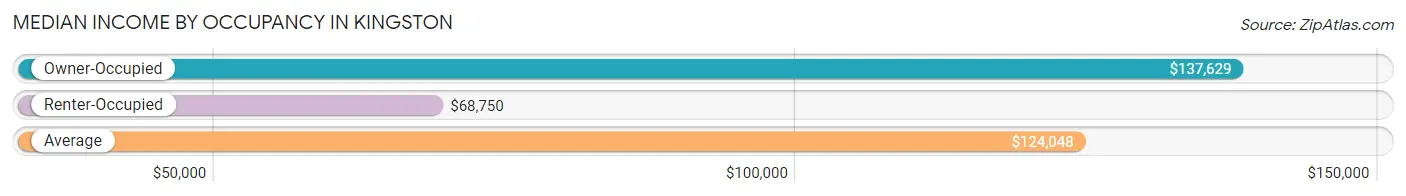
| Occupancy Type | # Households | Median Income |
| Owner-Occupied | 2,141 (85.5%) | $137,629 |
| Renter-Occupied | 363 (14.5%) | $68,750 |
| Average | 2,504 (100.0%) | $124,048 |
Occupancy by Householder Income Bracket in Kingston
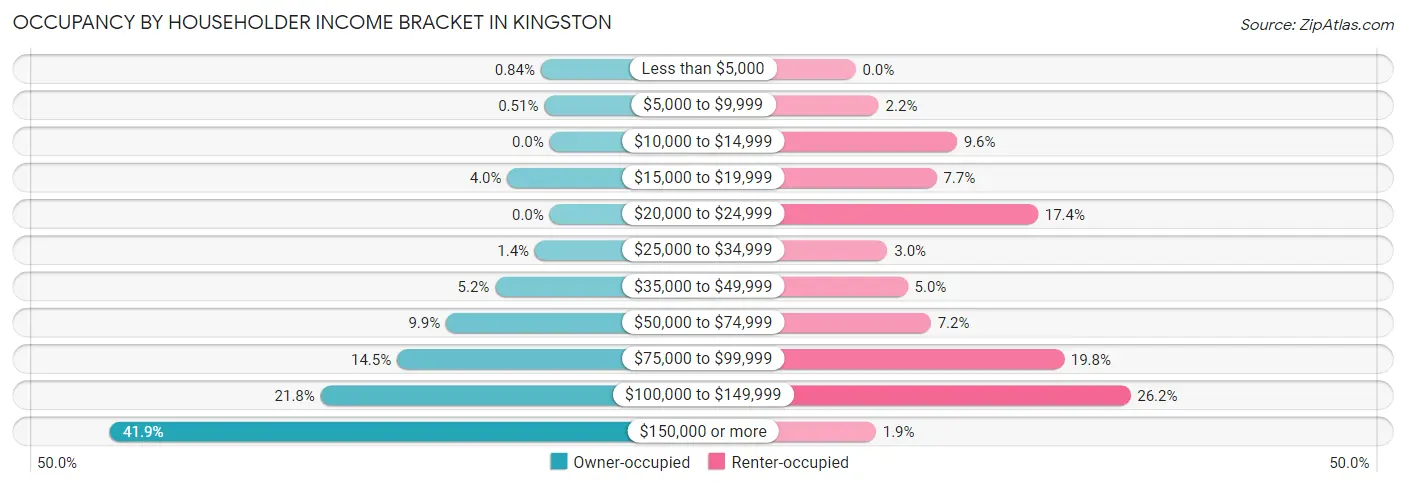
| Income Bracket | Owner-occupied | Renter-occupied |
| Less than $5,000 | 18 (0.8%) | 0 (0.0%) |
| $5,000 to $9,999 | 11 (0.5%) | 8 (2.2%) |
| $10,000 to $14,999 | 0 (0.0%) | 35 (9.6%) |
| $15,000 to $19,999 | 86 (4.0%) | 28 (7.7%) |
| $20,000 to $24,999 | 0 (0.0%) | 63 (17.4%) |
| $25,000 to $34,999 | 30 (1.4%) | 11 (3.0%) |
| $35,000 to $49,999 | 111 (5.2%) | 18 (5.0%) |
| $50,000 to $74,999 | 211 (9.9%) | 26 (7.2%) |
| $75,000 to $99,999 | 311 (14.5%) | 72 (19.8%) |
| $100,000 to $149,999 | 467 (21.8%) | 95 (26.2%) |
| $150,000 or more | 896 (41.8%) | 7 (1.9%) |
| Total | 2,141 (100.0%) | 363 (100.0%) |
Monthly Housing Cost Tiers in Kingston
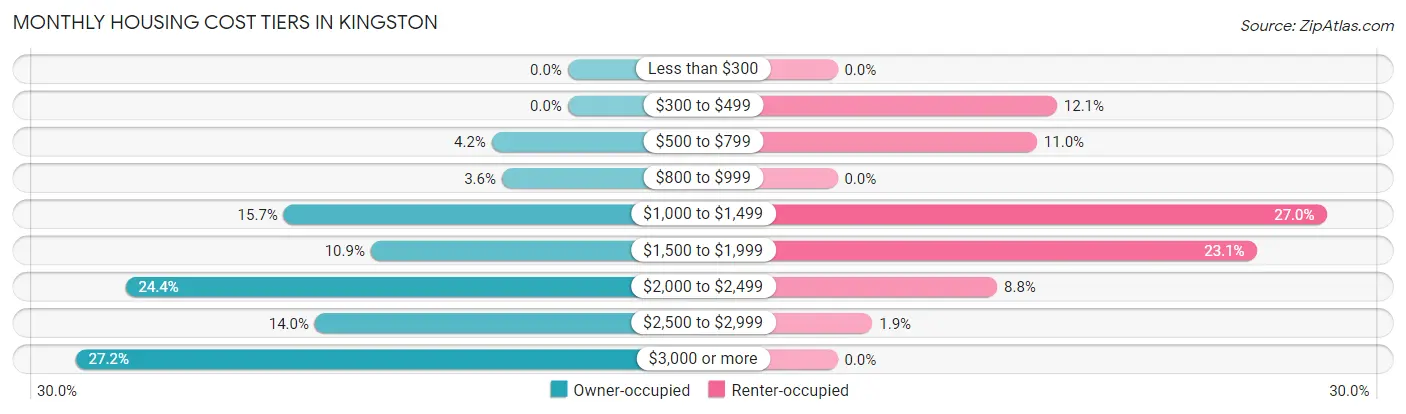
| Monthly Cost | Owner-occupied | Renter-occupied |
| Less than $300 | 0 (0.0%) | 0 (0.0%) |
| $300 to $499 | 0 (0.0%) | 44 (12.1%) |
| $500 to $799 | 90 (4.2%) | 40 (11.0%) |
| $800 to $999 | 78 (3.6%) | 0 (0.0%) |
| $1,000 to $1,499 | 336 (15.7%) | 98 (27.0%) |
| $1,500 to $1,999 | 233 (10.9%) | 84 (23.1%) |
| $2,000 to $2,499 | 523 (24.4%) | 32 (8.8%) |
| $2,500 to $2,999 | 299 (14.0%) | 7 (1.9%) |
| $3,000 or more | 582 (27.2%) | 0 (0.0%) |
| Total | 2,141 (100.0%) | 363 (100.0%) |
Physical Housing Characteristics in Kingston
Housing Structures in Kingston
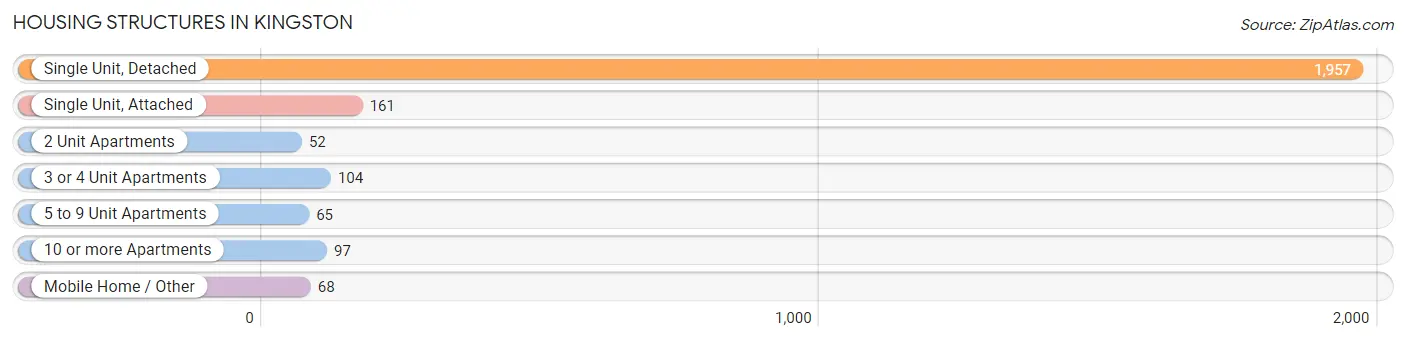
| Structure Type | # Housing Units | % Housing Units |
| Single Unit, Detached | 1,957 | 78.1% |
| Single Unit, Attached | 161 | 6.4% |
| 2 Unit Apartments | 52 | 2.1% |
| 3 or 4 Unit Apartments | 104 | 4.2% |
| 5 to 9 Unit Apartments | 65 | 2.6% |
| 10 or more Apartments | 97 | 3.9% |
| Mobile Home / Other | 68 | 2.7% |
| Total | 2,504 | 100.0% |
Housing Structures by Occupancy in Kingston
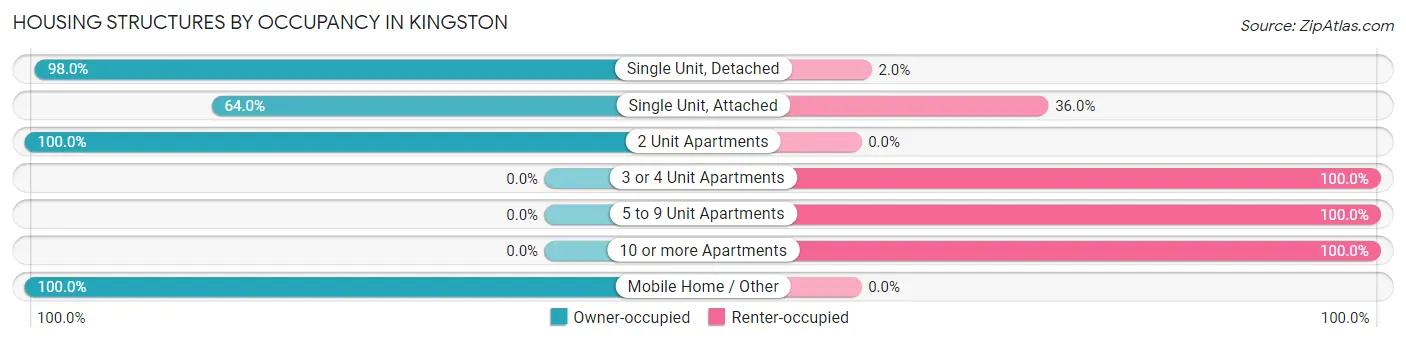
| Structure Type | Owner-occupied | Renter-occupied |
| Single Unit, Detached | 1,918 (98.0%) | 39 (2.0%) |
| Single Unit, Attached | 103 (64.0%) | 58 (36.0%) |
| 2 Unit Apartments | 52 (100.0%) | 0 (0.0%) |
| 3 or 4 Unit Apartments | 0 (0.0%) | 104 (100.0%) |
| 5 to 9 Unit Apartments | 0 (0.0%) | 65 (100.0%) |
| 10 or more Apartments | 0 (0.0%) | 97 (100.0%) |
| Mobile Home / Other | 68 (100.0%) | 0 (0.0%) |
| Total | 2,141 (85.5%) | 363 (14.5%) |
Housing Structures by Number of Rooms in Kingston
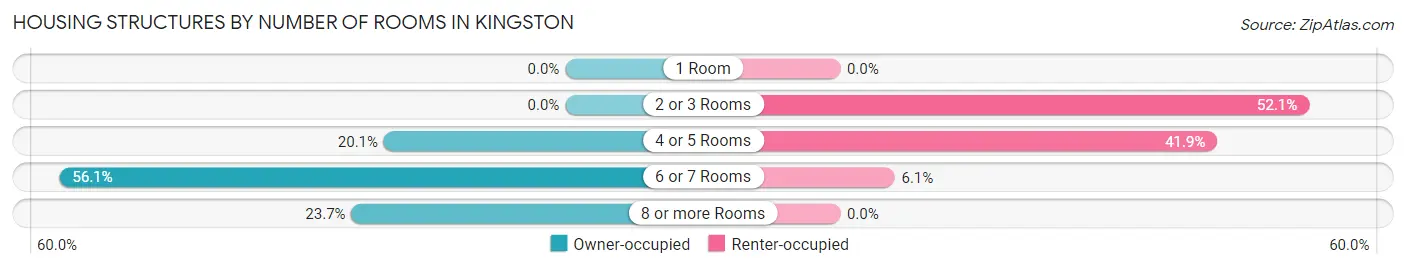
| Number of Rooms | Owner-occupied | Renter-occupied |
| 1 Room | 0 (0.0%) | 0 (0.0%) |
| 2 or 3 Rooms | 0 (0.0%) | 189 (52.1%) |
| 4 or 5 Rooms | 431 (20.1%) | 152 (41.9%) |
| 6 or 7 Rooms | 1,202 (56.1%) | 22 (6.1%) |
| 8 or more Rooms | 508 (23.7%) | 0 (0.0%) |
| Total | 2,141 (100.0%) | 363 (100.0%) |
Housing Structure by Heating Type in Kingston
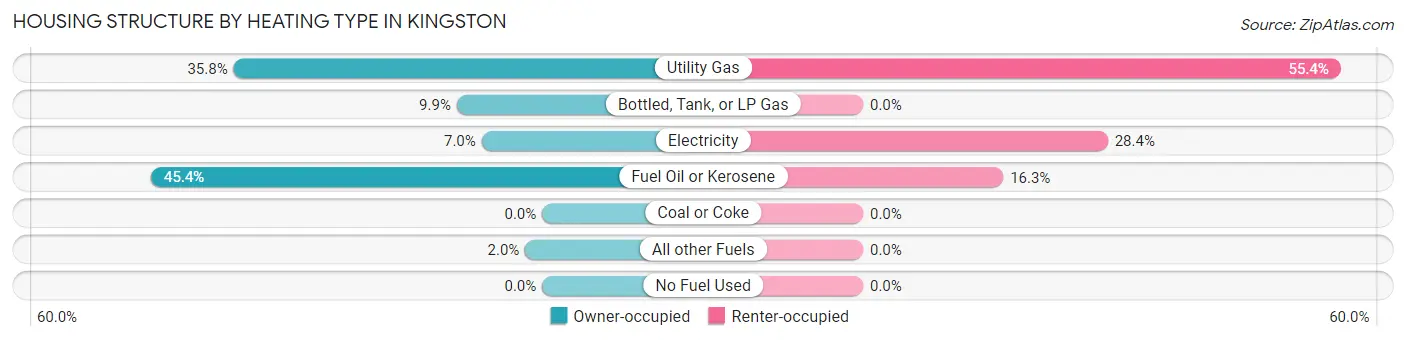
| Heating Type | Owner-occupied | Renter-occupied |
| Utility Gas | 766 (35.8%) | 201 (55.4%) |
| Bottled, Tank, or LP Gas | 212 (9.9%) | 0 (0.0%) |
| Electricity | 150 (7.0%) | 103 (28.4%) |
| Fuel Oil or Kerosene | 971 (45.4%) | 59 (16.3%) |
| Coal or Coke | 0 (0.0%) | 0 (0.0%) |
| All other Fuels | 42 (2.0%) | 0 (0.0%) |
| No Fuel Used | 0 (0.0%) | 0 (0.0%) |
| Total | 2,141 (100.0%) | 363 (100.0%) |
Household Vehicle Usage in Kingston
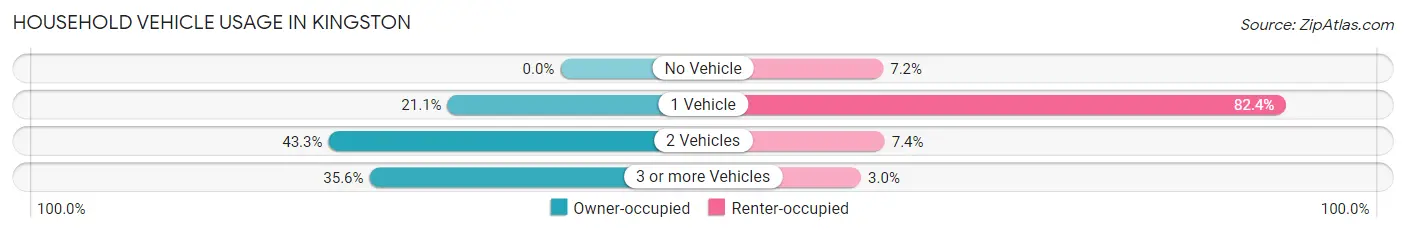
| Vehicles per Household | Owner-occupied | Renter-occupied |
| No Vehicle | 0 (0.0%) | 26 (7.2%) |
| 1 Vehicle | 451 (21.1%) | 299 (82.4%) |
| 2 Vehicles | 927 (43.3%) | 27 (7.4%) |
| 3 or more Vehicles | 763 (35.6%) | 11 (3.0%) |
| Total | 2,141 (100.0%) | 363 (100.0%) |
Real Estate & Mortgages in Kingston
Real Estate and Mortgage Overview in Kingston
| Characteristic | Without Mortgage | With Mortgage |
| Housing Units | 305 | 1,836 |
| Median Property Value | $387,200 | $476,000 |
| Median Household Income | $82,404 | $864 |
| Monthly Housing Costs | $1,142 | $582 |
| Real Estate Taxes | $6,132 | $19 |
Property Value by Mortgage Status in Kingston
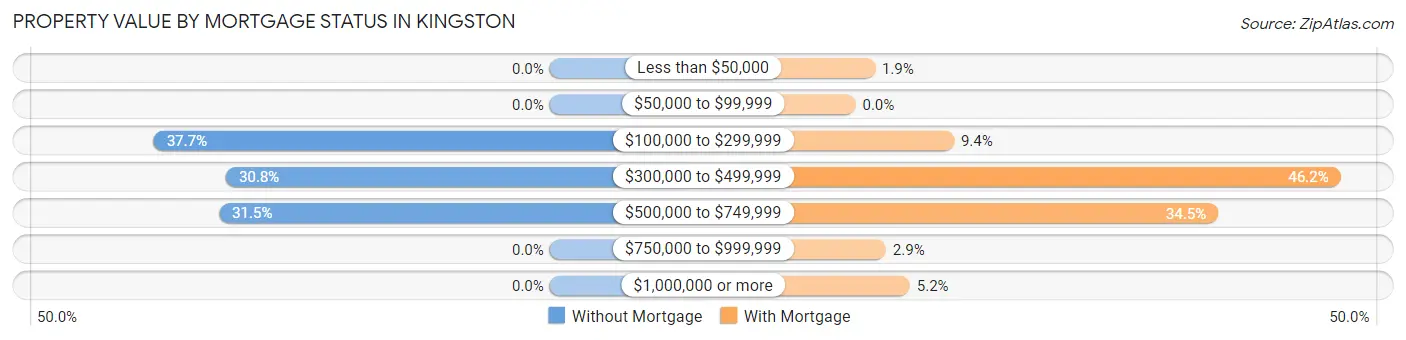
| Property Value | Without Mortgage | With Mortgage |
| Less than $50,000 | 0 (0.0%) | 34 (1.8%) |
| $50,000 to $99,999 | 0 (0.0%) | 0 (0.0%) |
| $100,000 to $299,999 | 115 (37.7%) | 172 (9.4%) |
| $300,000 to $499,999 | 94 (30.8%) | 848 (46.2%) |
| $500,000 to $749,999 | 96 (31.5%) | 634 (34.5%) |
| $750,000 to $999,999 | 0 (0.0%) | 53 (2.9%) |
| $1,000,000 or more | 0 (0.0%) | 95 (5.2%) |
| Total | 305 (100.0%) | 1,836 (100.0%) |
Household Income by Mortgage Status in Kingston
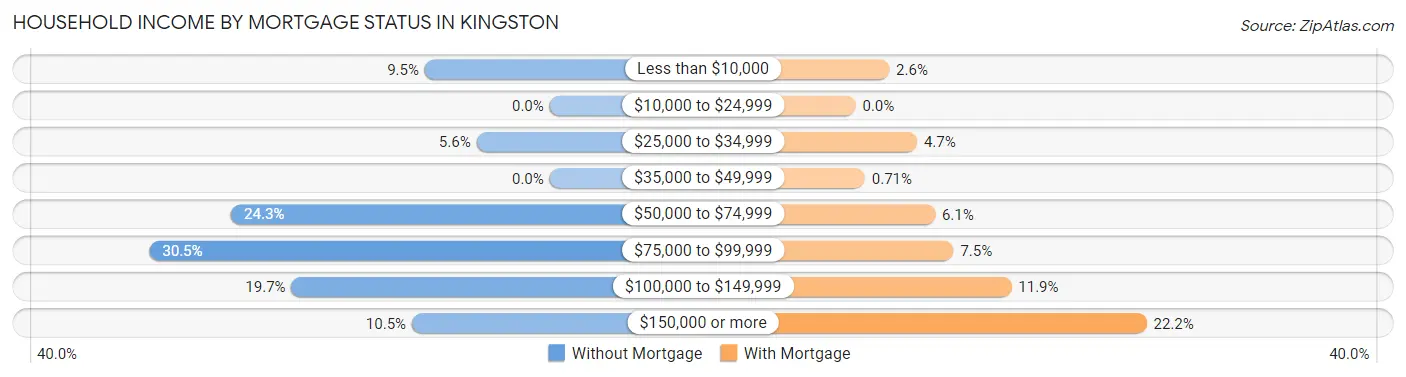
| Household Income | Without Mortgage | With Mortgage |
| Less than $10,000 | 29 (9.5%) | 47 (2.6%) |
| $10,000 to $24,999 | 0 (0.0%) | 0 (0.0%) |
| $25,000 to $34,999 | 17 (5.6%) | 86 (4.7%) |
| $35,000 to $49,999 | 0 (0.0%) | 13 (0.7%) |
| $50,000 to $74,999 | 74 (24.3%) | 111 (6.0%) |
| $75,000 to $99,999 | 93 (30.5%) | 137 (7.5%) |
| $100,000 to $149,999 | 60 (19.7%) | 218 (11.9%) |
| $150,000 or more | 32 (10.5%) | 407 (22.2%) |
| Total | 305 (100.0%) | 1,836 (100.0%) |
Property Value to Household Income Ratio in Kingston
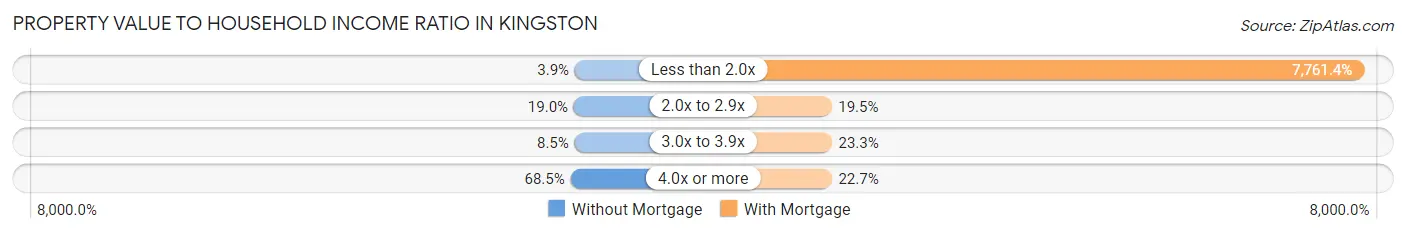
| Value-to-Income Ratio | Without Mortgage | With Mortgage |
| Less than 2.0x | 12 (3.9%) | 142,500 (7,761.4%) |
| 2.0x to 2.9x | 58 (19.0%) | 358 (19.5%) |
| 3.0x to 3.9x | 26 (8.5%) | 428 (23.3%) |
| 4.0x or more | 209 (68.5%) | 417 (22.7%) |
| Total | 305 (100.0%) | 1,836 (100.0%) |
Real Estate Taxes by Mortgage Status in Kingston
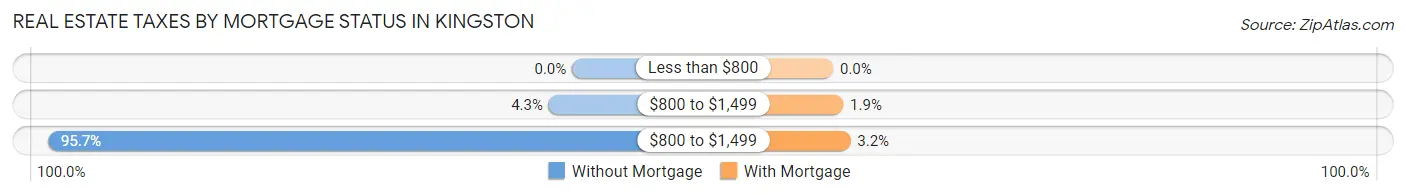
| Property Taxes | Without Mortgage | With Mortgage |
| Less than $800 | 0 (0.0%) | 0 (0.0%) |
| $800 to $1,499 | 13 (4.3%) | 34 (1.8%) |
| $800 to $1,499 | 292 (95.7%) | 58 (3.2%) |
| Total | 305 (100.0%) | 1,836 (100.0%) |
Health & Disability in Kingston
Health Insurance Coverage by Age in Kingston
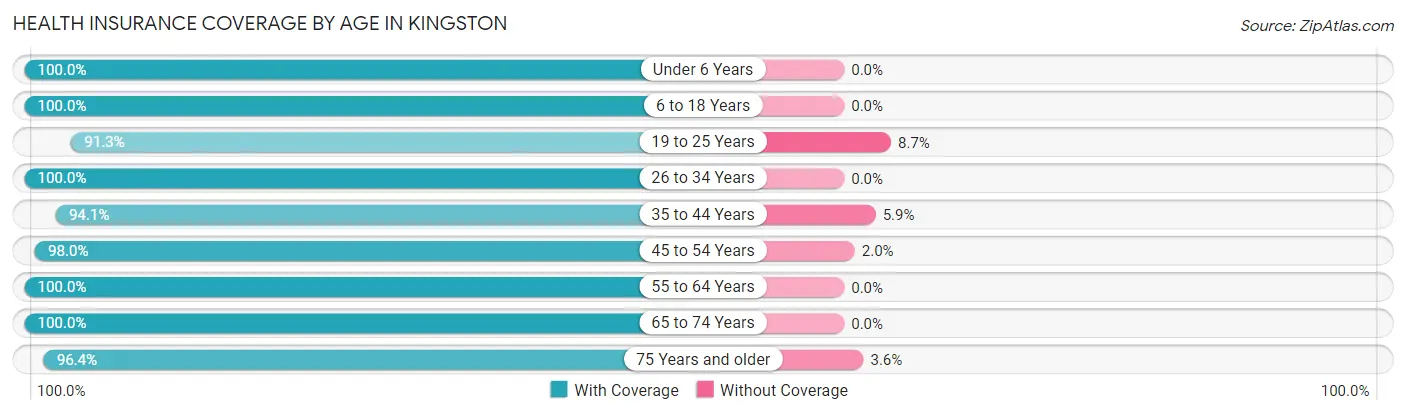
| Age Bracket | With Coverage | Without Coverage |
| Under 6 Years | 284 (100.0%) | 0 (0.0%) |
| 6 to 18 Years | 1,069 (100.0%) | 0 (0.0%) |
| 19 to 25 Years | 209 (91.3%) | 20 (8.7%) |
| 26 to 34 Years | 592 (100.0%) | 0 (0.0%) |
| 35 to 44 Years | 803 (94.1%) | 50 (5.9%) |
| 45 to 54 Years | 1,243 (98.0%) | 25 (2.0%) |
| 55 to 64 Years | 510 (100.0%) | 0 (0.0%) |
| 65 to 74 Years | 867 (100.0%) | 0 (0.0%) |
| 75 Years and older | 403 (96.4%) | 15 (3.6%) |
| Total | 5,980 (98.2%) | 110 (1.8%) |
Health Insurance Coverage by Citizenship Status in Kingston
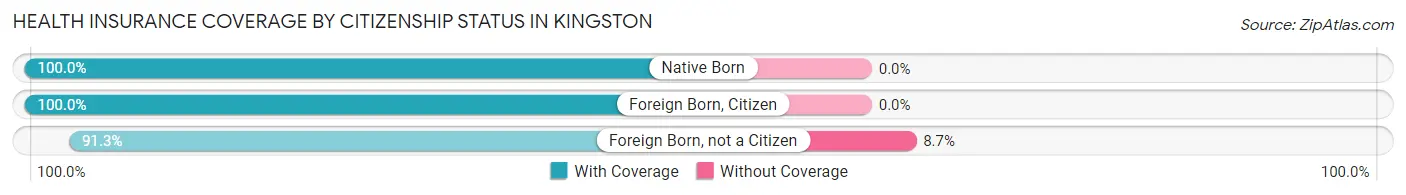
| Citizenship Status | With Coverage | Without Coverage |
| Native Born | 284 (100.0%) | 0 (0.0%) |
| Foreign Born, Citizen | 1,069 (100.0%) | 0 (0.0%) |
| Foreign Born, not a Citizen | 209 (91.3%) | 20 (8.7%) |
Health Insurance Coverage by Household Income in Kingston
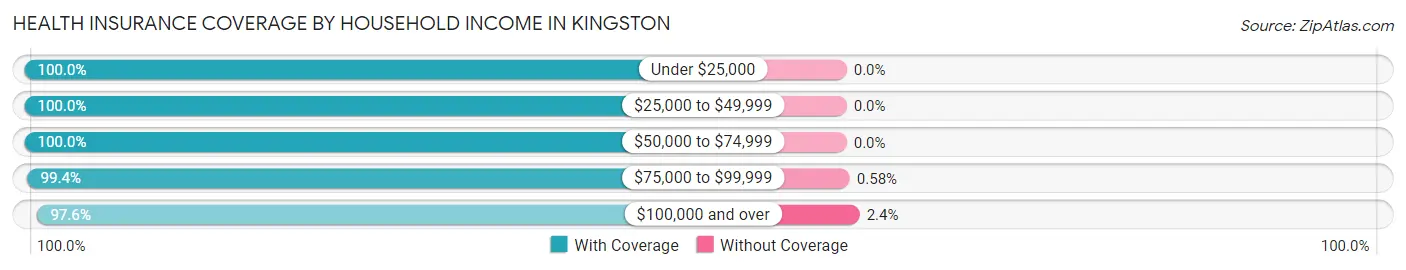
| Household Income | With Coverage | Without Coverage |
| Under $25,000 | 274 (100.0%) | 0 (0.0%) |
| $25,000 to $49,999 | 272 (100.0%) | 0 (0.0%) |
| $50,000 to $74,999 | 319 (100.0%) | 0 (0.0%) |
| $75,000 to $99,999 | 864 (99.4%) | 5 (0.6%) |
| $100,000 and over | 4,236 (97.6%) | 105 (2.4%) |
Public vs Private Health Insurance Coverage by Age in Kingston
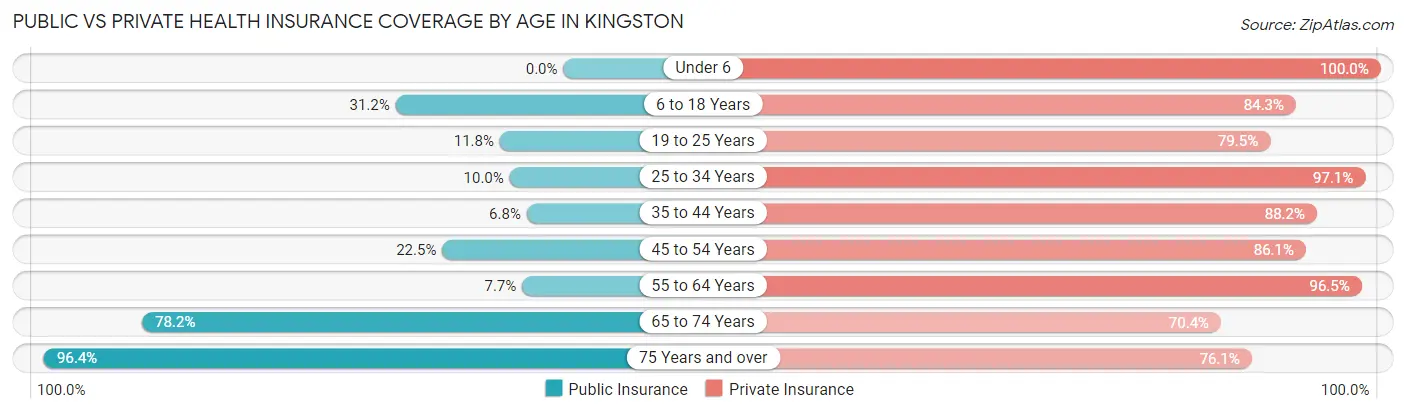
| Age Bracket | Public Insurance | Private Insurance |
| Under 6 | 0 (0.0%) | 284 (100.0%) |
| 6 to 18 Years | 333 (31.1%) | 901 (84.3%) |
| 19 to 25 Years | 27 (11.8%) | 182 (79.5%) |
| 25 to 34 Years | 59 (10.0%) | 575 (97.1%) |
| 35 to 44 Years | 58 (6.8%) | 752 (88.2%) |
| 45 to 54 Years | 285 (22.5%) | 1,092 (86.1%) |
| 55 to 64 Years | 39 (7.6%) | 492 (96.5%) |
| 65 to 74 Years | 678 (78.2%) | 610 (70.4%) |
| 75 Years and over | 403 (96.4%) | 318 (76.1%) |
| Total | 1,882 (30.9%) | 5,206 (85.5%) |
Disability Status by Sex by Age in Kingston
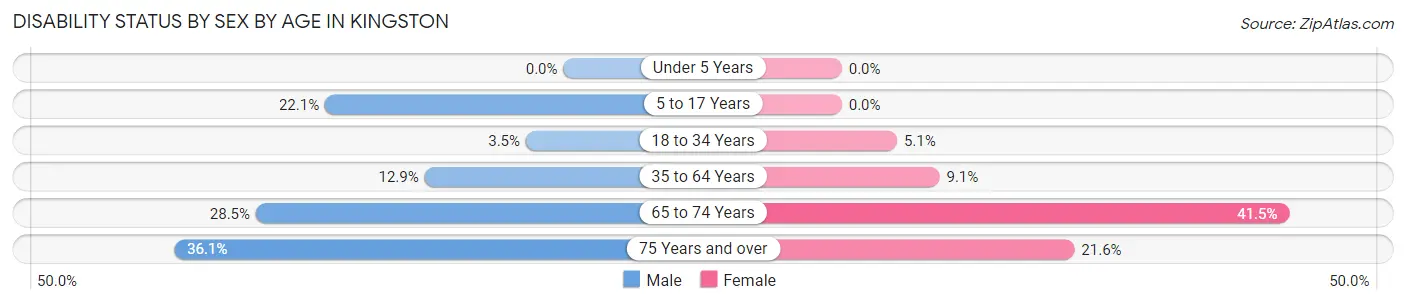
| Age Bracket | Male | Female |
| Under 5 Years | 0 (0.0%) | 0 (0.0%) |
| 5 to 17 Years | 96 (22.1%) | 0 (0.0%) |
| 18 to 34 Years | 25 (3.5%) | 13 (5.1%) |
| 35 to 64 Years | 143 (12.9%) | 138 (9.1%) |
| 65 to 74 Years | 143 (28.5%) | 152 (41.5%) |
| 75 Years and over | 69 (36.1%) | 49 (21.6%) |
Disability Class by Sex by Age in Kingston
Disability Class: Hearing Difficulty
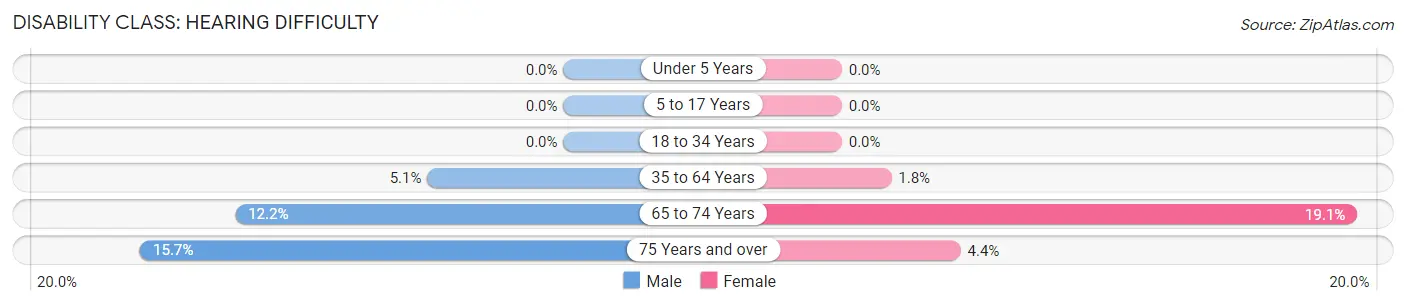
| Age Bracket | Male | Female |
| Under 5 Years | 0 (0.0%) | 0 (0.0%) |
| 5 to 17 Years | 0 (0.0%) | 0 (0.0%) |
| 18 to 34 Years | 0 (0.0%) | 0 (0.0%) |
| 35 to 64 Years | 56 (5.1%) | 28 (1.8%) |
| 65 to 74 Years | 61 (12.2%) | 70 (19.1%) |
| 75 Years and over | 30 (15.7%) | 10 (4.4%) |
Disability Class: Vision Difficulty
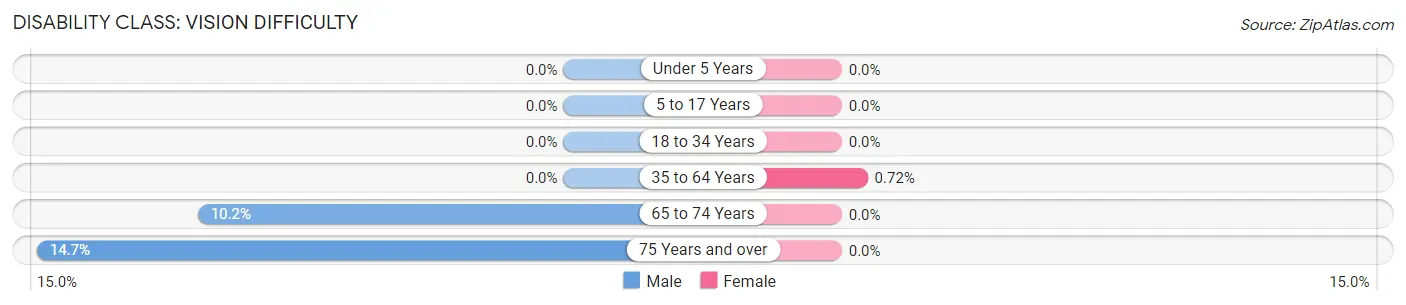
| Age Bracket | Male | Female |
| Under 5 Years | 0 (0.0%) | 0 (0.0%) |
| 5 to 17 Years | 0 (0.0%) | 0 (0.0%) |
| 18 to 34 Years | 0 (0.0%) | 0 (0.0%) |
| 35 to 64 Years | 0 (0.0%) | 11 (0.7%) |
| 65 to 74 Years | 51 (10.2%) | 0 (0.0%) |
| 75 Years and over | 28 (14.7%) | 0 (0.0%) |
Disability Class: Cognitive Difficulty
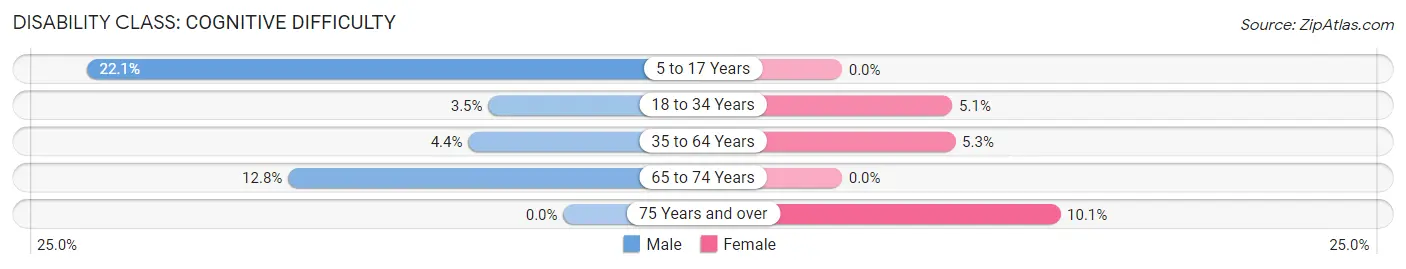
| Age Bracket | Male | Female |
| 5 to 17 Years | 96 (22.1%) | 0 (0.0%) |
| 18 to 34 Years | 25 (3.5%) | 13 (5.1%) |
| 35 to 64 Years | 49 (4.4%) | 80 (5.3%) |
| 65 to 74 Years | 64 (12.8%) | 0 (0.0%) |
| 75 Years and over | 0 (0.0%) | 23 (10.1%) |
Disability Class: Ambulatory Difficulty
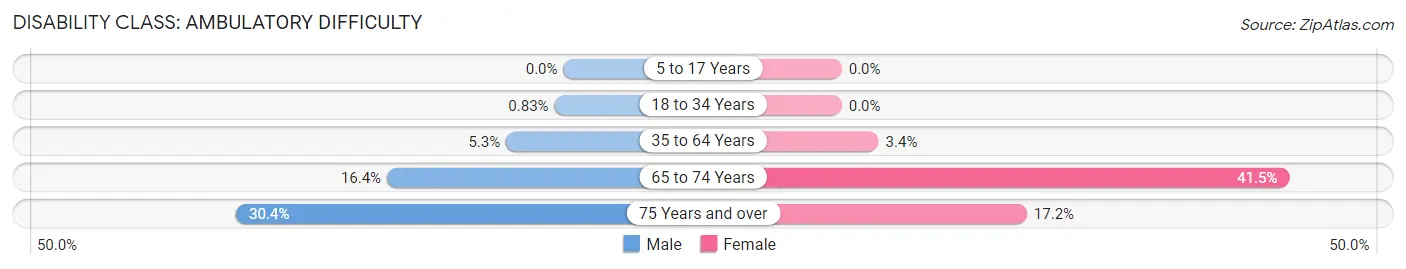
| Age Bracket | Male | Female |
| 5 to 17 Years | 0 (0.0%) | 0 (0.0%) |
| 18 to 34 Years | 6 (0.8%) | 0 (0.0%) |
| 35 to 64 Years | 59 (5.3%) | 52 (3.4%) |
| 65 to 74 Years | 82 (16.4%) | 152 (41.5%) |
| 75 Years and over | 58 (30.4%) | 39 (17.2%) |
Disability Class: Self-Care Difficulty
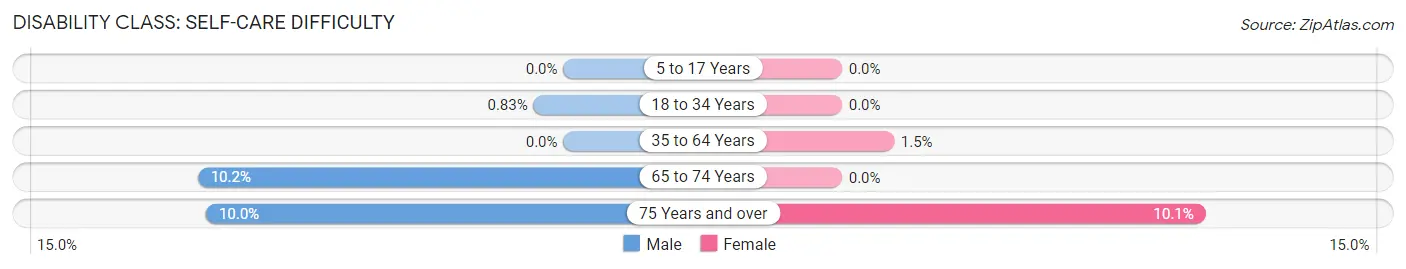
| Age Bracket | Male | Female |
| 5 to 17 Years | 0 (0.0%) | 0 (0.0%) |
| 18 to 34 Years | 6 (0.8%) | 0 (0.0%) |
| 35 to 64 Years | 0 (0.0%) | 22 (1.5%) |
| 65 to 74 Years | 51 (10.2%) | 0 (0.0%) |
| 75 Years and over | 19 (10.0%) | 23 (10.1%) |
Technology Access in Kingston
Computing Device Access in Kingston
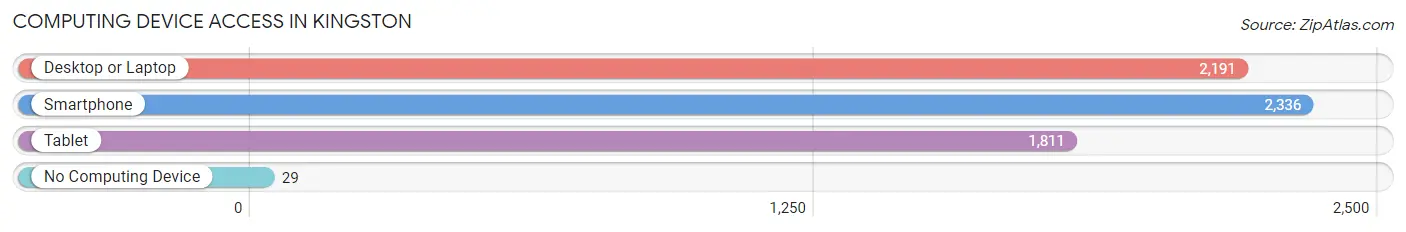
| Device Type | # Households | % Households |
| Desktop or Laptop | 2,191 | 87.5% |
| Smartphone | 2,336 | 93.3% |
| Tablet | 1,811 | 72.3% |
| No Computing Device | 29 | 1.2% |
| Total | 2,504 | 100.0% |
Internet Access in Kingston
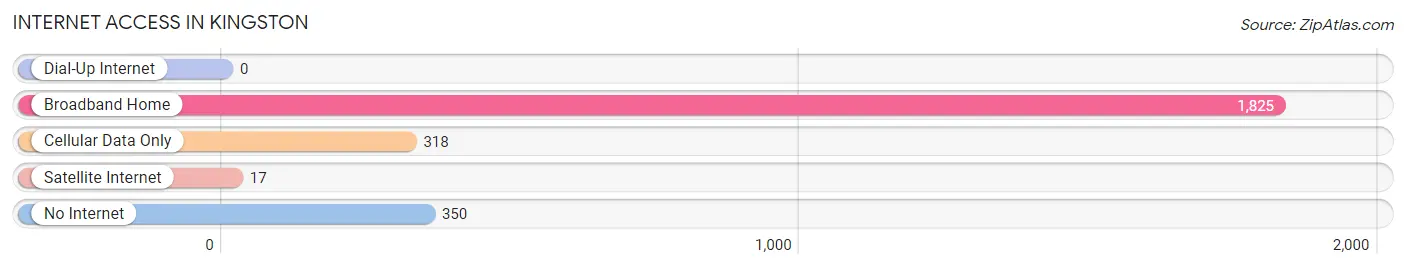
| Internet Type | # Households | % Households |
| Dial-Up Internet | 0 | 0.0% |
| Broadband Home | 1,825 | 72.9% |
| Cellular Data Only | 318 | 12.7% |
| Satellite Internet | 17 | 0.7% |
| No Internet | 350 | 14.0% |
| Total | 2,504 | 100.0% |
Kingston Summary
Kingston is a town located in Plymouth County, Massachusetts, United States. It is situated on the south shore of Massachusetts, approximately 25 miles south of Boston. The town was first settled in 1620 and was officially incorporated in 1726. As of the 2010 census, the town had a population of 12,629.
History
The area that is now Kingston was originally inhabited by the Wampanoag tribe. The first European settlers arrived in 1620 and established a settlement called Plymouth Colony. The town of Kingston was established in 1686 and was originally part of Plymouth Colony. In 1726, the town was officially incorporated as Kingston.
The town was named after Kingston upon Hull in England. The town was primarily an agricultural community until the mid-19th century when the town began to industrialize. The town was home to several mills, including a grist mill, a saw mill, and a paper mill. The town also had a shipbuilding industry and was home to several shipyards.
Geography
Kingston is located in Plymouth County, Massachusetts. It is situated on the south shore of Massachusetts, approximately 25 miles south of Boston. The town is bordered by the towns of Duxbury to the east, Pembroke to the north, and Plympton to the west. The town has a total area of 24.2 square miles, of which 23.7 square miles is land and 0.5 square miles is water.
The town is located on the shores of Kingston Bay, which is part of the larger Plymouth Bay. The town is also home to several ponds, including Great Pond, Little Pond, and Silver Lake. The town is located in the Atlantic coastal plain and is mostly flat. The highest point in the town is located at an elevation of 80 feet.
Economy
The economy of Kingston is largely based on the service industry. The town is home to several retail stores, restaurants, and other businesses. The town is also home to several industrial and manufacturing companies. The town is home to several technology companies, including a software development company and a medical device manufacturer.
The town is also home to several educational institutions, including the University of Massachusetts at Boston, the Massachusetts Maritime Academy, and the Plymouth County Technical School. The town is also home to several medical facilities, including the South Shore Hospital and the Jordan Hospital.
Demographics
As of the 2010 census, the town had a population of 12,629. The racial makeup of the town was 94.3% White, 1.7% African American, 0.3% Native American, 1.2% Asian, 0.1% Pacific Islander, 1.2% from other races, and 1.4% from two or more races. Hispanic or Latino of any race were 3.2% of the population.
The median income for a household in the town was $68,945 and the median income for a family was $81,945. The per capita income for the town was $31,945. About 4.2% of families and 5.7% of the population were below the poverty line, including 6.3% of those under age 18 and 4.2% of those age 65 or over.
Common Questions
What is Per Capita Income in Kingston?
Per Capita income in Kingston is $57,631.
What is the Median Family Income in Kingston?
Median Family Income in Kingston is $140,203.
What is the Median Household income in Kingston?
Median Household Income in Kingston is $124,048.
What is Income or Wage Gap in Kingston?
Income or Wage Gap in Kingston is 34.1%.
Women in Kingston earn 65.9 cents for every dollar earned by a man.
What is Inequality or Gini Index in Kingston?
Inequality or Gini Index in Kingston is 0.40.
What is the Total Population of Kingston?
Total Population of Kingston is 6,090.
What is the Total Male Population of Kingston?
Total Male Population of Kingston is 3,092.
What is the Total Female Population of Kingston?
Total Female Population of Kingston is 2,998.
What is the Ratio of Males per 100 Females in Kingston?
There are 103.14 Males per 100 Females in Kingston.
What is the Ratio of Females per 100 Males in Kingston?
There are 96.96 Females per 100 Males in Kingston.
What is the Median Population Age in Kingston?
Median Population Age in Kingston is 45.1 Years.
What is the Average Family Size in Kingston
Average Family Size in Kingston is 2.9 People.
What is the Average Household Size in Kingston
Average Household Size in Kingston is 2.4 People.
How Large is the Labor Force in Kingston?
There are 3,751 People in the Labor Forcein in Kingston.
What is the Percentage of People in the Labor Force in Kingston?
72.6% of People are in the Labor Force in Kingston.
What is the Unemployment Rate in Kingston?
Unemployment Rate in Kingston is 2.3%.