Crystal Lawns, IL Map & Demographics
Crystal Lawns Map
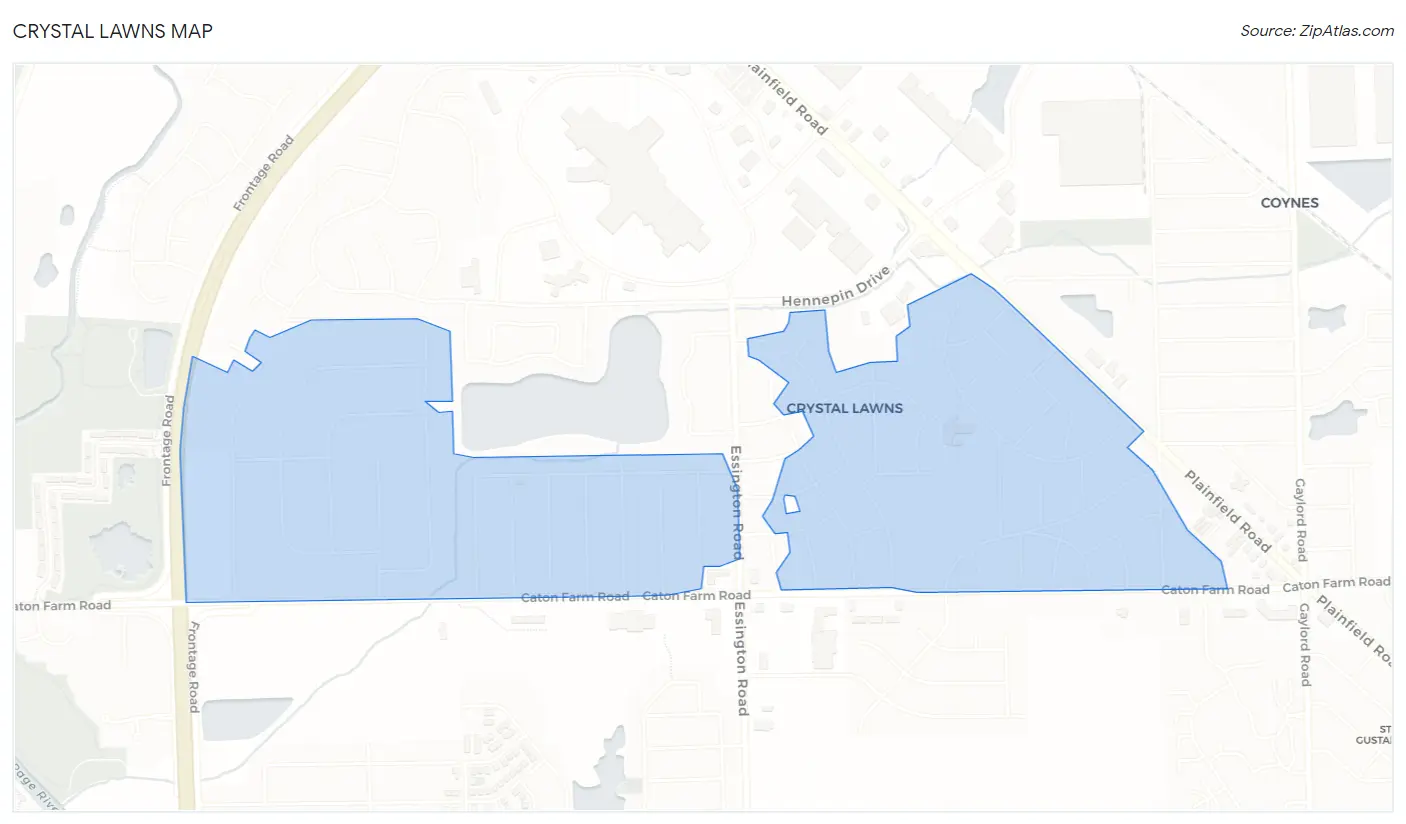
Crystal Lawns Overview
$39,363
PER CAPITA INCOME
$107,953
AVG FAMILY INCOME
$102,250
AVG HOUSEHOLD INCOME
31.5%
WAGE / INCOME GAP [ % ]
68.5¢/ $1
WAGE / INCOME GAP [ $ ]
0.27
INEQUALITY / GINI INDEX
1,848
TOTAL POPULATION
981
MALE POPULATION
867
FEMALE POPULATION
113.15
MALES / 100 FEMALES
88.38
FEMALES / 100 MALES
38.2
MEDIAN AGE
3.1
AVG FAMILY SIZE
2.7
AVG HOUSEHOLD SIZE
1,236
LABOR FORCE [ PEOPLE ]
79.4%
PERCENT IN LABOR FORCE
4.4%
UNEMPLOYMENT RATE
Income in Crystal Lawns
Income Overview in Crystal Lawns
Per Capita Income in Crystal Lawns is $39,363, while median incomes of families and households are $107,953 and $102,250 respectively.
| Characteristic | Number | Measure |
| Per Capita Income | 1,848 | $39,363 |
| Median Family Income | 529 | $107,953 |
| Mean Family Income | 529 | $116,677 |
| Median Household Income | 687 | $102,250 |
| Mean Household Income | 687 | $107,027 |
| Income Deficit | 529 | $0 |
| Wage / Income Gap (%) | 1,848 | 31.55% |
| Wage / Income Gap ($) | 1,848 | 68.45¢ per $1 |
| Gini / Inequality Index | 1,848 | 0.27 |
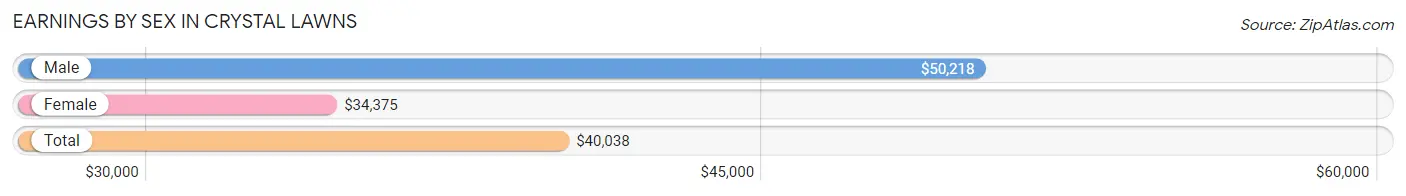
Earnings by Sex in Crystal Lawns
Average Earnings in Crystal Lawns are $40,038, $50,218 for men and $34,375 for women, a difference of 31.6%.
| Sex | Number | Average Earnings |
| Male | 773 (63.7%) | $50,218 |
| Female | 440 (36.3%) | $34,375 |
| Total | 1,213 (100.0%) | $40,038 |
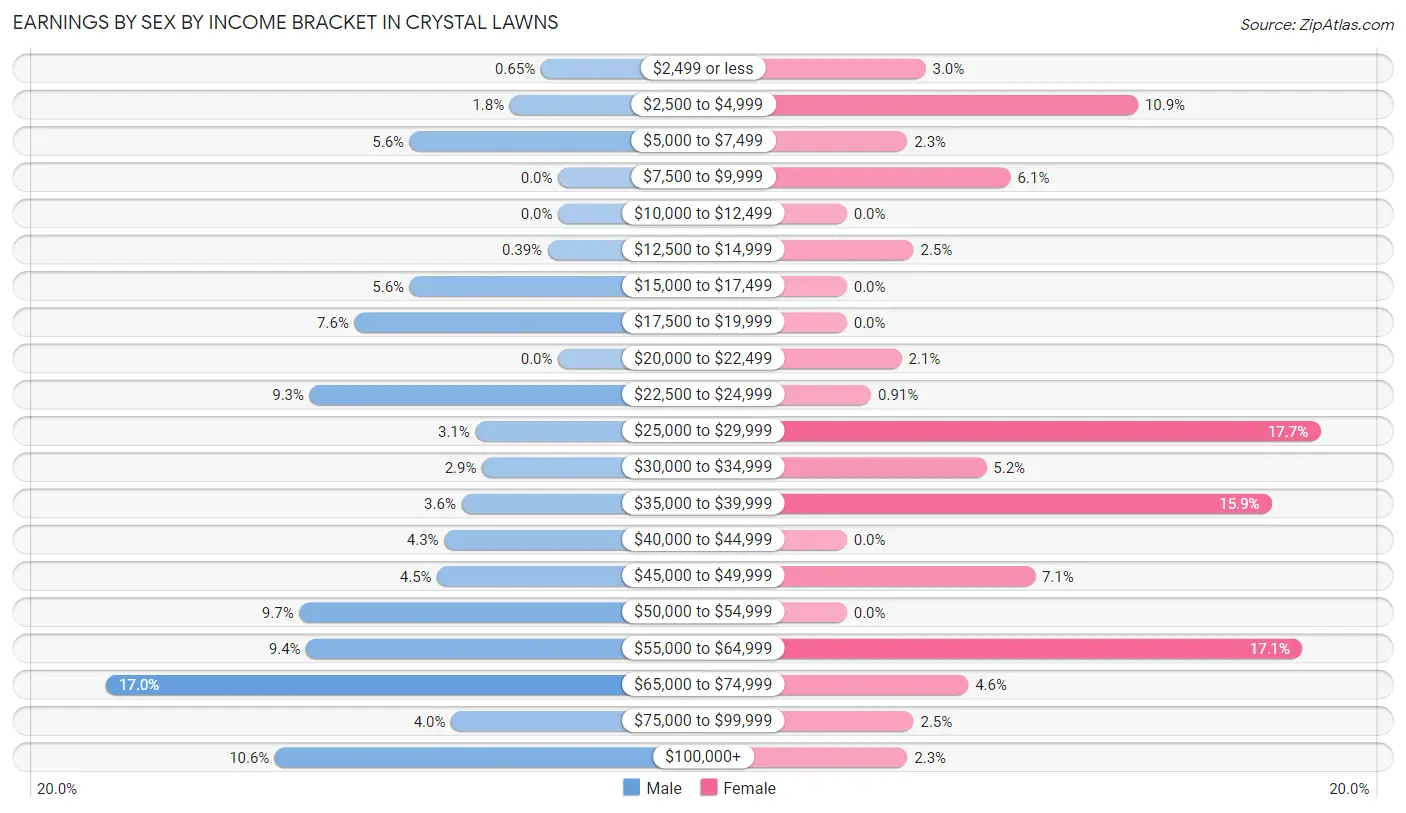
Earnings by Sex by Income Bracket in Crystal Lawns
The most common earnings brackets in Crystal Lawns are $65,000 to $74,999 for men (131 | 17.0%) and $25,000 to $29,999 for women (78 | 17.7%).
| Income | Male | Female |
| $2,499 or less | 5 (0.6%) | 13 (2.9%) |
| $2,500 to $4,999 | 14 (1.8%) | 48 (10.9%) |
| $5,000 to $7,499 | 43 (5.6%) | 10 (2.3%) |
| $7,500 to $9,999 | 0 (0.0%) | 27 (6.1%) |
| $10,000 to $12,499 | 0 (0.0%) | 0 (0.0%) |
| $12,500 to $14,999 | 3 (0.4%) | 11 (2.5%) |
| $15,000 to $17,499 | 43 (5.6%) | 0 (0.0%) |
| $17,500 to $19,999 | 59 (7.6%) | 0 (0.0%) |
| $20,000 to $22,499 | 0 (0.0%) | 9 (2.1%) |
| $22,500 to $24,999 | 72 (9.3%) | 4 (0.9%) |
| $25,000 to $29,999 | 24 (3.1%) | 78 (17.7%) |
| $30,000 to $34,999 | 22 (2.9%) | 23 (5.2%) |
| $35,000 to $39,999 | 28 (3.6%) | 70 (15.9%) |
| $40,000 to $44,999 | 33 (4.3%) | 0 (0.0%) |
| $45,000 to $49,999 | 35 (4.5%) | 31 (7.0%) |
| $50,000 to $54,999 | 75 (9.7%) | 0 (0.0%) |
| $55,000 to $64,999 | 73 (9.4%) | 75 (17.1%) |
| $65,000 to $74,999 | 131 (17.0%) | 20 (4.5%) |
| $75,000 to $99,999 | 31 (4.0%) | 11 (2.5%) |
| $100,000+ | 82 (10.6%) | 10 (2.3%) |
| Total | 773 (100.0%) | 440 (100.0%) |
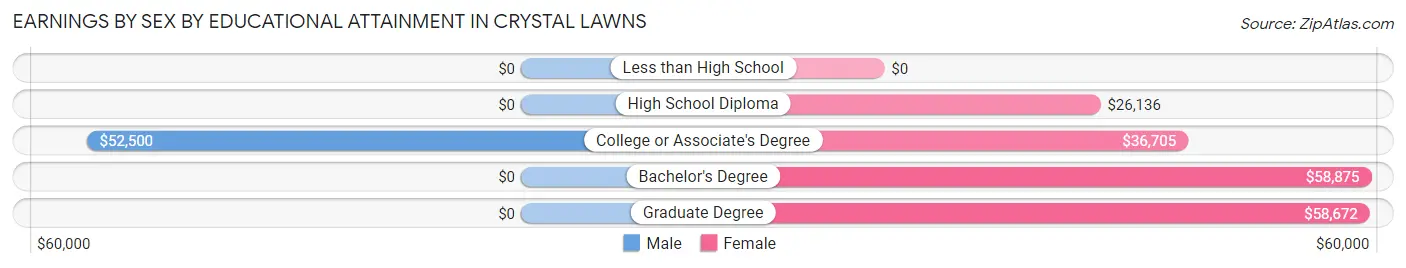
Earnings by Sex by Educational Attainment in Crystal Lawns
Average earnings in Crystal Lawns are $53,854 for men and $36,191 for women, a difference of 32.8%. Men with an educational attainment of college or associate's degree enjoy the highest average annual earnings of $52,500, while those with college or associate's degree education earn the least with $52,500. Women with an educational attainment of bachelor's degree earn the most with the average annual earnings of $58,875, while those with high school diploma education have the smallest earnings of $26,136.
| Educational Attainment | Male Income | Female Income |
| Less than High School | - | - |
| High School Diploma | - | - |
| College or Associate's Degree | $52,500 | $36,705 |
| Bachelor's Degree | - | - |
| Graduate Degree | - | - |
| Total | $53,854 | $36,191 |
Family Income in Crystal Lawns
Family Income Brackets in Crystal Lawns
According to the Crystal Lawns family income data, there are 255 families falling into the $100,000 to $149,999 income range, which is the most common income bracket and makes up 48.2% of all families.
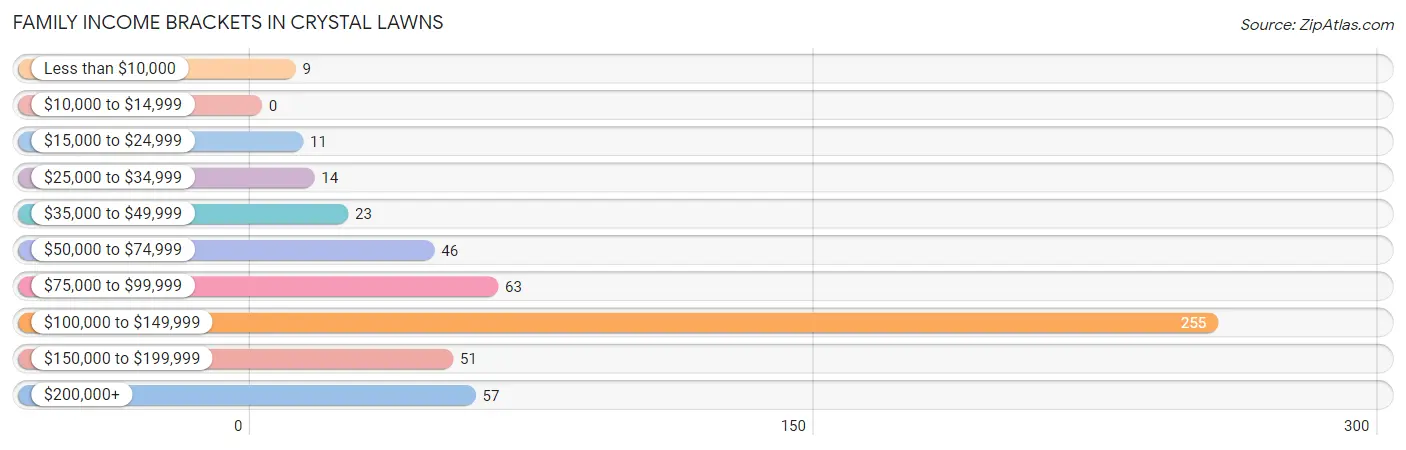
| Income Bracket | # Families | % Families |
| Less than $10,000 | 9 | 1.7% |
| $10,000 to $14,999 | 0 | 0.0% |
| $15,000 to $24,999 | 11 | 2.1% |
| $25,000 to $34,999 | 14 | 2.6% |
| $35,000 to $49,999 | 23 | 4.3% |
| $50,000 to $74,999 | 46 | 8.7% |
| $75,000 to $99,999 | 63 | 11.9% |
| $100,000 to $149,999 | 255 | 48.2% |
| $150,000 to $199,999 | 51 | 9.6% |
| $200,000+ | 57 | 10.8% |
Family Income by Famaliy Size in Crystal Lawns
3-person families (146 | 27.6%) account for the highest median family income in Crystal Lawns with $115,250 per family, while 2-person families (172 | 32.5%) have the highest median income of $38,958 per family member.
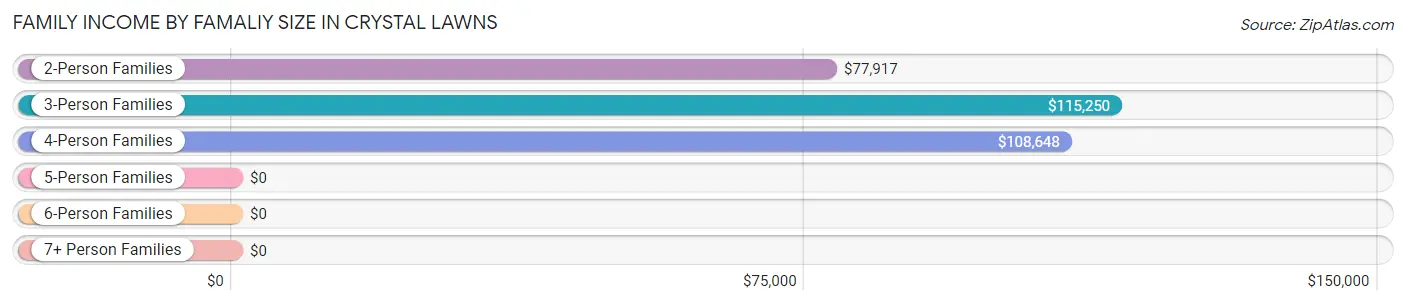
| Income Bracket | # Families | Median Income |
| 2-Person Families | 172 (32.5%) | $77,917 |
| 3-Person Families | 146 (27.6%) | $115,250 |
| 4-Person Families | 195 (36.9%) | $108,648 |
| 5-Person Families | 9 (1.7%) | $0 |
| 6-Person Families | 7 (1.3%) | $0 |
| 7+ Person Families | 0 (0.0%) | $0 |
| Total | 529 (100.0%) | $107,953 |
Family Income by Number of Earners in Crystal Lawns
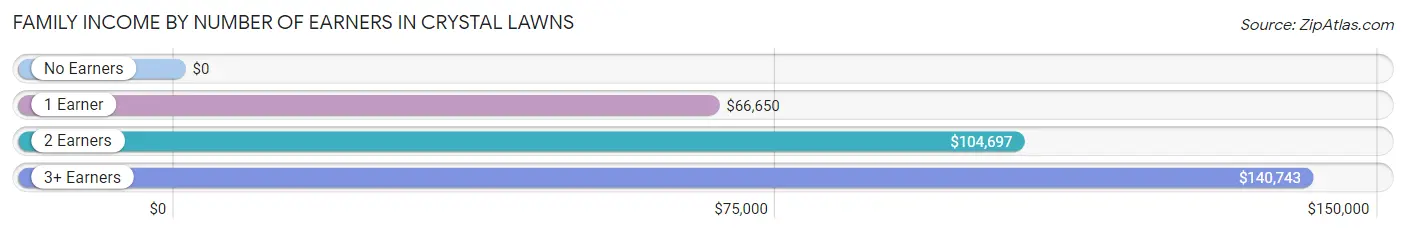
| Number of Earners | # Families | Median Income |
| No Earners | 26 (4.9%) | $0 |
| 1 Earner | 155 (29.3%) | $66,650 |
| 2 Earners | 184 (34.8%) | $104,697 |
| 3+ Earners | 164 (31.0%) | $140,743 |
| Total | 529 (100.0%) | $107,953 |
Household Income in Crystal Lawns
Household Income Brackets in Crystal Lawns
With 267 households falling in the category, the $100,000 to $149,999 income range is the most frequent in Crystal Lawns, accounting for 38.9% of all households.
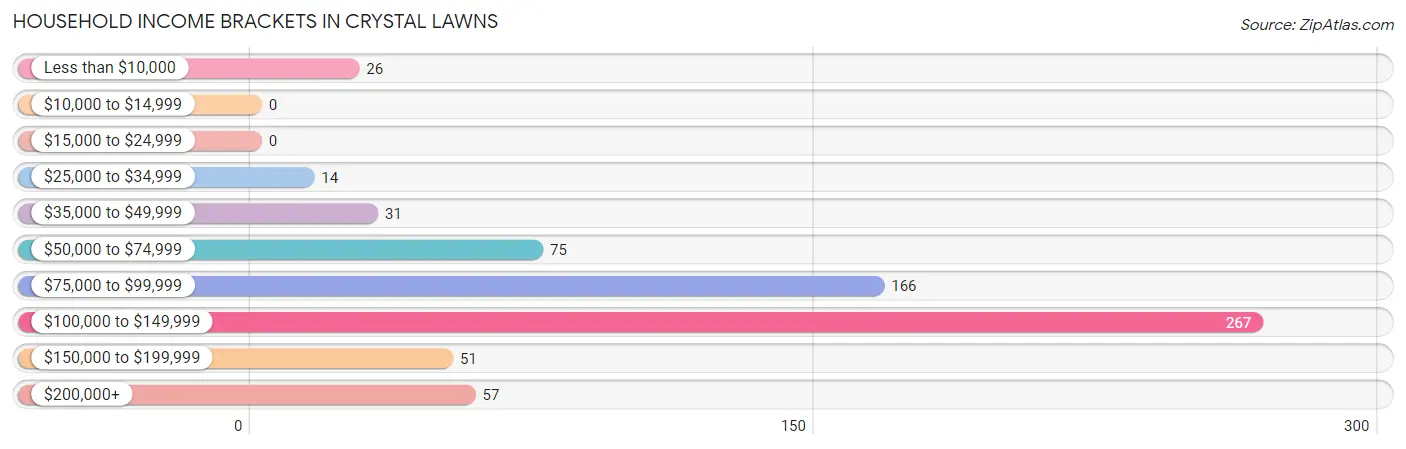
| Income Bracket | # Households | % Households |
| Less than $10,000 | 26 | 3.8% |
| $10,000 to $14,999 | 0 | 0.0% |
| $15,000 to $24,999 | 0 | 0.0% |
| $25,000 to $34,999 | 14 | 2.0% |
| $35,000 to $49,999 | 31 | 4.5% |
| $50,000 to $74,999 | 75 | 10.9% |
| $75,000 to $99,999 | 166 | 24.2% |
| $100,000 to $149,999 | 267 | 38.9% |
| $150,000 to $199,999 | 51 | 7.4% |
| $200,000+ | 57 | 8.3% |
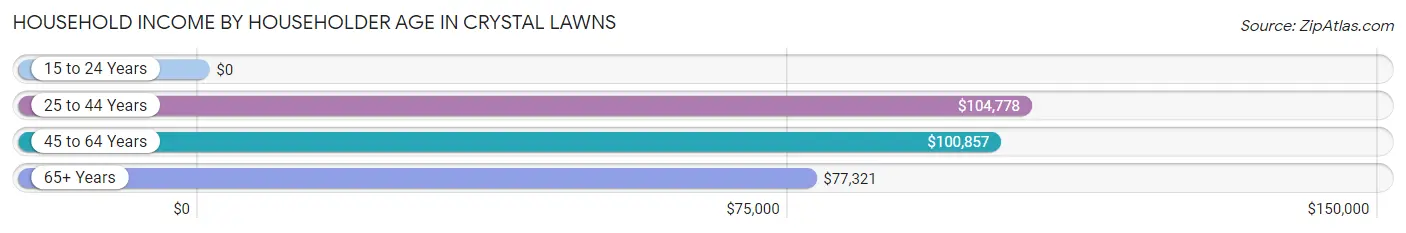
Household Income by Householder Age in Crystal Lawns
The median household income in Crystal Lawns is $102,250, with the highest median household income of $104,778 found in the 25 to 44 years age bracket for the primary householder. A total of 272 households (39.6%) fall into this category.
| Income Bracket | # Households | Median Income |
| 15 to 24 Years | 0 (0.0%) | $0 |
| 25 to 44 Years | 272 (39.6%) | $104,778 |
| 45 to 64 Years | 268 (39.0%) | $100,857 |
| 65+ Years | 147 (21.4%) | $77,321 |
| Total | 687 (100.0%) | $102,250 |
Poverty in Crystal Lawns
Income Below Poverty by Sex and Age in Crystal Lawns
With 4.6% poverty level for males and 4.7% for females among the residents of Crystal Lawns, 12 to 14 year old males and 75 year old and over females are the most vulnerable to poverty, with 11 males (50.0%) and 8 females (21.6%) in their respective age groups living below the poverty level.
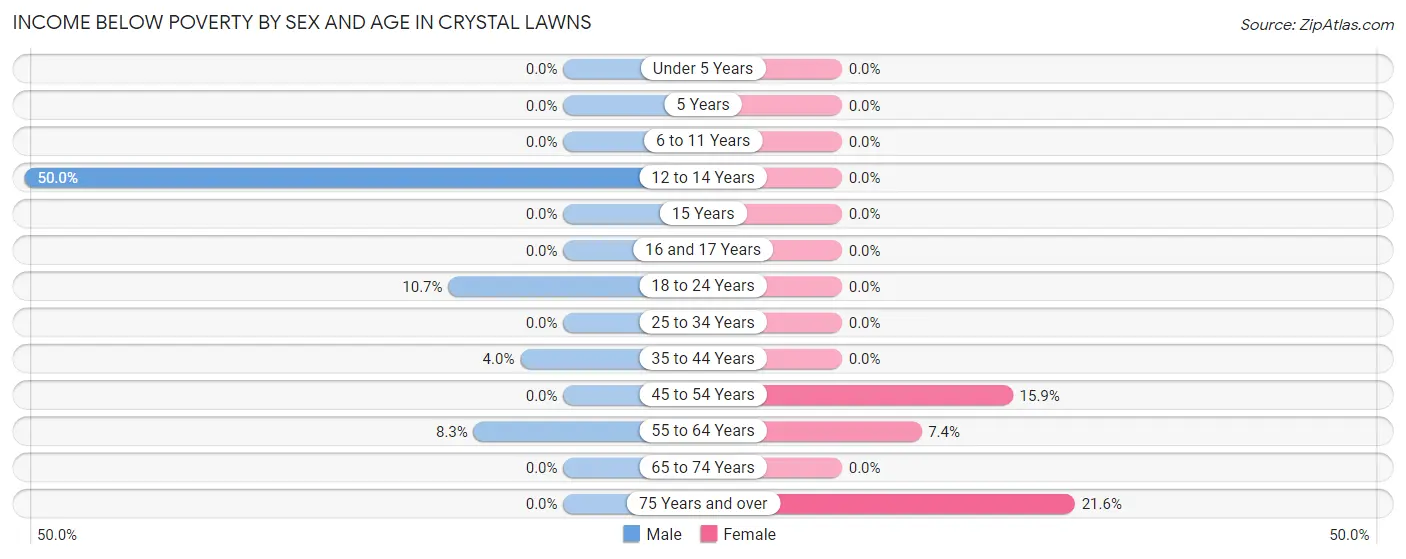
| Age Bracket | Male | Female |
| Under 5 Years | 0 (0.0%) | 0 (0.0%) |
| 5 Years | 0 (0.0%) | 0 (0.0%) |
| 6 to 11 Years | 0 (0.0%) | 0 (0.0%) |
| 12 to 14 Years | 11 (50.0%) | 0 (0.0%) |
| 15 Years | 0 (0.0%) | 0 (0.0%) |
| 16 and 17 Years | 0 (0.0%) | 0 (0.0%) |
| 18 to 24 Years | 16 (10.7%) | 0 (0.0%) |
| 25 to 34 Years | 0 (0.0%) | 0 (0.0%) |
| 35 to 44 Years | 9 (4.0%) | 0 (0.0%) |
| 45 to 54 Years | 0 (0.0%) | 26 (15.9%) |
| 55 to 64 Years | 9 (8.3%) | 7 (7.4%) |
| 65 to 74 Years | 0 (0.0%) | 0 (0.0%) |
| 75 Years and over | 0 (0.0%) | 8 (21.6%) |
| Total | 45 (4.6%) | 41 (4.7%) |
Income Above Poverty by Sex and Age in Crystal Lawns
According to the poverty statistics in Crystal Lawns, males aged under 5 years and females aged under 5 years are the age groups that are most secure financially, with 100.0% of males and 100.0% of females in these age groups living above the poverty line.
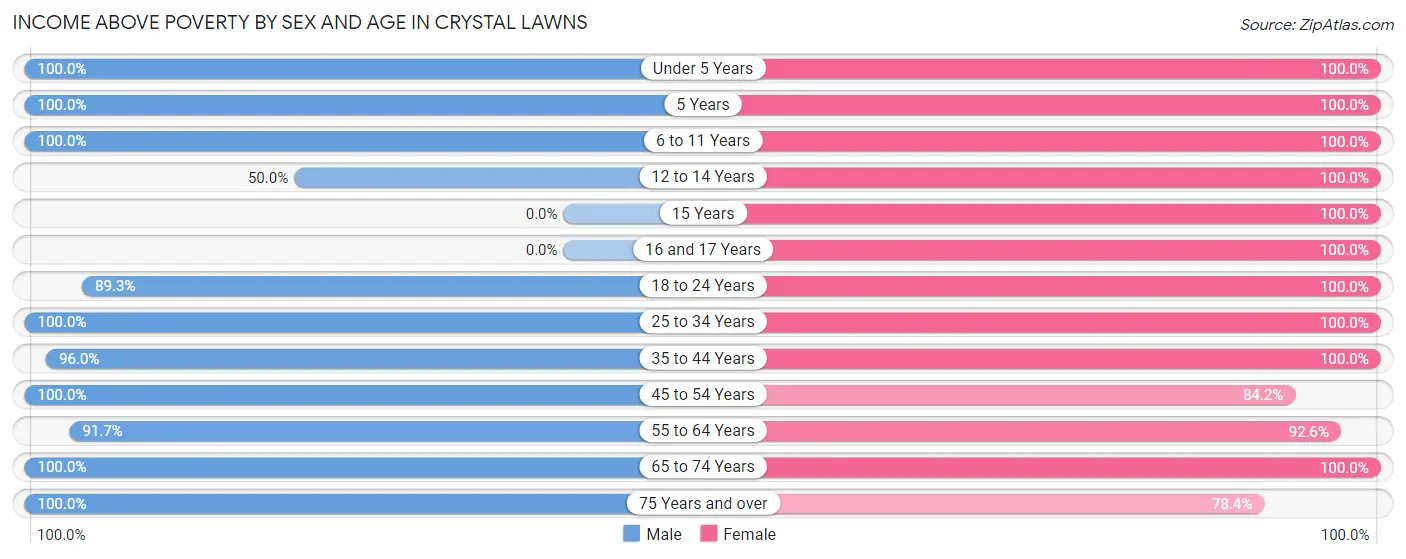
| Age Bracket | Male | Female |
| Under 5 Years | 9 (100.0%) | 30 (100.0%) |
| 5 Years | 18 (100.0%) | 56 (100.0%) |
| 6 to 11 Years | 63 (100.0%) | 9 (100.0%) |
| 12 to 14 Years | 11 (50.0%) | 24 (100.0%) |
| 15 Years | 0 (0.0%) | 60 (100.0%) |
| 16 and 17 Years | 0 (0.0%) | 46 (100.0%) |
| 18 to 24 Years | 134 (89.3%) | 40 (100.0%) |
| 25 to 34 Years | 162 (100.0%) | 117 (100.0%) |
| 35 to 44 Years | 216 (96.0%) | 96 (100.0%) |
| 45 to 54 Years | 106 (100.0%) | 138 (84.2%) |
| 55 to 64 Years | 99 (91.7%) | 88 (92.6%) |
| 65 to 74 Years | 100 (100.0%) | 93 (100.0%) |
| 75 Years and over | 18 (100.0%) | 29 (78.4%) |
| Total | 936 (95.4%) | 826 (95.3%) |
Income Below Poverty Among Married-Couple Families in Crystal Lawns
The poverty statistics for married-couple families in Crystal Lawns show that 2.2% or 9 of the total 414 families live below the poverty line. Families with no children have the highest poverty rate of 3.9%, comprising of 9 families. On the other hand, families with 1 or 2 children have the lowest poverty rate of 0.0%, which includes 0 families.
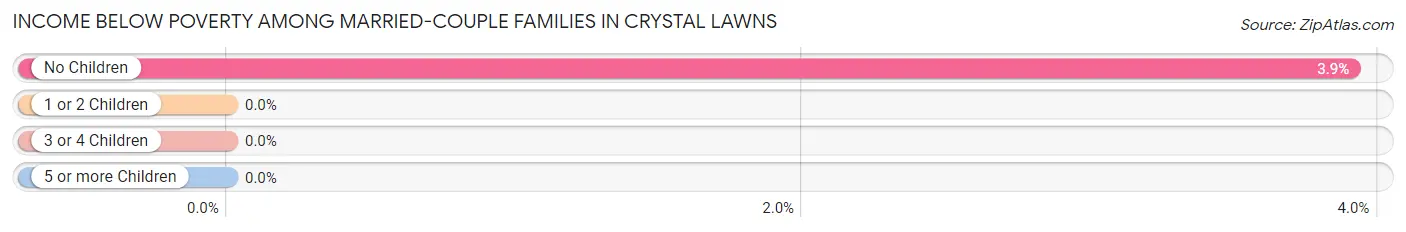
| Children | Above Poverty | Below Poverty |
| No Children | 221 (96.1%) | 9 (3.9%) |
| 1 or 2 Children | 175 (100.0%) | 0 (0.0%) |
| 3 or 4 Children | 9 (100.0%) | 0 (0.0%) |
| 5 or more Children | 0 (0.0%) | 0 (0.0%) |
| Total | 405 (97.8%) | 9 (2.2%) |
Income Below Poverty Among Single-Parent Households in Crystal Lawns
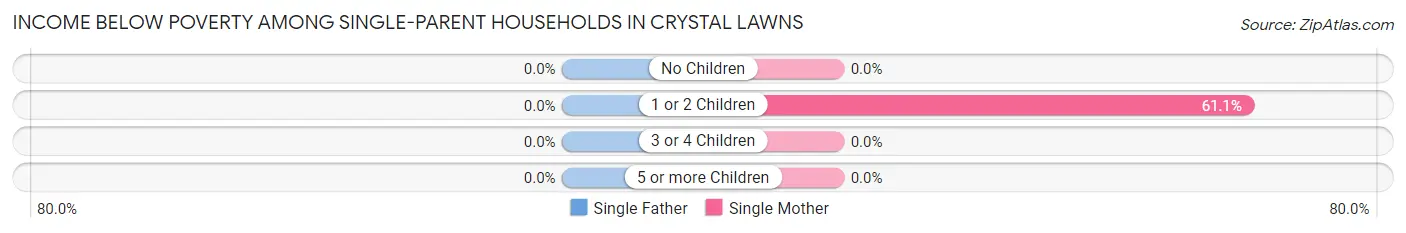
| Children | Single Father | Single Mother |
| No Children | 0 (0.0%) | 0 (0.0%) |
| 1 or 2 Children | 0 (0.0%) | 11 (61.1%) |
| 3 or 4 Children | 0 (0.0%) | 0 (0.0%) |
| 5 or more Children | 0 (0.0%) | 0 (0.0%) |
| Total | 0 (0.0%) | 11 (32.4%) |
Income Below Poverty Among Married-Couple vs Single-Parent Households in Crystal Lawns
The poverty data for Crystal Lawns shows that 9 of the married-couple family households (2.2%) and 11 of the single-parent households (9.6%) are living below the poverty level. Within the married-couple family households, those with no children have the highest poverty rate, with 9 households (3.9%) falling below the poverty line. Among the single-parent households, those with 1 or 2 children have the highest poverty rate, with 11 household (12.9%) living below poverty.
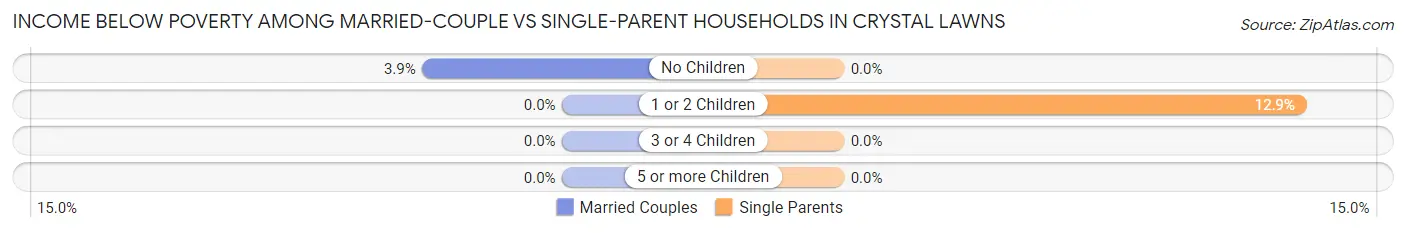
| Children | Married-Couple Families | Single-Parent Households |
| No Children | 9 (3.9%) | 0 (0.0%) |
| 1 or 2 Children | 0 (0.0%) | 11 (12.9%) |
| 3 or 4 Children | 0 (0.0%) | 0 (0.0%) |
| 5 or more Children | 0 (0.0%) | 0 (0.0%) |
| Total | 9 (2.2%) | 11 (9.6%) |
Race in Crystal Lawns
The most populous races in Crystal Lawns are White / Caucasian (1,289 | 69.8%), Hispanic or Latino (473 | 25.6%), and Two or more Races (201 | 10.9%).
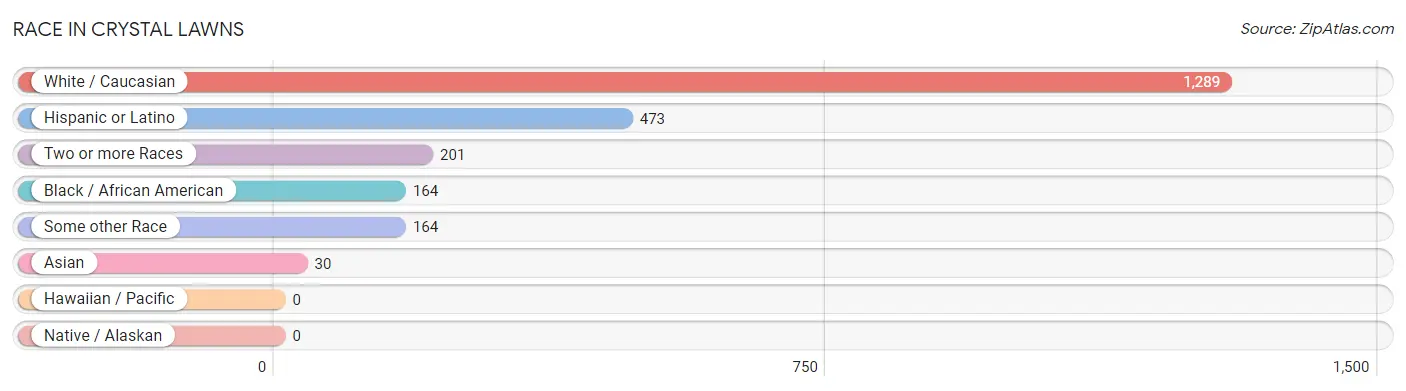
| Race | # Population | % Population |
| Asian | 30 | 1.6% |
| Black / African American | 164 | 8.9% |
| Hawaiian / Pacific | 0 | 0.0% |
| Hispanic or Latino | 473 | 25.6% |
| Native / Alaskan | 0 | 0.0% |
| White / Caucasian | 1,289 | 69.8% |
| Two or more Races | 201 | 10.9% |
| Some other Race | 164 | 8.9% |
| Total | 1,848 | 100.0% |
Ancestry in Crystal Lawns
The most populous ancestries reported in Crystal Lawns are Mexican (426 | 23.1%), German (374 | 20.2%), Irish (306 | 16.6%), Polish (205 | 11.1%), and Italian (179 | 9.7%), together accounting for 80.6% of all Crystal Lawns residents.
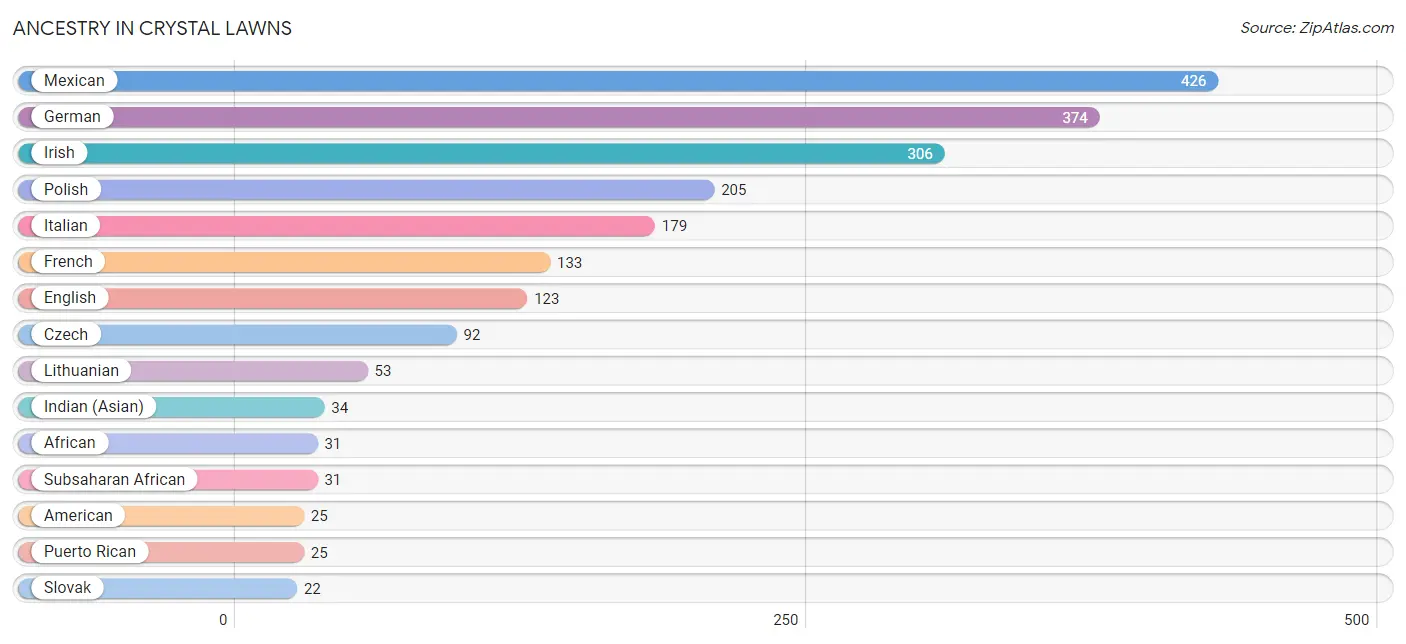
| Ancestry | # Population | % Population |
| African | 31 | 1.7% |
| American | 25 | 1.3% |
| Cherokee | 4 | 0.2% |
| Croatian | 9 | 0.5% |
| Czech | 92 | 5.0% |
| Dutch | 14 | 0.8% |
| English | 123 | 6.7% |
| European | 12 | 0.6% |
| French | 133 | 7.2% |
| German | 374 | 20.2% |
| Indian (Asian) | 34 | 1.8% |
| Irish | 306 | 16.6% |
| Italian | 179 | 9.7% |
| Japanese | 7 | 0.4% |
| Lithuanian | 53 | 2.9% |
| Mexican | 426 | 23.1% |
| Norwegian | 13 | 0.7% |
| Polish | 205 | 11.1% |
| Portuguese | 15 | 0.8% |
| Puerto Rican | 25 | 1.3% |
| Slovak | 22 | 1.2% |
| Slovene | 9 | 0.5% |
| Spaniard | 22 | 1.2% |
| Subsaharan African | 31 | 1.7% |
| Swedish | 8 | 0.4% | View All 25 Rows |
Immigrants in Crystal Lawns
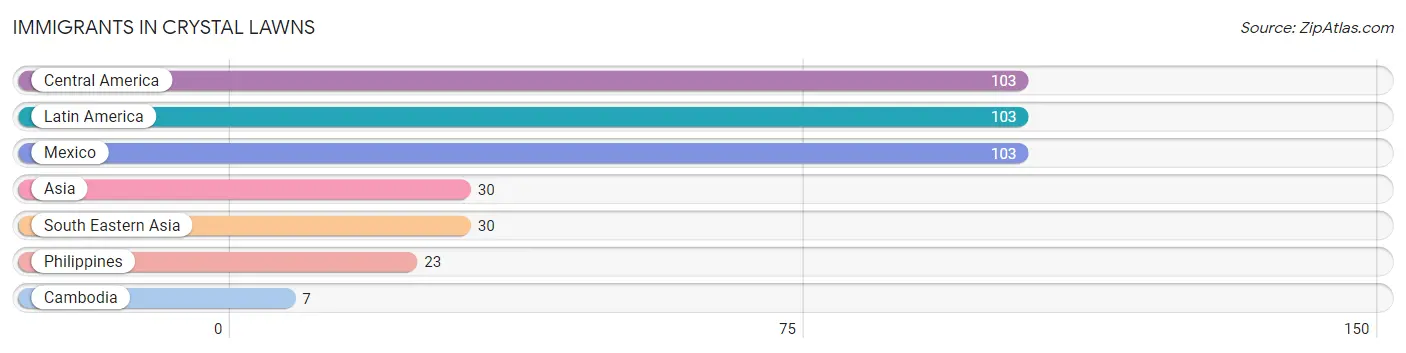
The most numerous immigrant groups reported in Crystal Lawns came from Central America (103 | 5.6%), Latin America (103 | 5.6%), Mexico (103 | 5.6%), Asia (30 | 1.6%), and South Eastern Asia (30 | 1.6%), together accounting for 19.9% of all Crystal Lawns residents.
| Immigration Origin | # Population | % Population |
| Asia | 30 | 1.6% |
| Cambodia | 7 | 0.4% |
| Central America | 103 | 5.6% |
| Latin America | 103 | 5.6% |
| Mexico | 103 | 5.6% |
| Philippines | 23 | 1.2% |
| South Eastern Asia | 30 | 1.6% | View All 7 Rows |
Sex and Age in Crystal Lawns
Sex and Age in Crystal Lawns
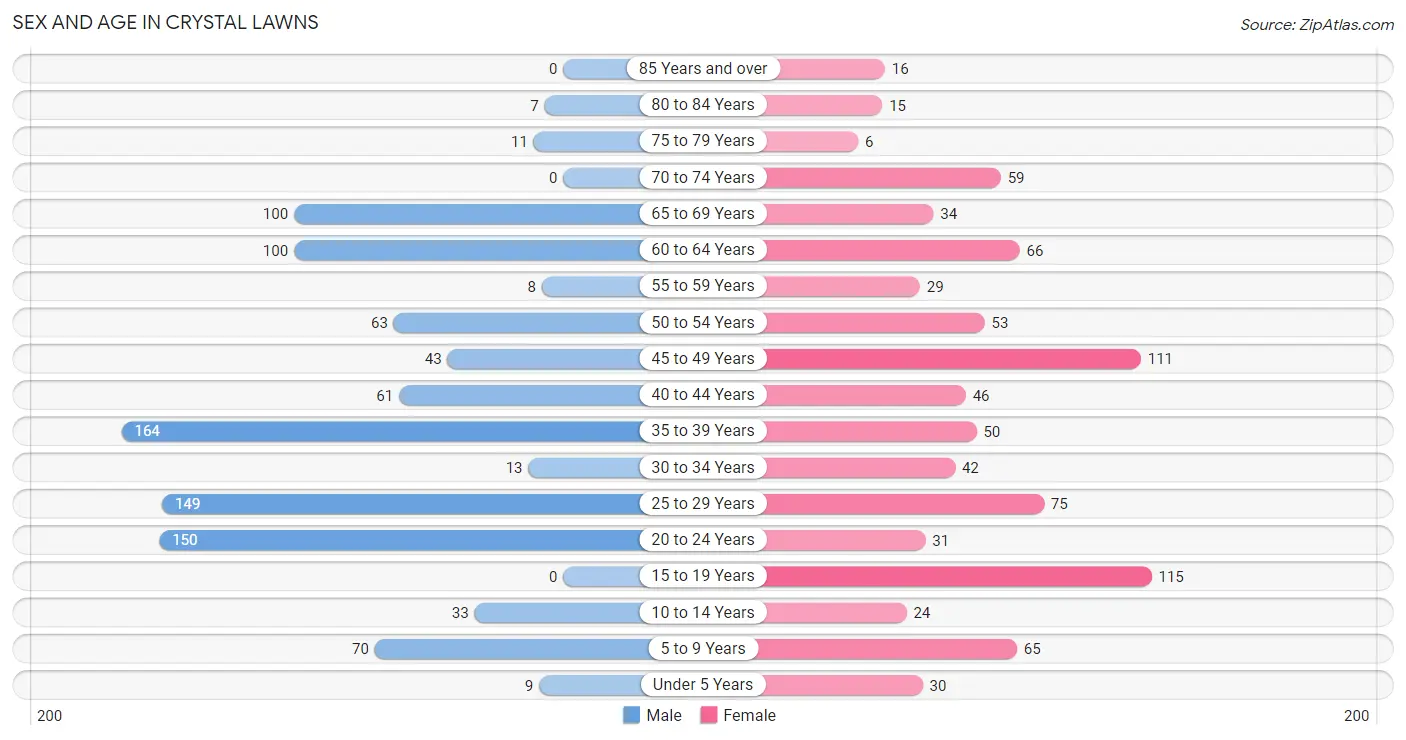
The most populous age groups in Crystal Lawns are 35 to 39 Years (164 | 16.7%) for men and 15 to 19 Years (115 | 13.3%) for women.
| Age Bracket | Male | Female |
| Under 5 Years | 9 (0.9%) | 30 (3.5%) |
| 5 to 9 Years | 70 (7.1%) | 65 (7.5%) |
| 10 to 14 Years | 33 (3.4%) | 24 (2.8%) |
| 15 to 19 Years | 0 (0.0%) | 115 (13.3%) |
| 20 to 24 Years | 150 (15.3%) | 31 (3.6%) |
| 25 to 29 Years | 149 (15.2%) | 75 (8.6%) |
| 30 to 34 Years | 13 (1.3%) | 42 (4.8%) |
| 35 to 39 Years | 164 (16.7%) | 50 (5.8%) |
| 40 to 44 Years | 61 (6.2%) | 46 (5.3%) |
| 45 to 49 Years | 43 (4.4%) | 111 (12.8%) |
| 50 to 54 Years | 63 (6.4%) | 53 (6.1%) |
| 55 to 59 Years | 8 (0.8%) | 29 (3.3%) |
| 60 to 64 Years | 100 (10.2%) | 66 (7.6%) |
| 65 to 69 Years | 100 (10.2%) | 34 (3.9%) |
| 70 to 74 Years | 0 (0.0%) | 59 (6.8%) |
| 75 to 79 Years | 11 (1.1%) | 6 (0.7%) |
| 80 to 84 Years | 7 (0.7%) | 15 (1.7%) |
| 85 Years and over | 0 (0.0%) | 16 (1.8%) |
| Total | 981 (100.0%) | 867 (100.0%) |
Families and Households in Crystal Lawns
Median Family Size in Crystal Lawns
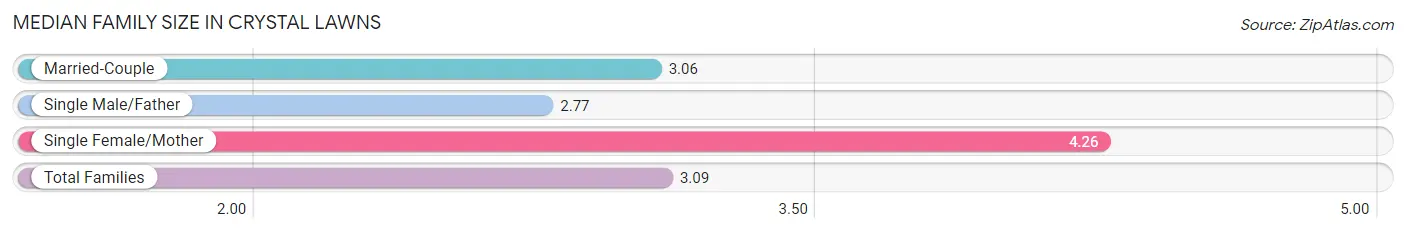
The median family size in Crystal Lawns is 3.09 persons per family, with single female/mother families (34 | 6.4%) accounting for the largest median family size of 4.26 persons per family. On the other hand, single male/father families (81 | 15.3%) represent the smallest median family size with 2.77 persons per family.
| Family Type | # Families | Family Size |
| Married-Couple | 414 (78.3%) | 3.06 |
| Single Male/Father | 81 (15.3%) | 2.77 |
| Single Female/Mother | 34 (6.4%) | 4.26 |
| Total Families | 529 (100.0%) | 3.09 |
Median Household Size in Crystal Lawns
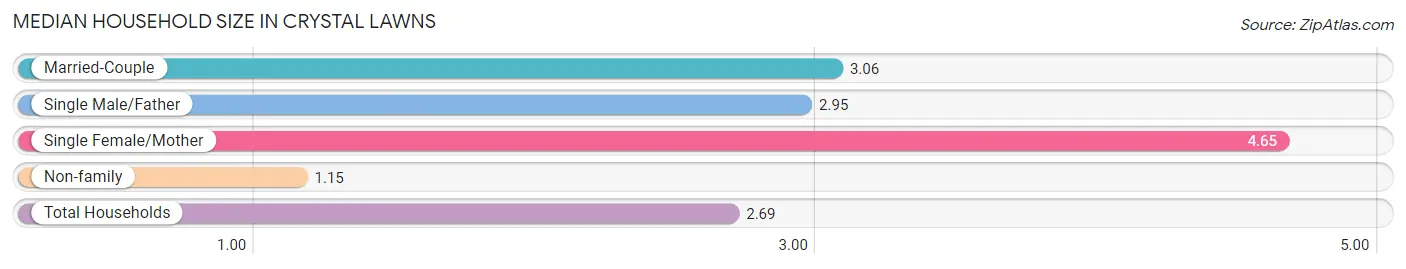
The median household size in Crystal Lawns is 2.69 persons per household, with single female/mother households (34 | 5.0%) accounting for the largest median household size of 4.65 persons per household. non-family households (158 | 23.0%) represent the smallest median household size with 1.15 persons per household.
| Household Type | # Households | Household Size |
| Married-Couple | 414 (60.3%) | 3.06 |
| Single Male/Father | 81 (11.8%) | 2.95 |
| Single Female/Mother | 34 (5.0%) | 4.65 |
| Non-family | 158 (23.0%) | 1.15 |
| Total Households | 687 (100.0%) | 2.69 |
Household Size by Marriage Status in Crystal Lawns
Out of a total of 687 households in Crystal Lawns, 529 (77.0%) are family households, while 158 (23.0%) are nonfamily households. The most numerous type of family households are 4-person households, comprising 206, and the most common type of nonfamily households are 1-person households, comprising 135.
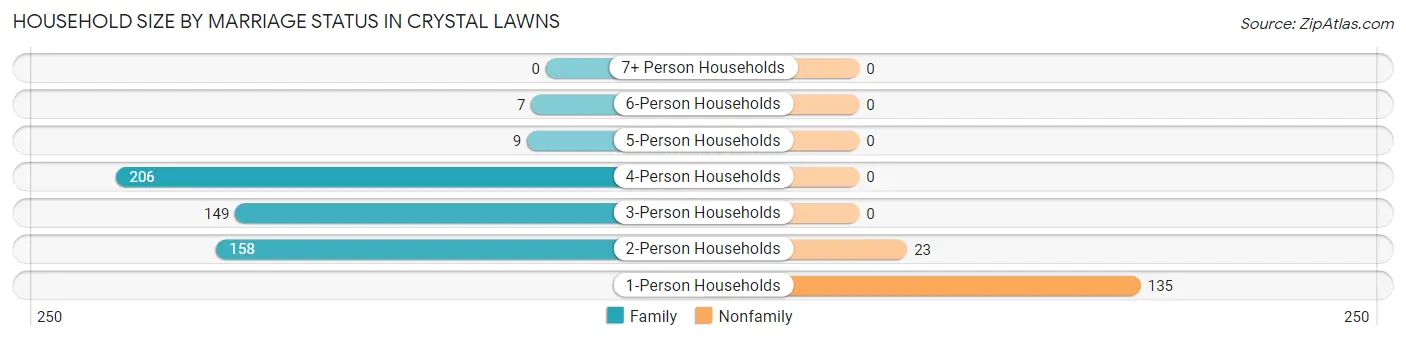
| Household Size | Family Households | Nonfamily Households |
| 1-Person Households | - | 135 (19.7%) |
| 2-Person Households | 158 (23.0%) | 23 (3.4%) |
| 3-Person Households | 149 (21.7%) | 0 (0.0%) |
| 4-Person Households | 206 (30.0%) | 0 (0.0%) |
| 5-Person Households | 9 (1.3%) | 0 (0.0%) |
| 6-Person Households | 7 (1.0%) | 0 (0.0%) |
| 7+ Person Households | 0 (0.0%) | 0 (0.0%) |
| Total | 529 (77.0%) | 158 (23.0%) |
Female Fertility in Crystal Lawns
Fertility by Age in Crystal Lawns
Average fertility rate in Crystal Lawns is 17.0 births per 1,000 women. Women in the age bracket of 20 to 34 years have the highest fertility rate with 54.0 births per 1,000 women. Women in the age bracket of 20 to 34 years acount for 100.0% of all women with births.
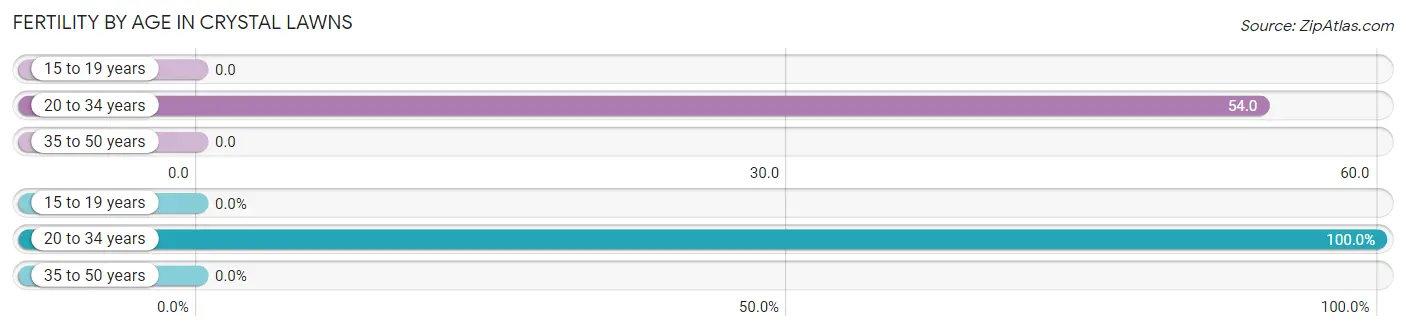
| Age Bracket | Women with Births | Births / 1,000 Women |
| 15 to 19 years | 0 (0.0%) | 0.0 |
| 20 to 34 years | 8 (100.0%) | 54.0 |
| 35 to 50 years | 0 (0.0%) | 0.0 |
| Total | 8 (100.0%) | 17.0 |
Fertility by Age by Marriage Status in Crystal Lawns
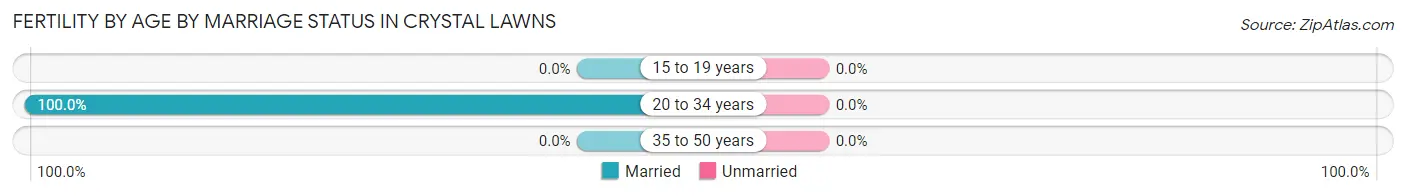
| Age Bracket | Married | Unmarried |
| 15 to 19 years | 0 (0.0%) | 0 (0.0%) |
| 20 to 34 years | 8 (100.0%) | 0 (0.0%) |
| 35 to 50 years | 0 (0.0%) | 0 (0.0%) |
| Total | 8 (100.0%) | 0 (0.0%) |
Fertility by Education in Crystal Lawns
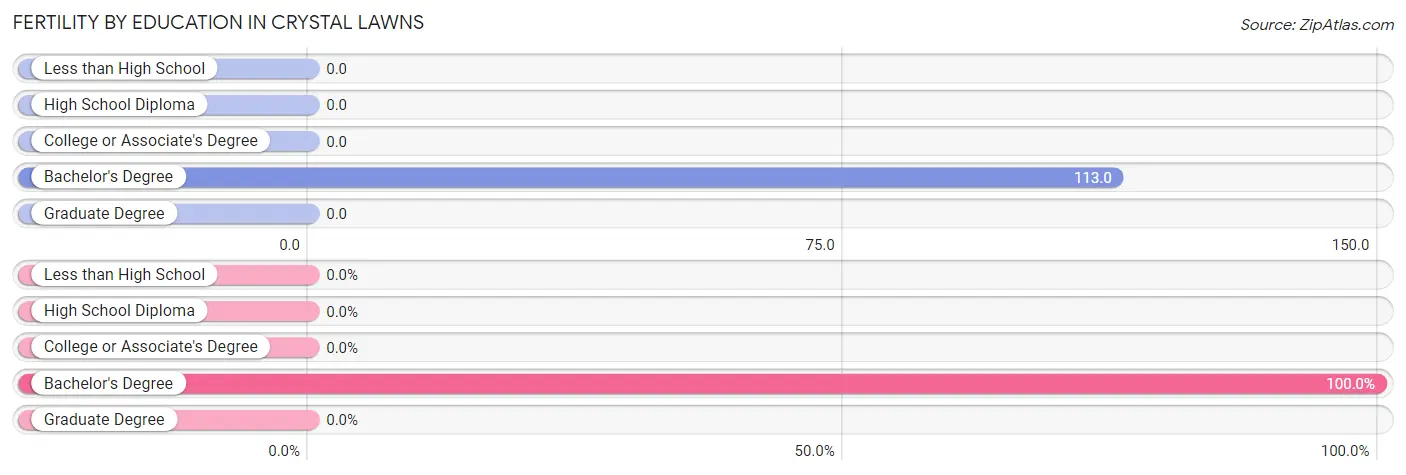
| Educational Attainment | Women with Births | Births / 1,000 Women |
| Less than High School | 0 (0.0%) | 0.0 |
| High School Diploma | 0 (0.0%) | 0.0 |
| College or Associate's Degree | 0 (0.0%) | 0.0 |
| Bachelor's Degree | 8 (100.0%) | 113.0 |
| Graduate Degree | 0 (0.0%) | 0.0 |
| Total | 8 (100.0%) | 17.0 |
Fertility by Education by Marriage Status in Crystal Lawns
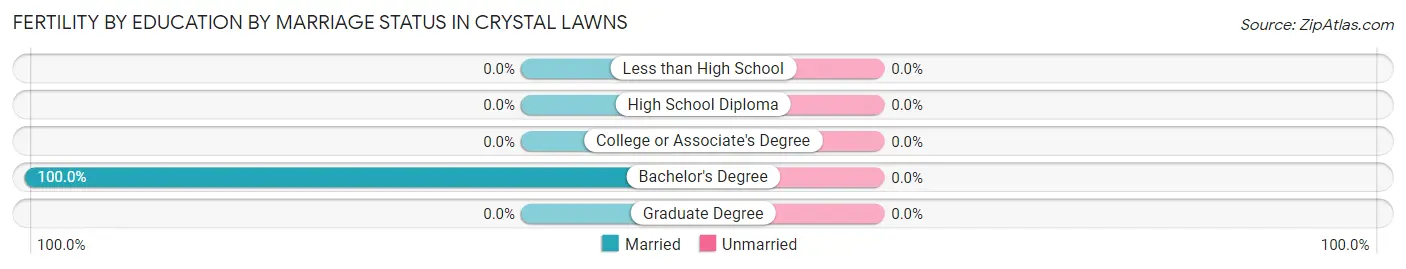
| Educational Attainment | Married | Unmarried |
| Less than High School | 0 (0.0%) | 0 (0.0%) |
| High School Diploma | 0 (0.0%) | 0 (0.0%) |
| College or Associate's Degree | 0 (0.0%) | 0 (0.0%) |
| Bachelor's Degree | 8 (100.0%) | 0 (0.0%) |
| Graduate Degree | 0 (0.0%) | 0 (0.0%) |
| Total | 8 (100.0%) | 0 (0.0%) |
Employment Characteristics in Crystal Lawns
Employment by Class of Employer in Crystal Lawns
Among the 1,183 employed individuals in Crystal Lawns, private company employees (970 | 82.0%), local government employees (68 | 5.8%), and not-for-profit organizations (66 | 5.6%) make up the most common classes of employment.
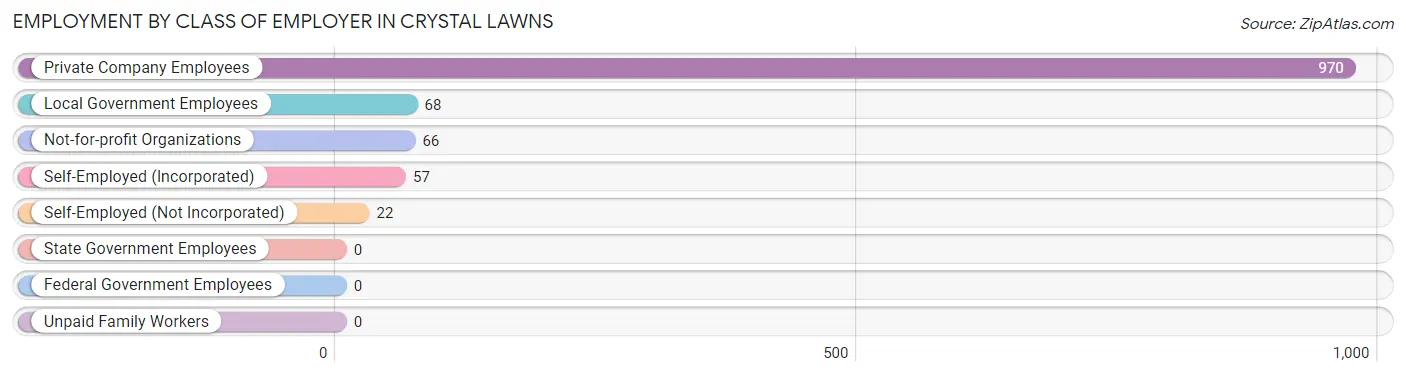
| Employer Class | # Employees | % Employees |
| Private Company Employees | 970 | 82.0% |
| Self-Employed (Incorporated) | 57 | 4.8% |
| Self-Employed (Not Incorporated) | 22 | 1.9% |
| Not-for-profit Organizations | 66 | 5.6% |
| Local Government Employees | 68 | 5.8% |
| State Government Employees | 0 | 0.0% |
| Federal Government Employees | 0 | 0.0% |
| Unpaid Family Workers | 0 | 0.0% |
| Total | 1,183 | 100.0% |
Employment Status by Age in Crystal Lawns
According to the labor force statistics for Crystal Lawns, out of the total population over 16 years of age (1,557), 79.4% or 1,236 individuals are in the labor force, with 4.4% or 54 of them unemployed. The age group with the highest labor force participation rate is 16 to 19 years, with 100.0% or 55 individuals in the labor force. Within the labor force, the 20 to 24 years age range has the highest percentage of unemployed individuals, with 10.3% or 16 of them being unemployed.
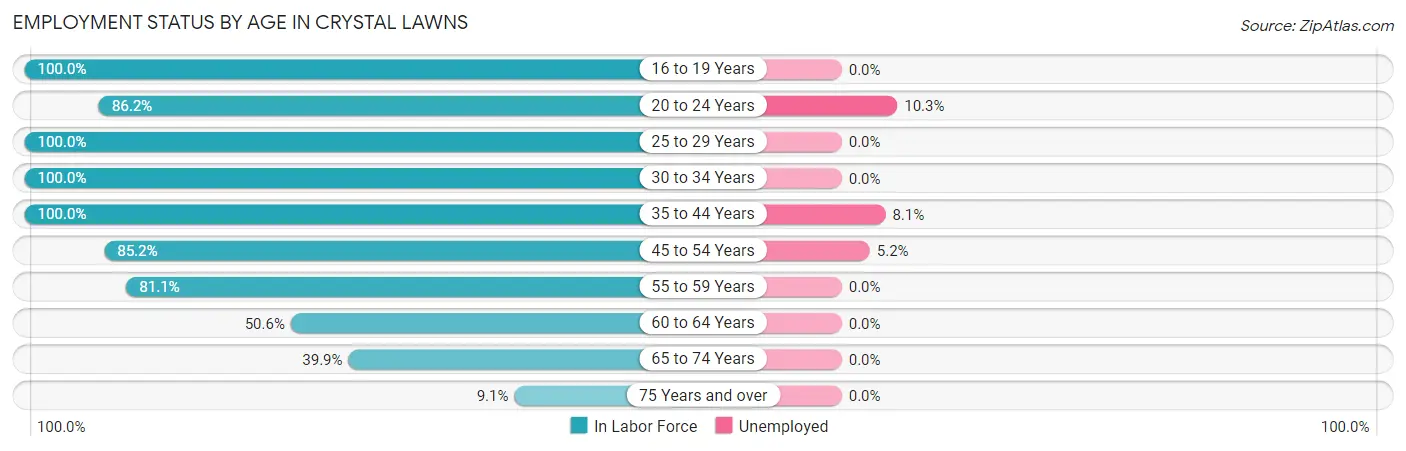
| Age Bracket | In Labor Force | Unemployed |
| 16 to 19 Years | 55 (100.0%) | 0 (0.0%) |
| 20 to 24 Years | 156 (86.2%) | 16 (10.3%) |
| 25 to 29 Years | 224 (100.0%) | 0 (0.0%) |
| 30 to 34 Years | 55 (100.0%) | 0 (0.0%) |
| 35 to 44 Years | 321 (100.0%) | 26 (8.1%) |
| 45 to 54 Years | 230 (85.2%) | 12 (5.2%) |
| 55 to 59 Years | 30 (81.1%) | 0 (0.0%) |
| 60 to 64 Years | 84 (50.6%) | 0 (0.0%) |
| 65 to 74 Years | 77 (39.9%) | 0 (0.0%) |
| 75 Years and over | 5 (9.1%) | 0 (0.0%) |
| Total | 1,236 (79.4%) | 54 (4.4%) |
Employment Status by Educational Attainment in Crystal Lawns
According to labor force statistics for Crystal Lawns, 88.0% of individuals (944) out of the total population between 25 and 64 years of age (1,073) are in the labor force, with 4.0% or 38 of them being unemployed. The group with the highest labor force participation rate are those with the educational attainment of bachelor's degree or higher, with 100.0% or 232 individuals in the labor force. Within the labor force, individuals with bachelor's degree or higher education have the highest percentage of unemployment, with 5.2% or 12 of them being unemployed.
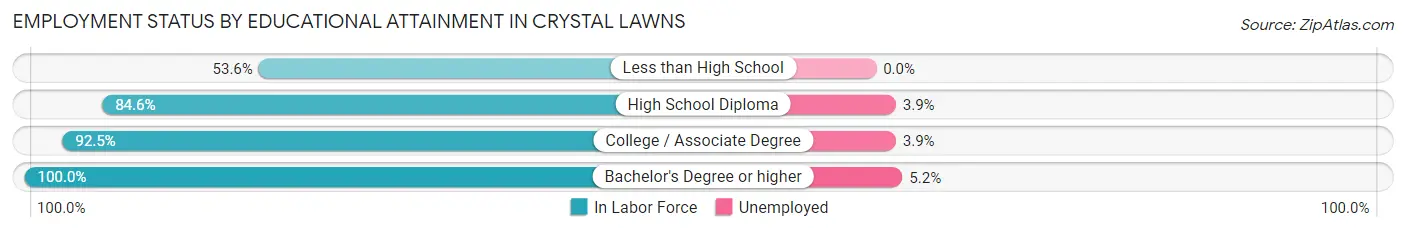
| Educational Attainment | In Labor Force | Unemployed |
| Less than High School | 45 (53.6%) | 0 (0.0%) |
| High School Diploma | 357 (84.6%) | 16 (3.9%) |
| College / Associate Degree | 310 (92.5%) | 13 (3.9%) |
| Bachelor's Degree or higher | 232 (100.0%) | 12 (5.2%) |
| Total | 944 (88.0%) | 43 (4.0%) |
Employment Occupations by Sex in Crystal Lawns
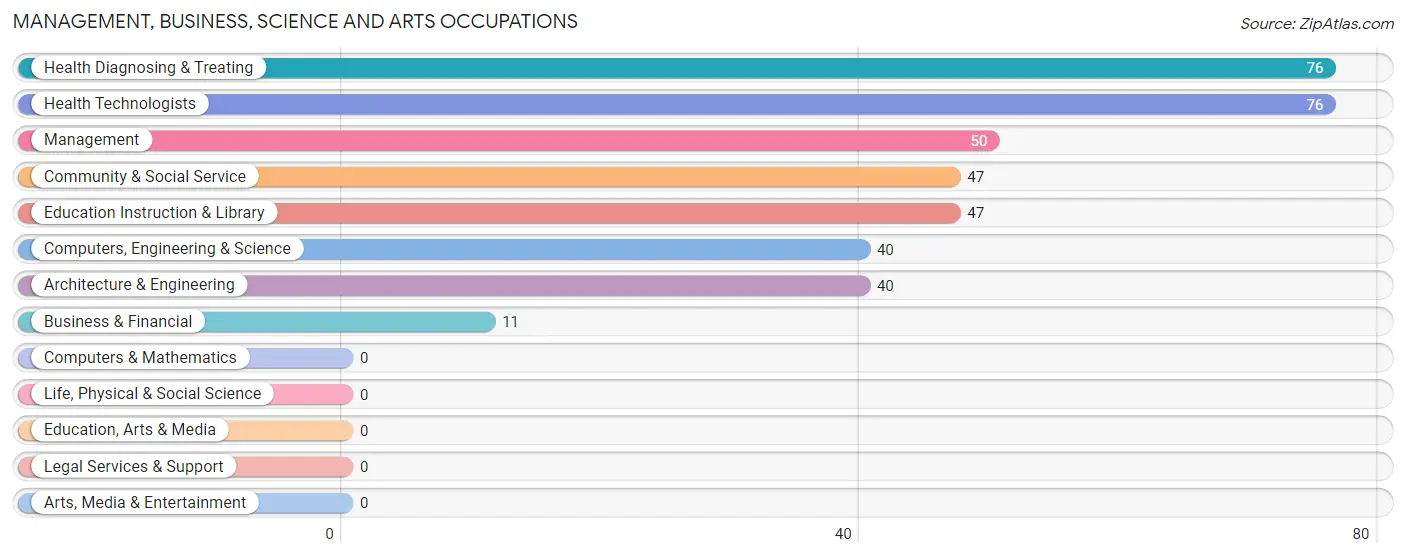
Management, Business, Science and Arts Occupations
The most common Management, Business, Science and Arts occupations in Crystal Lawns are Health Diagnosing & Treating (76 | 6.4%), Health Technologists (76 | 6.4%), Management (50 | 4.2%), Community & Social Service (47 | 4.0%), and Education Instruction & Library (47 | 4.0%).
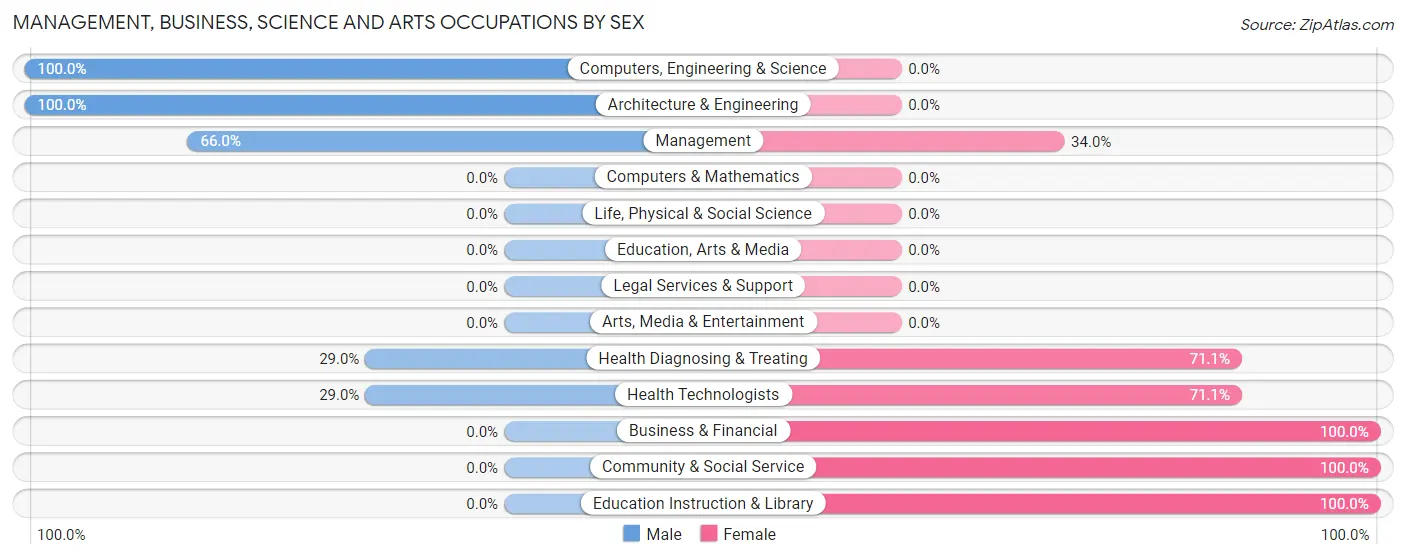
Management, Business, Science and Arts Occupations by Sex
Within the Management, Business, Science and Arts occupations in Crystal Lawns, the most male-oriented occupations are Computers, Engineering & Science (100.0%), Architecture & Engineering (100.0%), and Management (66.0%), while the most female-oriented occupations are Business & Financial (100.0%), Community & Social Service (100.0%), and Education Instruction & Library (100.0%).
| Occupation | Male | Female |
| Management | 33 (66.0%) | 17 (34.0%) |
| Business & Financial | 0 (0.0%) | 11 (100.0%) |
| Computers, Engineering & Science | 40 (100.0%) | 0 (0.0%) |
| Computers & Mathematics | 0 (0.0%) | 0 (0.0%) |
| Architecture & Engineering | 40 (100.0%) | 0 (0.0%) |
| Life, Physical & Social Science | 0 (0.0%) | 0 (0.0%) |
| Community & Social Service | 0 (0.0%) | 47 (100.0%) |
| Education, Arts & Media | 0 (0.0%) | 0 (0.0%) |
| Legal Services & Support | 0 (0.0%) | 0 (0.0%) |
| Education Instruction & Library | 0 (0.0%) | 47 (100.0%) |
| Arts, Media & Entertainment | 0 (0.0%) | 0 (0.0%) |
| Health Diagnosing & Treating | 22 (28.9%) | 54 (71.1%) |
| Health Technologists | 22 (28.9%) | 54 (71.1%) |
| Total (Category) | 95 (42.4%) | 129 (57.6%) |
| Total (Overall) | 747 (63.1%) | 436 (36.9%) |
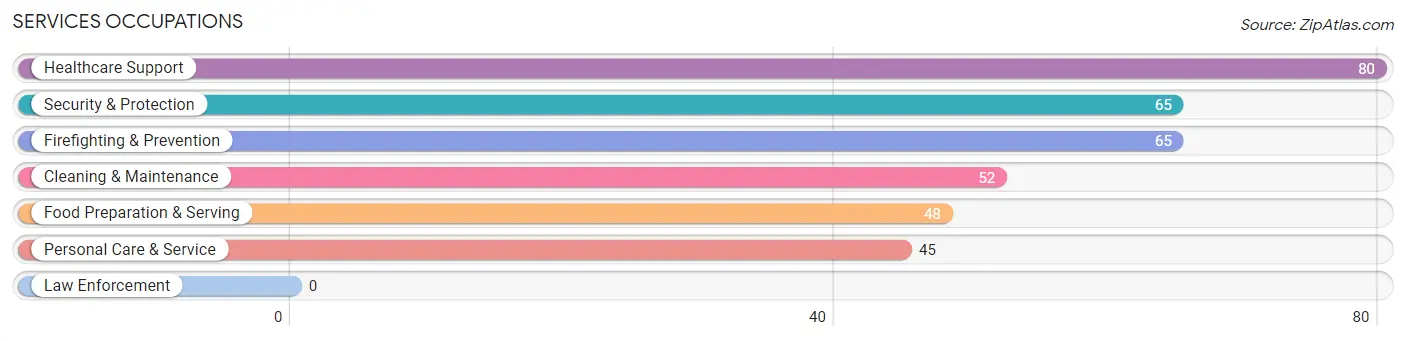
Services Occupations
The most common Services occupations in Crystal Lawns are Healthcare Support (80 | 6.8%), Security & Protection (65 | 5.5%), Firefighting & Prevention (65 | 5.5%), Cleaning & Maintenance (52 | 4.4%), and Food Preparation & Serving (48 | 4.1%).
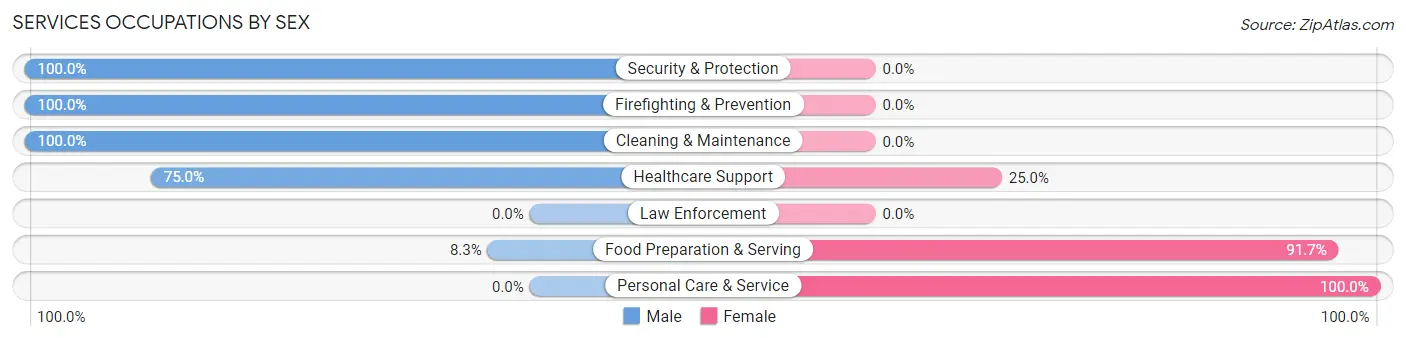
Services Occupations by Sex
Within the Services occupations in Crystal Lawns, the most male-oriented occupations are Security & Protection (100.0%), Firefighting & Prevention (100.0%), and Cleaning & Maintenance (100.0%), while the most female-oriented occupations are Personal Care & Service (100.0%), Food Preparation & Serving (91.7%), and Healthcare Support (25.0%).
| Occupation | Male | Female |
| Healthcare Support | 60 (75.0%) | 20 (25.0%) |
| Security & Protection | 65 (100.0%) | 0 (0.0%) |
| Firefighting & Prevention | 65 (100.0%) | 0 (0.0%) |
| Law Enforcement | 0 (0.0%) | 0 (0.0%) |
| Food Preparation & Serving | 4 (8.3%) | 44 (91.7%) |
| Cleaning & Maintenance | 52 (100.0%) | 0 (0.0%) |
| Personal Care & Service | 0 (0.0%) | 45 (100.0%) |
| Total (Category) | 181 (62.4%) | 109 (37.6%) |
| Total (Overall) | 747 (63.1%) | 436 (36.9%) |
Sales and Office Occupations
The most common Sales and Office occupations in Crystal Lawns are Office & Administration (222 | 18.8%), and Sales & Related (110 | 9.3%).
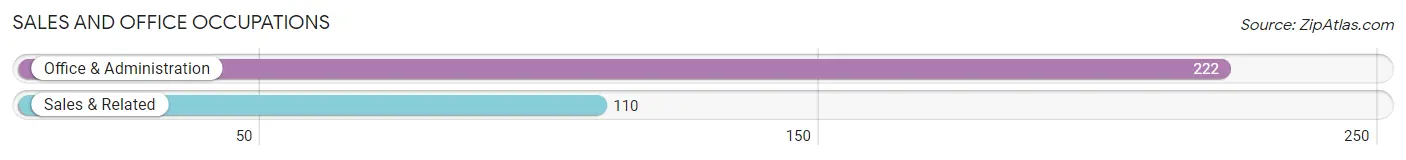
Sales and Office Occupations by Sex
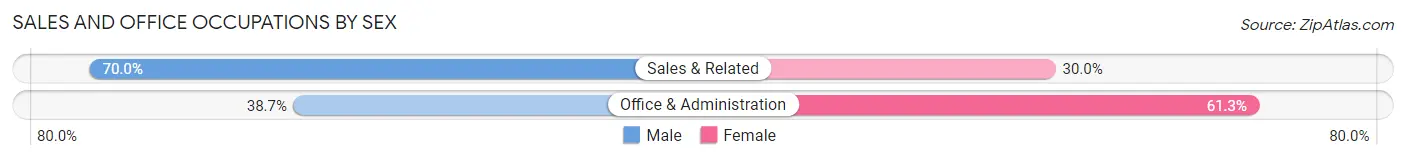
| Occupation | Male | Female |
| Sales & Related | 77 (70.0%) | 33 (30.0%) |
| Office & Administration | 86 (38.7%) | 136 (61.3%) |
| Total (Category) | 163 (49.1%) | 169 (50.9%) |
| Total (Overall) | 747 (63.1%) | 436 (36.9%) |
Natural Resources, Construction and Maintenance Occupations
The most common Natural Resources, Construction and Maintenance occupations in Crystal Lawns are Construction & Extraction (107 | 9.0%), and Installation, Maintenance & Repair (90 | 7.6%).
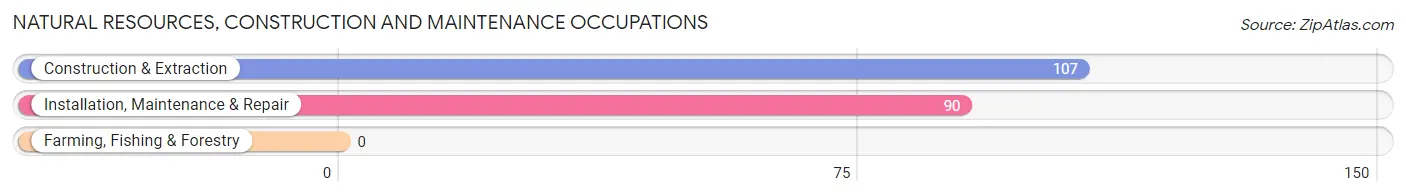
Natural Resources, Construction and Maintenance Occupations by Sex
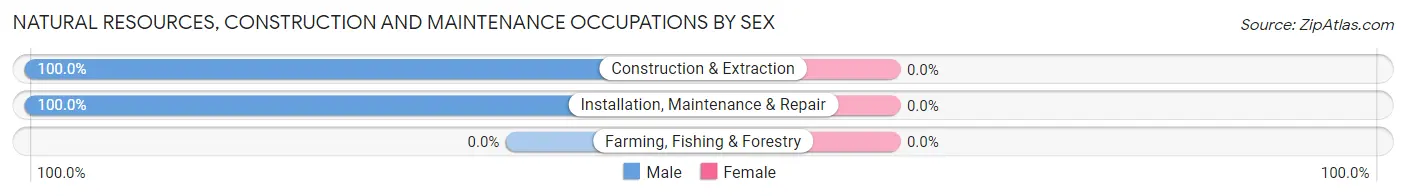
| Occupation | Male | Female |
| Farming, Fishing & Forestry | 0 (0.0%) | 0 (0.0%) |
| Construction & Extraction | 107 (100.0%) | 0 (0.0%) |
| Installation, Maintenance & Repair | 90 (100.0%) | 0 (0.0%) |
| Total (Category) | 197 (100.0%) | 0 (0.0%) |
| Total (Overall) | 747 (63.1%) | 436 (36.9%) |
Production, Transportation and Moving Occupations
The most common Production, Transportation and Moving occupations in Crystal Lawns are Production (100 | 8.5%), and Transportation (40 | 3.4%).
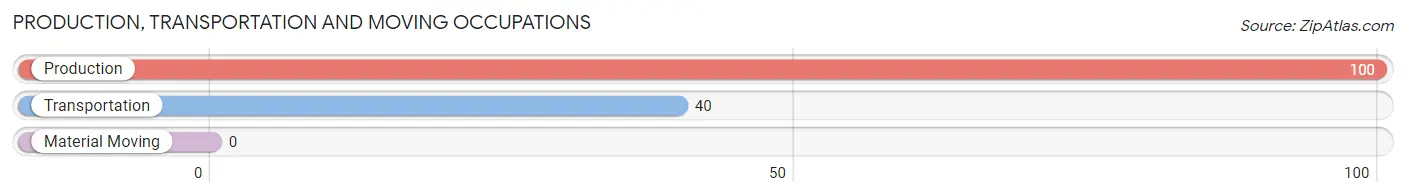
Production, Transportation and Moving Occupations by Sex
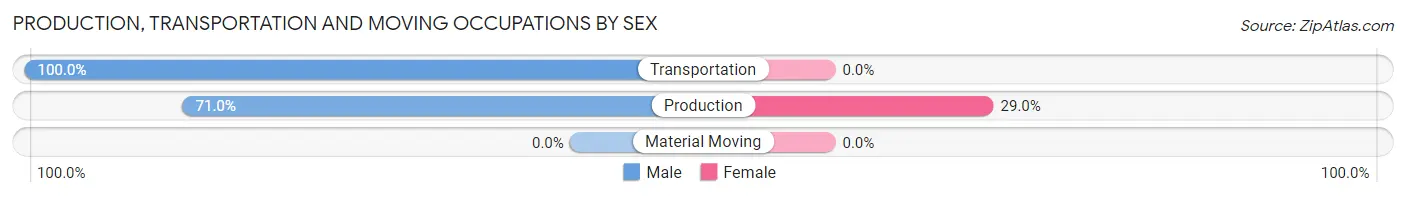
| Occupation | Male | Female |
| Production | 71 (71.0%) | 29 (29.0%) |
| Transportation | 40 (100.0%) | 0 (0.0%) |
| Material Moving | 0 (0.0%) | 0 (0.0%) |
| Total (Category) | 111 (79.3%) | 29 (20.7%) |
| Total (Overall) | 747 (63.1%) | 436 (36.9%) |
Employment Industries by Sex in Crystal Lawns
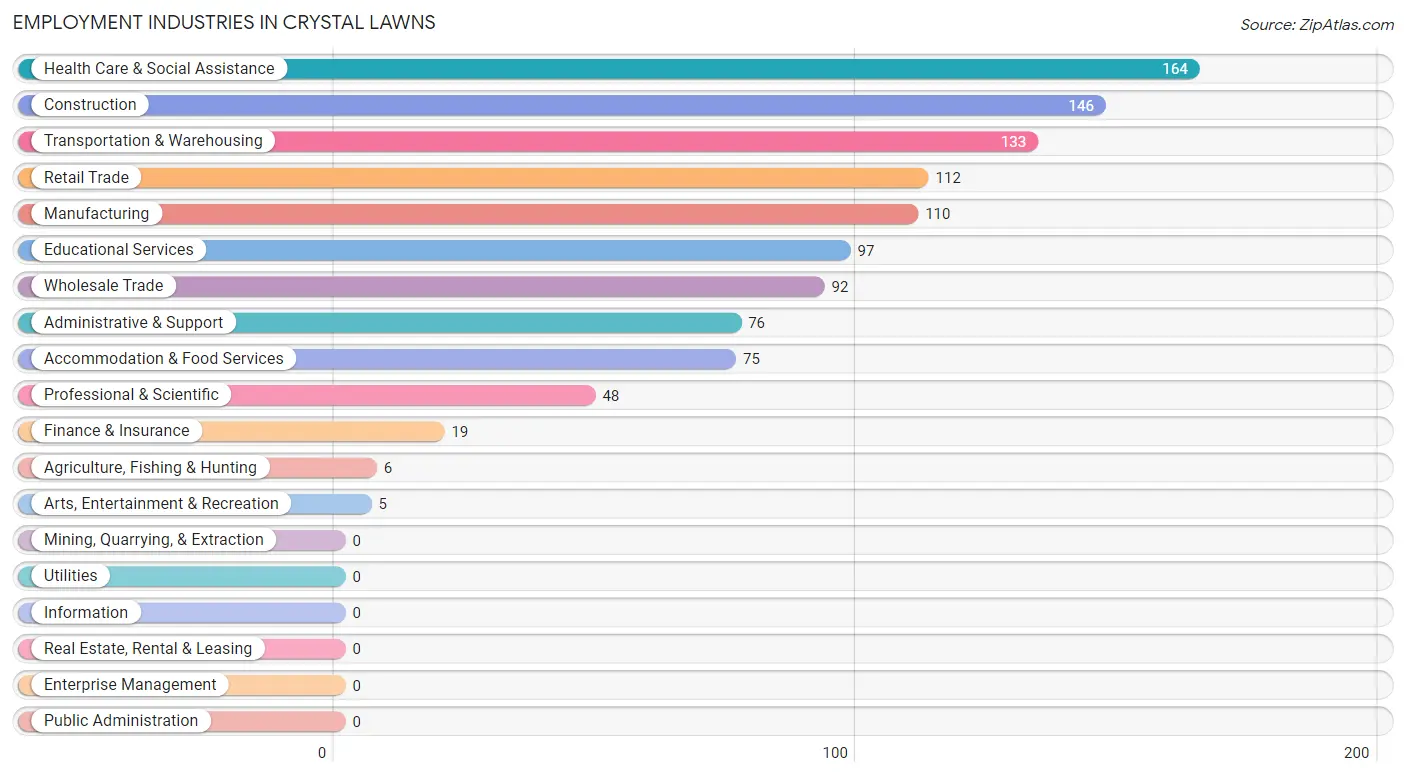
Employment Industries in Crystal Lawns
The major employment industries in Crystal Lawns include Health Care & Social Assistance (164 | 13.9%), Construction (146 | 12.3%), Transportation & Warehousing (133 | 11.2%), Retail Trade (112 | 9.5%), and Manufacturing (110 | 9.3%).
Employment Industries by Sex in Crystal Lawns
The Crystal Lawns industries that see more men than women are Wholesale Trade (100.0%), Administrative & Support (100.0%), and Arts, Entertainment & Recreation (100.0%), whereas the industries that tend to have a higher number of women are Agriculture, Fishing & Hunting (100.0%), Finance & Insurance (100.0%), and Educational Services (89.7%).
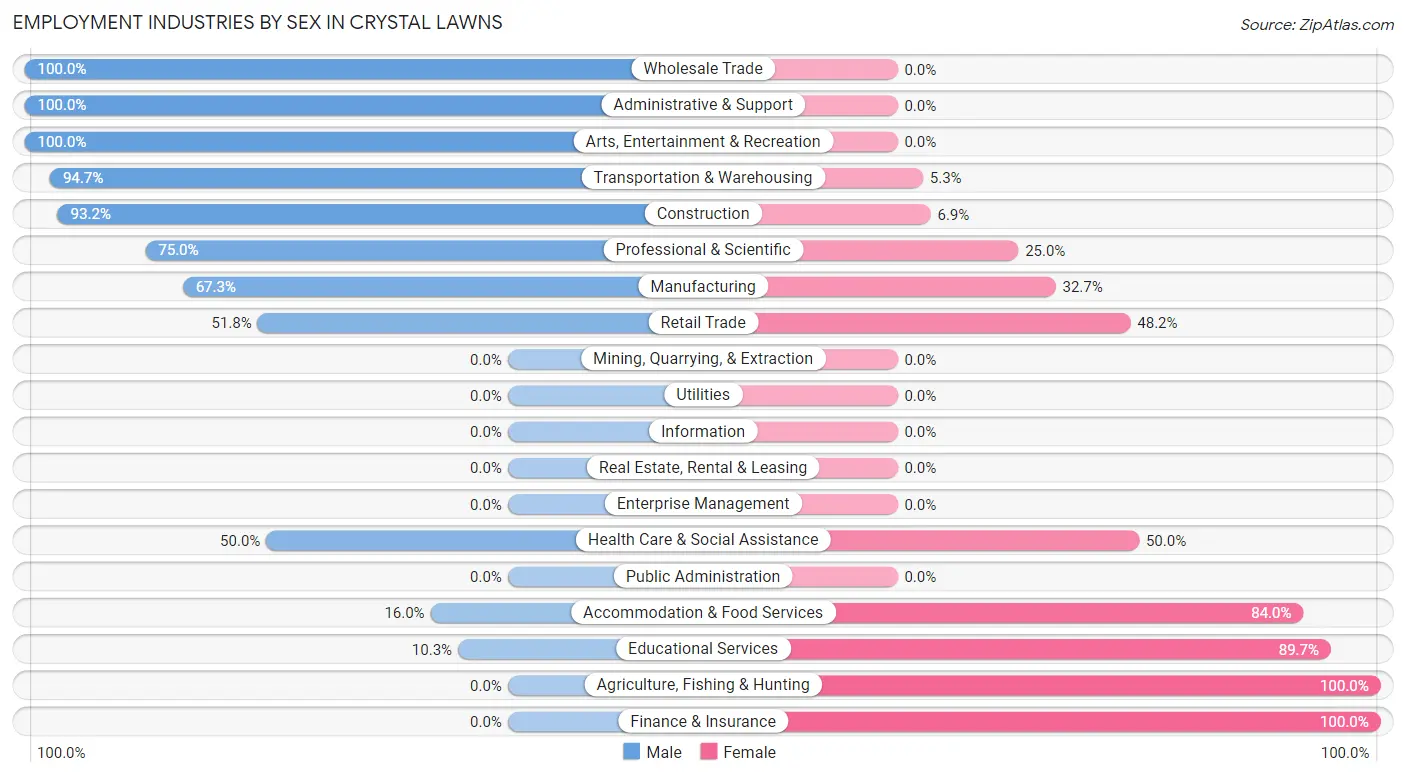
| Industry | Male | Female |
| Agriculture, Fishing & Hunting | 0 (0.0%) | 6 (100.0%) |
| Mining, Quarrying, & Extraction | 0 (0.0%) | 0 (0.0%) |
| Construction | 136 (93.1%) | 10 (6.9%) |
| Manufacturing | 74 (67.3%) | 36 (32.7%) |
| Wholesale Trade | 92 (100.0%) | 0 (0.0%) |
| Retail Trade | 58 (51.8%) | 54 (48.2%) |
| Transportation & Warehousing | 126 (94.7%) | 7 (5.3%) |
| Utilities | 0 (0.0%) | 0 (0.0%) |
| Information | 0 (0.0%) | 0 (0.0%) |
| Finance & Insurance | 0 (0.0%) | 19 (100.0%) |
| Real Estate, Rental & Leasing | 0 (0.0%) | 0 (0.0%) |
| Professional & Scientific | 36 (75.0%) | 12 (25.0%) |
| Enterprise Management | 0 (0.0%) | 0 (0.0%) |
| Administrative & Support | 76 (100.0%) | 0 (0.0%) |
| Educational Services | 10 (10.3%) | 87 (89.7%) |
| Health Care & Social Assistance | 82 (50.0%) | 82 (50.0%) |
| Arts, Entertainment & Recreation | 5 (100.0%) | 0 (0.0%) |
| Accommodation & Food Services | 12 (16.0%) | 63 (84.0%) |
| Public Administration | 0 (0.0%) | 0 (0.0%) |
| Total | 747 (63.1%) | 436 (36.9%) |
Education in Crystal Lawns
School Enrollment in Crystal Lawns
The most common levels of schooling among the 417 students in Crystal Lawns are college / undergraduate (154 | 36.9%), high school (84 | 20.1%), and nursery / preschool (55 | 13.2%).
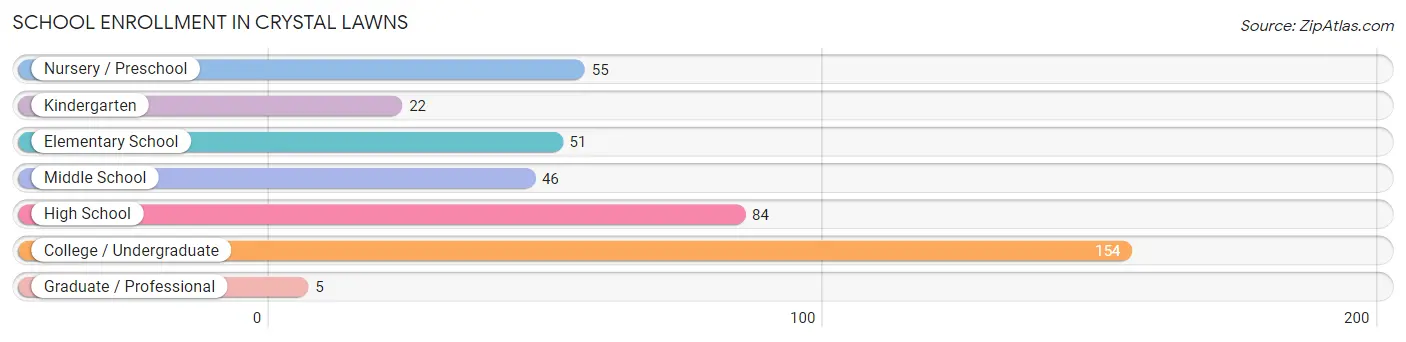
| School Level | # Students | % Students |
| Nursery / Preschool | 55 | 13.2% |
| Kindergarten | 22 | 5.3% |
| Elementary School | 51 | 12.2% |
| Middle School | 46 | 11.0% |
| High School | 84 | 20.1% |
| College / Undergraduate | 154 | 36.9% |
| Graduate / Professional | 5 | 1.2% |
| Total | 417 | 100.0% |
School Enrollment by Age by Funding Source in Crystal Lawns
Out of a total of 417 students who are enrolled in schools in Crystal Lawns, 50 (12.0%) attend a private institution, while the remaining 367 (88.0%) are enrolled in public schools. The age group of 3 to 4 year olds has the highest likelihood of being enrolled in private schools, with 11 (100.0% in the age bracket) enrolled. Conversely, the age group of 10 to 14 year olds has the lowest likelihood of being enrolled in a private school, with 57 (100.0% in the age bracket) attending a public institution.
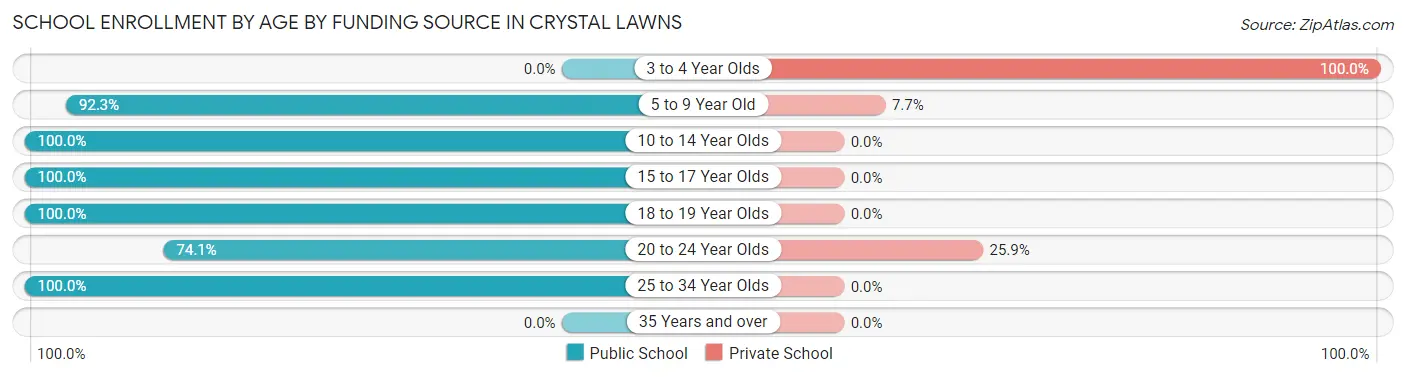
| Age Bracket | Public School | Private School |
| 3 to 4 Year Olds | 0 (0.0%) | 11 (100.0%) |
| 5 to 9 Year Old | 108 (92.3%) | 9 (7.7%) |
| 10 to 14 Year Olds | 57 (100.0%) | 0 (0.0%) |
| 15 to 17 Year Olds | 73 (100.0%) | 0 (0.0%) |
| 18 to 19 Year Olds | 9 (100.0%) | 0 (0.0%) |
| 20 to 24 Year Olds | 86 (74.1%) | 30 (25.9%) |
| 25 to 34 Year Olds | 34 (100.0%) | 0 (0.0%) |
| 35 Years and over | 0 (0.0%) | 0 (0.0%) |
| Total | 367 (88.0%) | 50 (12.0%) |
Educational Attainment by Field of Study in Crystal Lawns
Science & technology (91 | 26.1%), arts & humanities (65 | 18.6%), business (43 | 12.3%), education (38 | 10.9%), and visual & performing arts (34 | 9.7%) are the most common fields of study among 349 individuals in Crystal Lawns who have obtained a bachelor's degree or higher.
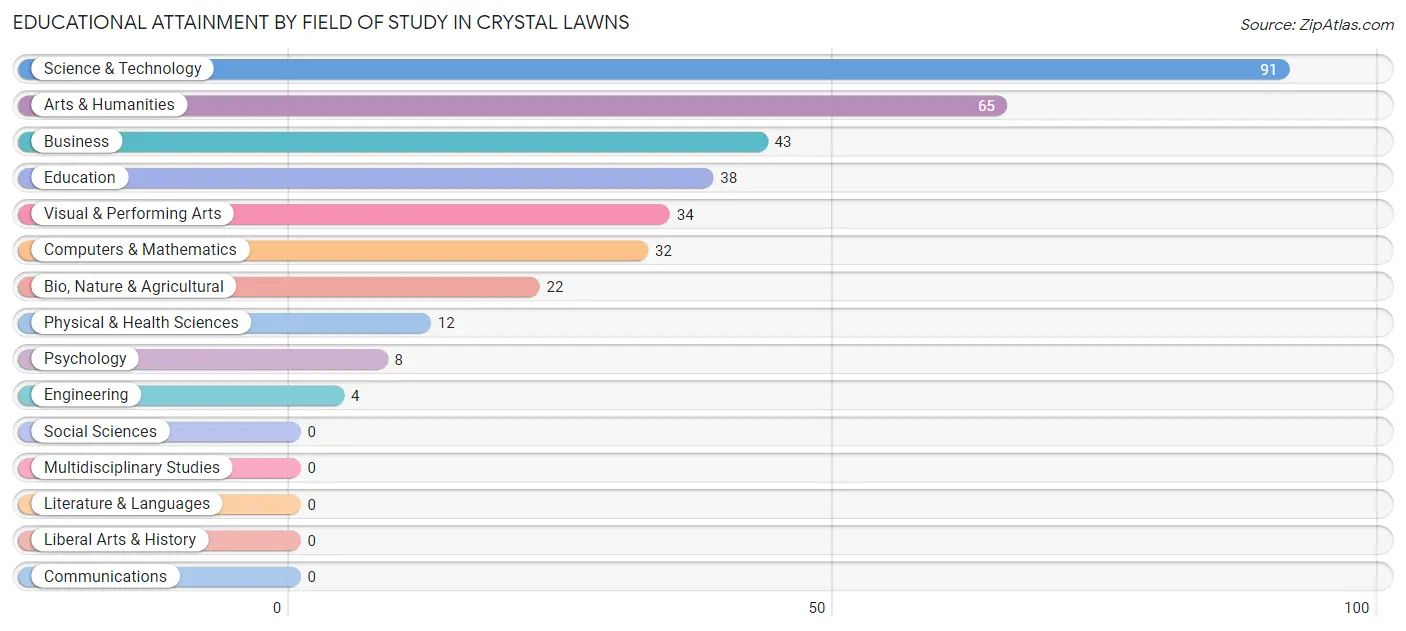
| Field of Study | # Graduates | % Graduates |
| Computers & Mathematics | 32 | 9.2% |
| Bio, Nature & Agricultural | 22 | 6.3% |
| Physical & Health Sciences | 12 | 3.4% |
| Psychology | 8 | 2.3% |
| Social Sciences | 0 | 0.0% |
| Engineering | 4 | 1.1% |
| Multidisciplinary Studies | 0 | 0.0% |
| Science & Technology | 91 | 26.1% |
| Business | 43 | 12.3% |
| Education | 38 | 10.9% |
| Literature & Languages | 0 | 0.0% |
| Liberal Arts & History | 0 | 0.0% |
| Visual & Performing Arts | 34 | 9.7% |
| Communications | 0 | 0.0% |
| Arts & Humanities | 65 | 18.6% |
| Total | 349 | 100.0% |
Transportation & Commute in Crystal Lawns
Vehicle Availability by Sex in Crystal Lawns
The most prevalent vehicle ownership categories in Crystal Lawns are males with 3 vehicles (272, accounting for 36.6%) and females with 3 vehicles (264, making up 62.4%).
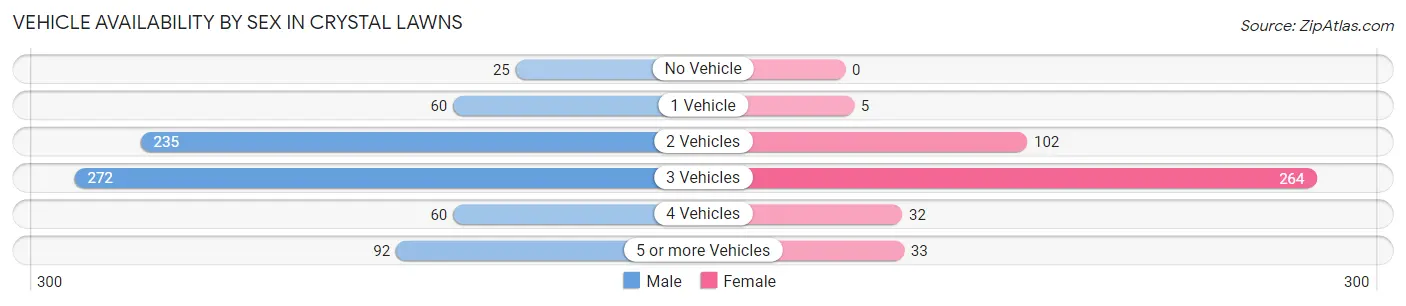
| Vehicles Available | Male | Female |
| No Vehicle | 25 (3.4%) | 0 (0.0%) |
| 1 Vehicle | 60 (8.1%) | 5 (1.1%) |
| 2 Vehicles | 235 (31.6%) | 102 (23.4%) |
| 3 Vehicles | 272 (36.6%) | 264 (60.6%) |
| 4 Vehicles | 60 (8.1%) | 32 (7.3%) |
| 5 or more Vehicles | 92 (12.4%) | 33 (7.6%) |
| Total | 744 (100.0%) | 436 (100.0%) |
Commute Time in Crystal Lawns
The most frequently occuring commute durations in Crystal Lawns are 10 to 14 minutes (239 commuters, 20.4%), 15 to 19 minutes (231 commuters, 19.7%), and 20 to 24 minutes (143 commuters, 12.2%).
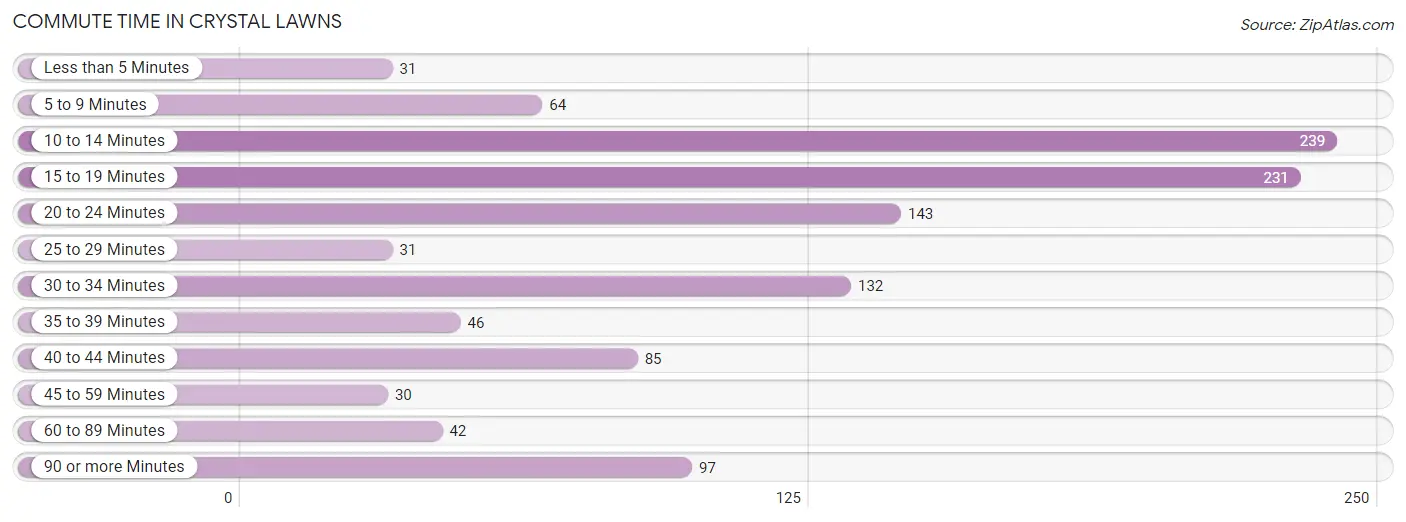
| Commute Time | # Commuters | % Commuters |
| Less than 5 Minutes | 31 | 2.6% |
| 5 to 9 Minutes | 64 | 5.5% |
| 10 to 14 Minutes | 239 | 20.4% |
| 15 to 19 Minutes | 231 | 19.7% |
| 20 to 24 Minutes | 143 | 12.2% |
| 25 to 29 Minutes | 31 | 2.6% |
| 30 to 34 Minutes | 132 | 11.3% |
| 35 to 39 Minutes | 46 | 3.9% |
| 40 to 44 Minutes | 85 | 7.3% |
| 45 to 59 Minutes | 30 | 2.6% |
| 60 to 89 Minutes | 42 | 3.6% |
| 90 or more Minutes | 97 | 8.3% |
Commute Time by Sex in Crystal Lawns
The most common commute times in Crystal Lawns are 10 to 14 minutes (165 commuters, 22.1%) for males and 15 to 19 minutes (131 commuters, 30.9%) for females.
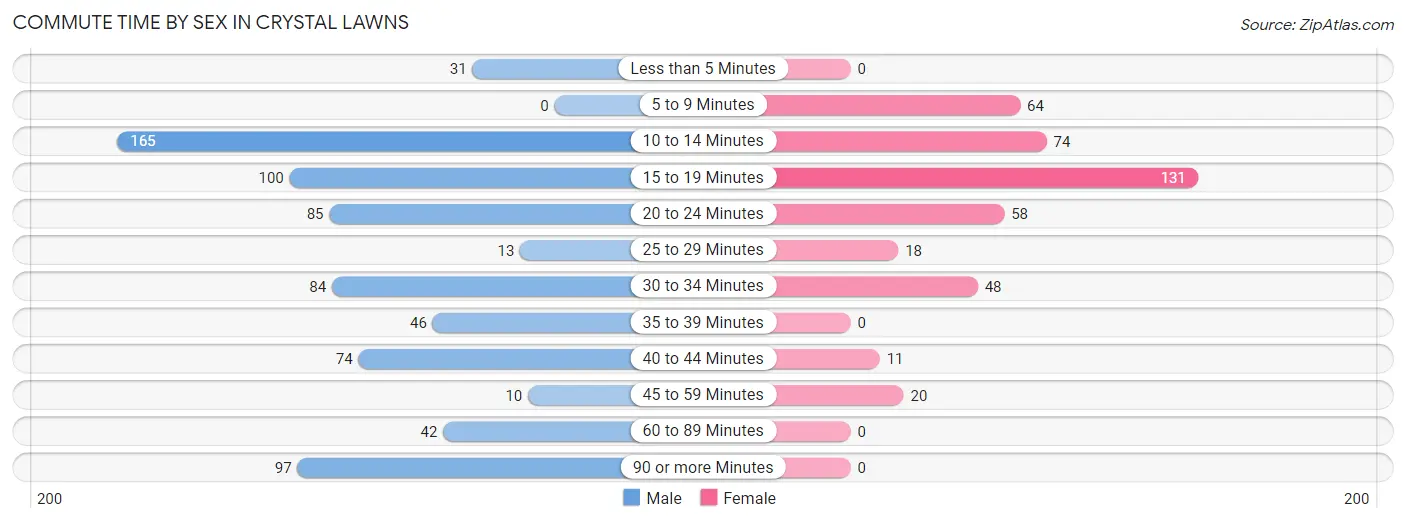
| Commute Time | Male | Female |
| Less than 5 Minutes | 31 (4.2%) | 0 (0.0%) |
| 5 to 9 Minutes | 0 (0.0%) | 64 (15.1%) |
| 10 to 14 Minutes | 165 (22.1%) | 74 (17.4%) |
| 15 to 19 Minutes | 100 (13.4%) | 131 (30.9%) |
| 20 to 24 Minutes | 85 (11.4%) | 58 (13.7%) |
| 25 to 29 Minutes | 13 (1.7%) | 18 (4.3%) |
| 30 to 34 Minutes | 84 (11.2%) | 48 (11.3%) |
| 35 to 39 Minutes | 46 (6.2%) | 0 (0.0%) |
| 40 to 44 Minutes | 74 (9.9%) | 11 (2.6%) |
| 45 to 59 Minutes | 10 (1.3%) | 20 (4.7%) |
| 60 to 89 Minutes | 42 (5.6%) | 0 (0.0%) |
| 90 or more Minutes | 97 (13.0%) | 0 (0.0%) |
Time of Departure to Work by Sex in Crystal Lawns
The most frequent times of departure to work in Crystal Lawns are 6:30 AM to 6:59 AM (211, 28.2%) for males and 7:30 AM to 7:59 AM (82, 19.3%) for females.
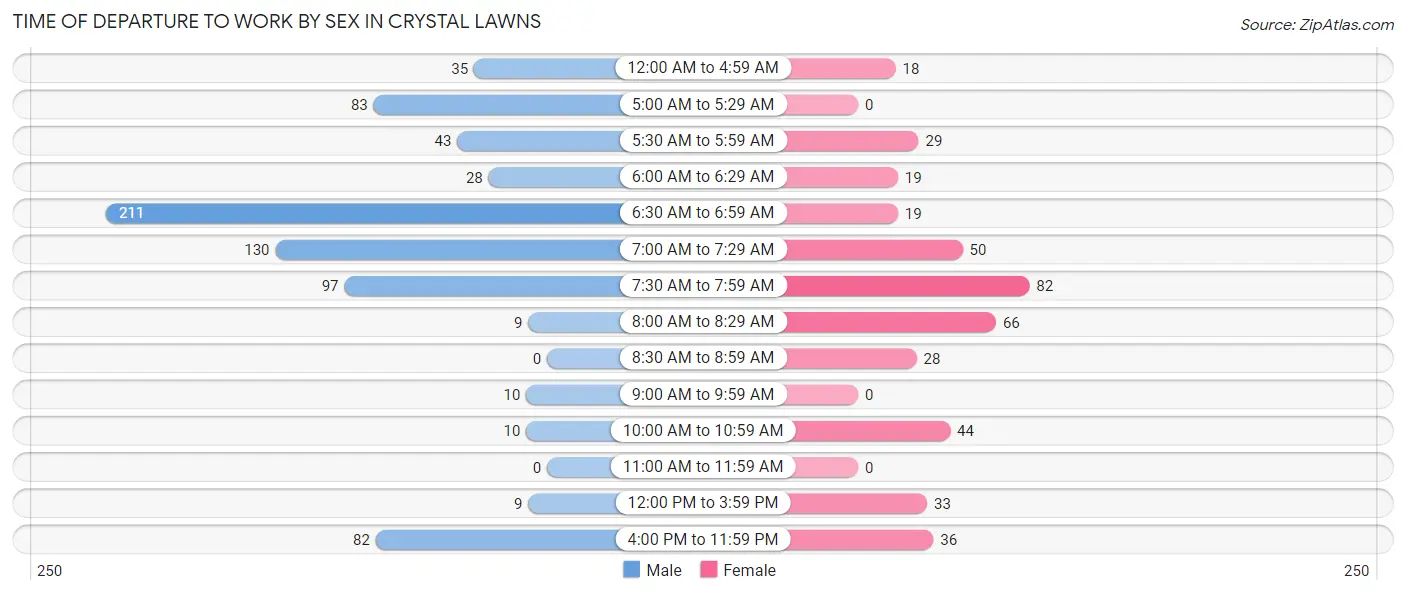
| Time of Departure | Male | Female |
| 12:00 AM to 4:59 AM | 35 (4.7%) | 18 (4.3%) |
| 5:00 AM to 5:29 AM | 83 (11.1%) | 0 (0.0%) |
| 5:30 AM to 5:59 AM | 43 (5.8%) | 29 (6.8%) |
| 6:00 AM to 6:29 AM | 28 (3.7%) | 19 (4.5%) |
| 6:30 AM to 6:59 AM | 211 (28.2%) | 19 (4.5%) |
| 7:00 AM to 7:29 AM | 130 (17.4%) | 50 (11.8%) |
| 7:30 AM to 7:59 AM | 97 (13.0%) | 82 (19.3%) |
| 8:00 AM to 8:29 AM | 9 (1.2%) | 66 (15.6%) |
| 8:30 AM to 8:59 AM | 0 (0.0%) | 28 (6.6%) |
| 9:00 AM to 9:59 AM | 10 (1.3%) | 0 (0.0%) |
| 10:00 AM to 10:59 AM | 10 (1.3%) | 44 (10.4%) |
| 11:00 AM to 11:59 AM | 0 (0.0%) | 0 (0.0%) |
| 12:00 PM to 3:59 PM | 9 (1.2%) | 33 (7.8%) |
| 4:00 PM to 11:59 PM | 82 (11.0%) | 36 (8.5%) |
| Total | 747 (100.0%) | 424 (100.0%) |
Housing Occupancy in Crystal Lawns
Occupancy by Ownership in Crystal Lawns
Of the total 687 dwellings in Crystal Lawns, owner-occupied units account for 642 (93.4%), while renter-occupied units make up 45 (6.6%).
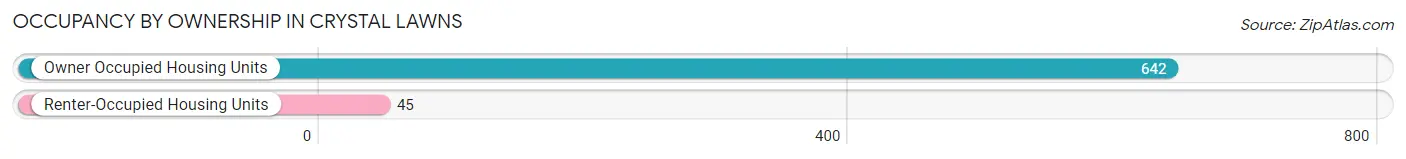
| Occupancy | # Housing Units | % Housing Units |
| Owner Occupied Housing Units | 642 | 93.4% |
| Renter-Occupied Housing Units | 45 | 6.6% |
| Total Occupied Housing Units | 687 | 100.0% |
Occupancy by Household Size in Crystal Lawns
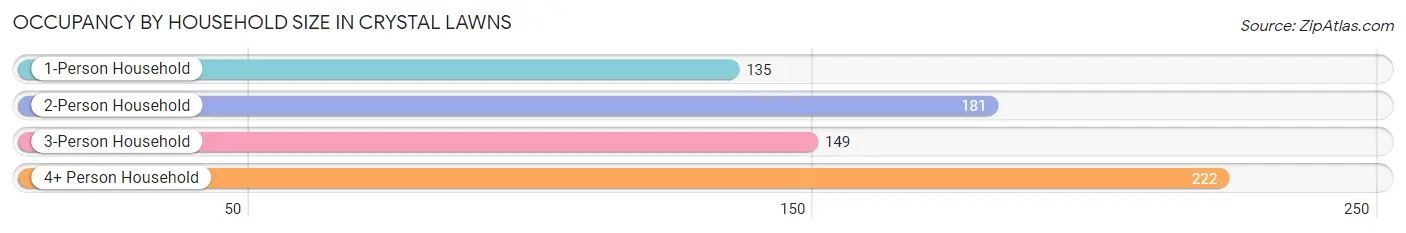
| Household Size | # Housing Units | % Housing Units |
| 1-Person Household | 135 | 19.7% |
| 2-Person Household | 181 | 26.4% |
| 3-Person Household | 149 | 21.7% |
| 4+ Person Household | 222 | 32.3% |
| Total Housing Units | 687 | 100.0% |
Occupancy by Ownership by Household Size in Crystal Lawns
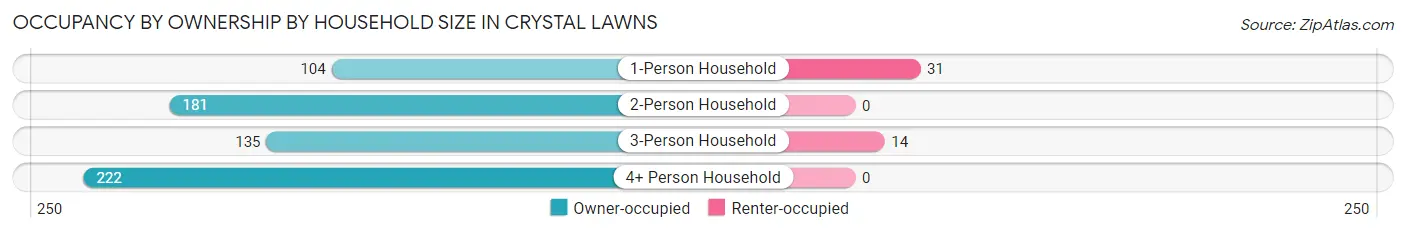
| Household Size | Owner-occupied | Renter-occupied |
| 1-Person Household | 104 (77.0%) | 31 (23.0%) |
| 2-Person Household | 181 (100.0%) | 0 (0.0%) |
| 3-Person Household | 135 (90.6%) | 14 (9.4%) |
| 4+ Person Household | 222 (100.0%) | 0 (0.0%) |
| Total Housing Units | 642 (93.4%) | 45 (6.6%) |
Occupancy by Educational Attainment in Crystal Lawns
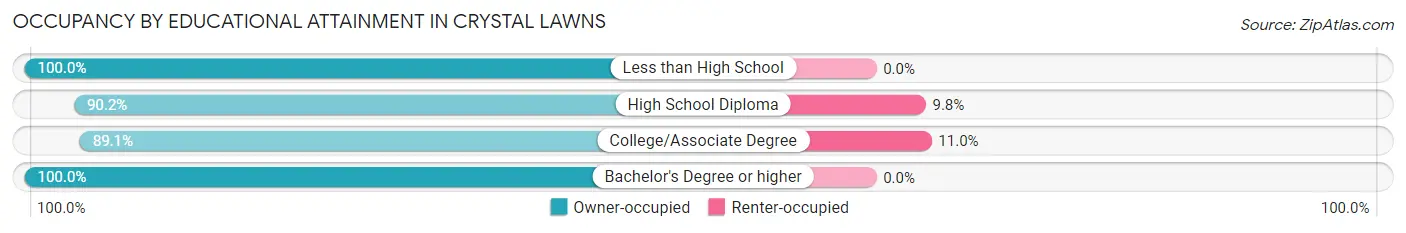
| Household Size | Owner-occupied | Renter-occupied |
| Less than High School | 84 (100.0%) | 0 (0.0%) |
| High School Diploma | 129 (90.2%) | 14 (9.8%) |
| College/Associate Degree | 252 (89.0%) | 31 (11.0%) |
| Bachelor's Degree or higher | 177 (100.0%) | 0 (0.0%) |
Occupancy by Age of Householder in Crystal Lawns
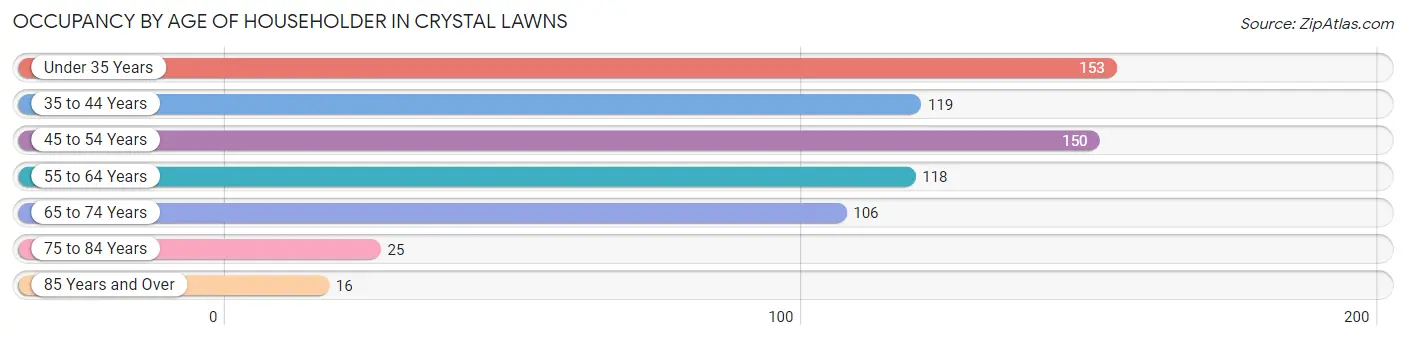
| Age Bracket | # Households | % Households |
| Under 35 Years | 153 | 22.3% |
| 35 to 44 Years | 119 | 17.3% |
| 45 to 54 Years | 150 | 21.8% |
| 55 to 64 Years | 118 | 17.2% |
| 65 to 74 Years | 106 | 15.4% |
| 75 to 84 Years | 25 | 3.6% |
| 85 Years and Over | 16 | 2.3% |
| Total | 687 | 100.0% |
Housing Finances in Crystal Lawns
Median Income by Occupancy in Crystal Lawns
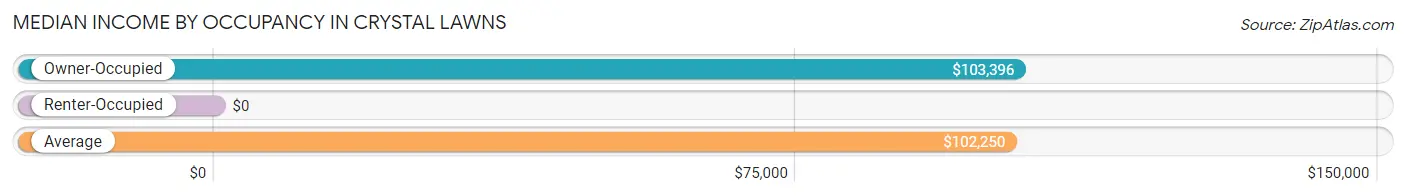
| Occupancy Type | # Households | Median Income |
| Owner-Occupied | 642 (93.4%) | $103,396 |
| Renter-Occupied | 45 (6.6%) | $0 |
| Average | 687 (100.0%) | $102,250 |
Occupancy by Householder Income Bracket in Crystal Lawns
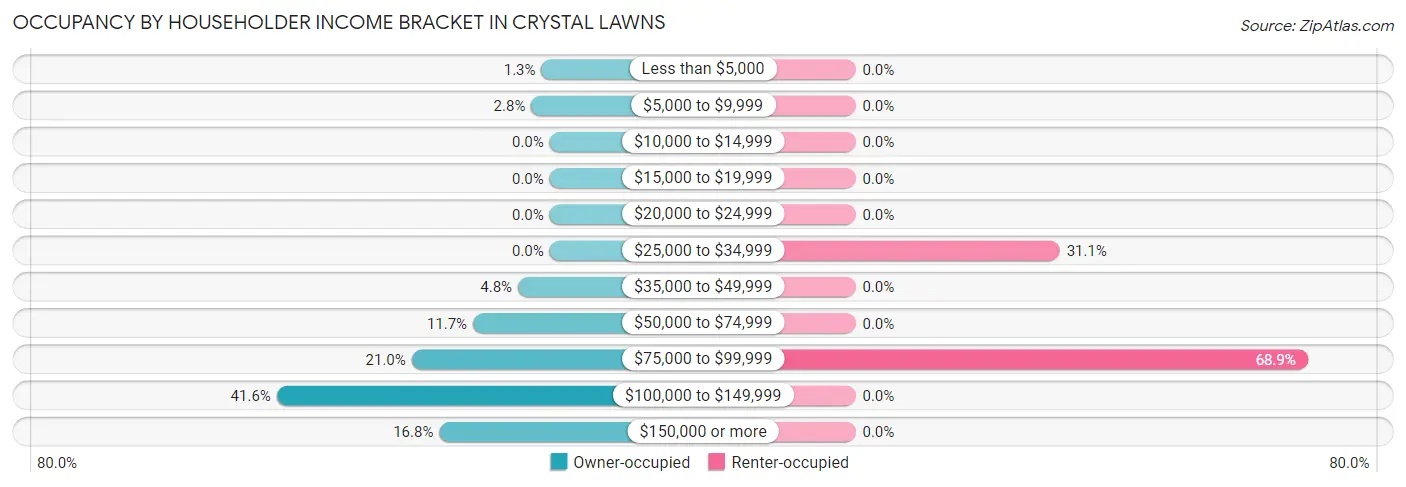
| Income Bracket | Owner-occupied | Renter-occupied |
| Less than $5,000 | 8 (1.3%) | 0 (0.0%) |
| $5,000 to $9,999 | 18 (2.8%) | 0 (0.0%) |
| $10,000 to $14,999 | 0 (0.0%) | 0 (0.0%) |
| $15,000 to $19,999 | 0 (0.0%) | 0 (0.0%) |
| $20,000 to $24,999 | 0 (0.0%) | 0 (0.0%) |
| $25,000 to $34,999 | 0 (0.0%) | 14 (31.1%) |
| $35,000 to $49,999 | 31 (4.8%) | 0 (0.0%) |
| $50,000 to $74,999 | 75 (11.7%) | 0 (0.0%) |
| $75,000 to $99,999 | 135 (21.0%) | 31 (68.9%) |
| $100,000 to $149,999 | 267 (41.6%) | 0 (0.0%) |
| $150,000 or more | 108 (16.8%) | 0 (0.0%) |
| Total | 642 (100.0%) | 45 (100.0%) |
Monthly Housing Cost Tiers in Crystal Lawns
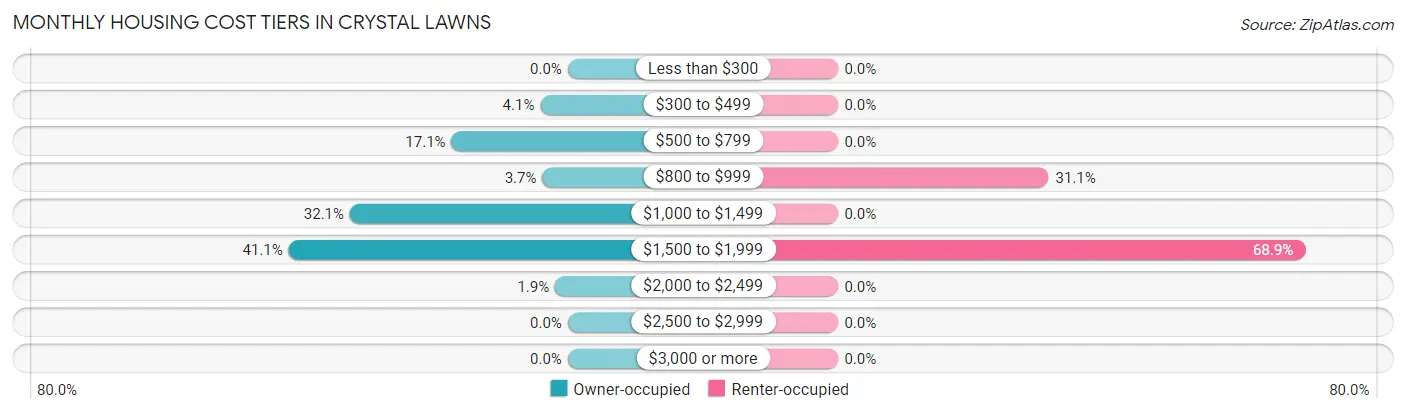
| Monthly Cost | Owner-occupied | Renter-occupied |
| Less than $300 | 0 (0.0%) | 0 (0.0%) |
| $300 to $499 | 26 (4.1%) | 0 (0.0%) |
| $500 to $799 | 110 (17.1%) | 0 (0.0%) |
| $800 to $999 | 24 (3.7%) | 14 (31.1%) |
| $1,000 to $1,499 | 206 (32.1%) | 0 (0.0%) |
| $1,500 to $1,999 | 264 (41.1%) | 31 (68.9%) |
| $2,000 to $2,499 | 12 (1.9%) | 0 (0.0%) |
| $2,500 to $2,999 | 0 (0.0%) | 0 (0.0%) |
| $3,000 or more | 0 (0.0%) | 0 (0.0%) |
| Total | 642 (100.0%) | 45 (100.0%) |
Physical Housing Characteristics in Crystal Lawns
Housing Structures in Crystal Lawns
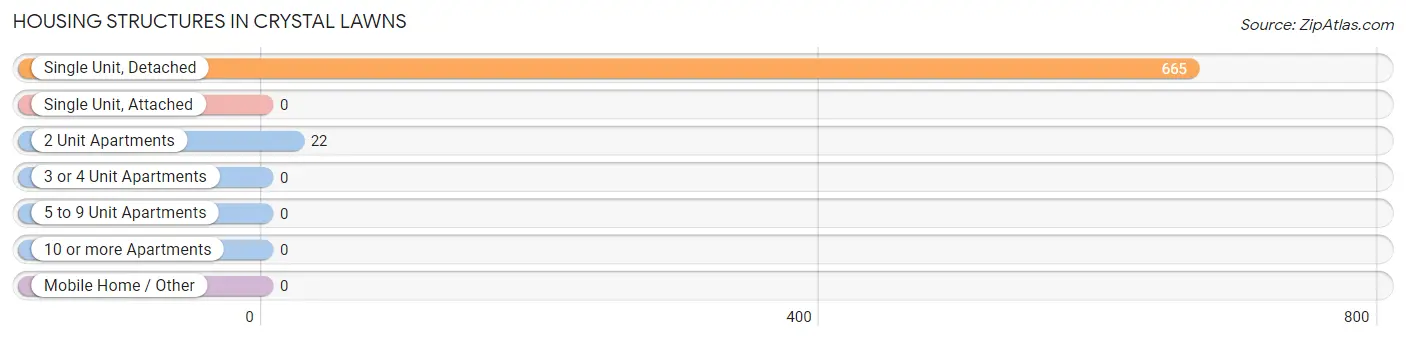
| Structure Type | # Housing Units | % Housing Units |
| Single Unit, Detached | 665 | 96.8% |
| Single Unit, Attached | 0 | 0.0% |
| 2 Unit Apartments | 22 | 3.2% |
| 3 or 4 Unit Apartments | 0 | 0.0% |
| 5 to 9 Unit Apartments | 0 | 0.0% |
| 10 or more Apartments | 0 | 0.0% |
| Mobile Home / Other | 0 | 0.0% |
| Total | 687 | 100.0% |
Housing Structures by Occupancy in Crystal Lawns
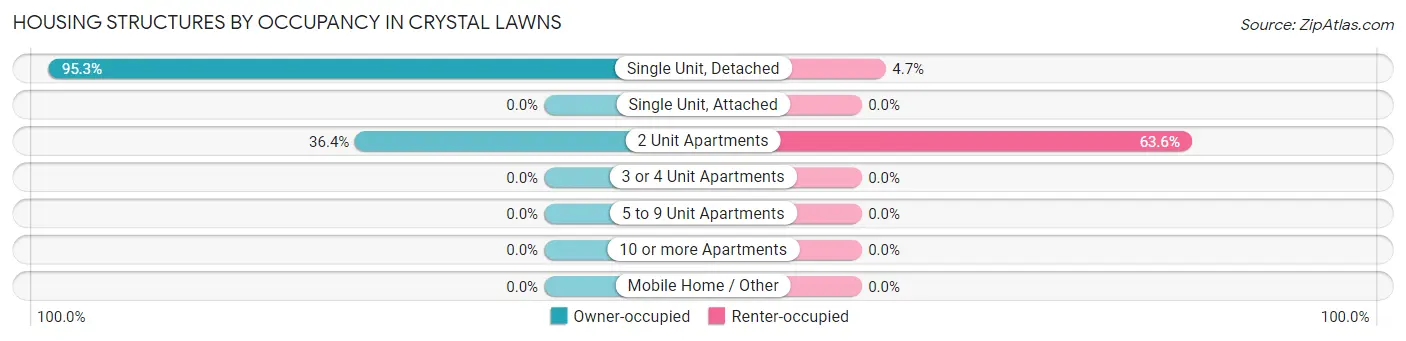
| Structure Type | Owner-occupied | Renter-occupied |
| Single Unit, Detached | 634 (95.3%) | 31 (4.7%) |
| Single Unit, Attached | 0 (0.0%) | 0 (0.0%) |
| 2 Unit Apartments | 8 (36.4%) | 14 (63.6%) |
| 3 or 4 Unit Apartments | 0 (0.0%) | 0 (0.0%) |
| 5 to 9 Unit Apartments | 0 (0.0%) | 0 (0.0%) |
| 10 or more Apartments | 0 (0.0%) | 0 (0.0%) |
| Mobile Home / Other | 0 (0.0%) | 0 (0.0%) |
| Total | 642 (93.4%) | 45 (6.6%) |
Housing Structures by Number of Rooms in Crystal Lawns
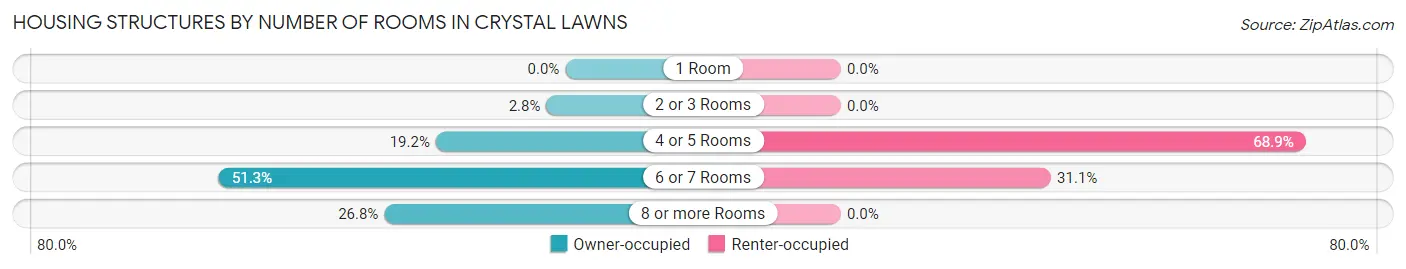
| Number of Rooms | Owner-occupied | Renter-occupied |
| 1 Room | 0 (0.0%) | 0 (0.0%) |
| 2 or 3 Rooms | 18 (2.8%) | 0 (0.0%) |
| 4 or 5 Rooms | 123 (19.2%) | 31 (68.9%) |
| 6 or 7 Rooms | 329 (51.2%) | 14 (31.1%) |
| 8 or more Rooms | 172 (26.8%) | 0 (0.0%) |
| Total | 642 (100.0%) | 45 (100.0%) |
Housing Structure by Heating Type in Crystal Lawns
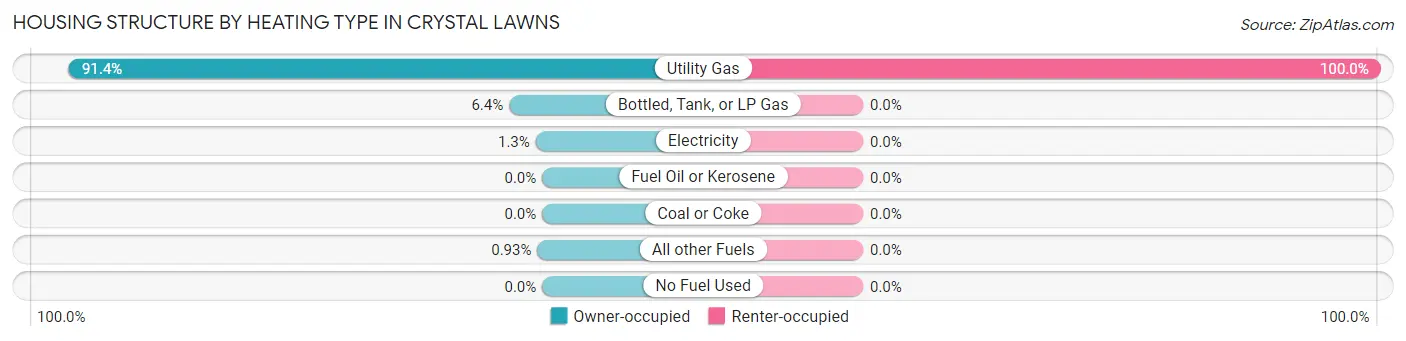
| Heating Type | Owner-occupied | Renter-occupied |
| Utility Gas | 587 (91.4%) | 45 (100.0%) |
| Bottled, Tank, or LP Gas | 41 (6.4%) | 0 (0.0%) |
| Electricity | 8 (1.3%) | 0 (0.0%) |
| Fuel Oil or Kerosene | 0 (0.0%) | 0 (0.0%) |
| Coal or Coke | 0 (0.0%) | 0 (0.0%) |
| All other Fuels | 6 (0.9%) | 0 (0.0%) |
| No Fuel Used | 0 (0.0%) | 0 (0.0%) |
| Total | 642 (100.0%) | 45 (100.0%) |
Household Vehicle Usage in Crystal Lawns
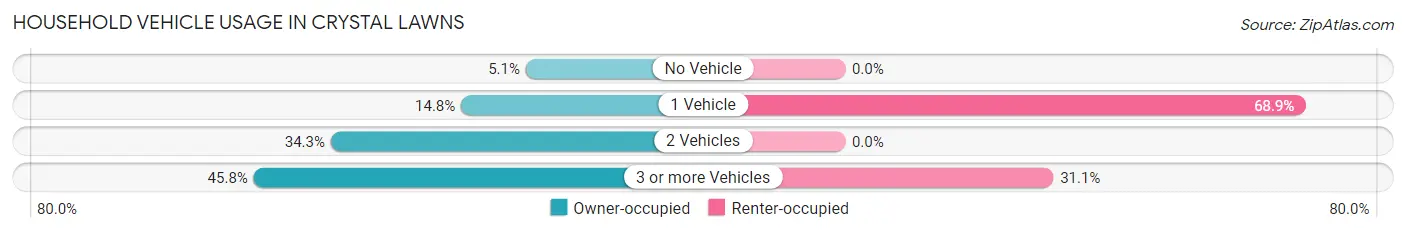
| Vehicles per Household | Owner-occupied | Renter-occupied |
| No Vehicle | 33 (5.1%) | 0 (0.0%) |
| 1 Vehicle | 95 (14.8%) | 31 (68.9%) |
| 2 Vehicles | 220 (34.3%) | 0 (0.0%) |
| 3 or more Vehicles | 294 (45.8%) | 14 (31.1%) |
| Total | 642 (100.0%) | 45 (100.0%) |
Real Estate & Mortgages in Crystal Lawns
Real Estate and Mortgage Overview in Crystal Lawns
| Characteristic | Without Mortgage | With Mortgage |
| Housing Units | 168 | 474 |
| Median Property Value | $221,600 | $211,500 |
| Median Household Income | $76,793 | $92 |
| Monthly Housing Costs | $582 | $0 |
| Real Estate Taxes | $4,368 | $0 |
Property Value by Mortgage Status in Crystal Lawns
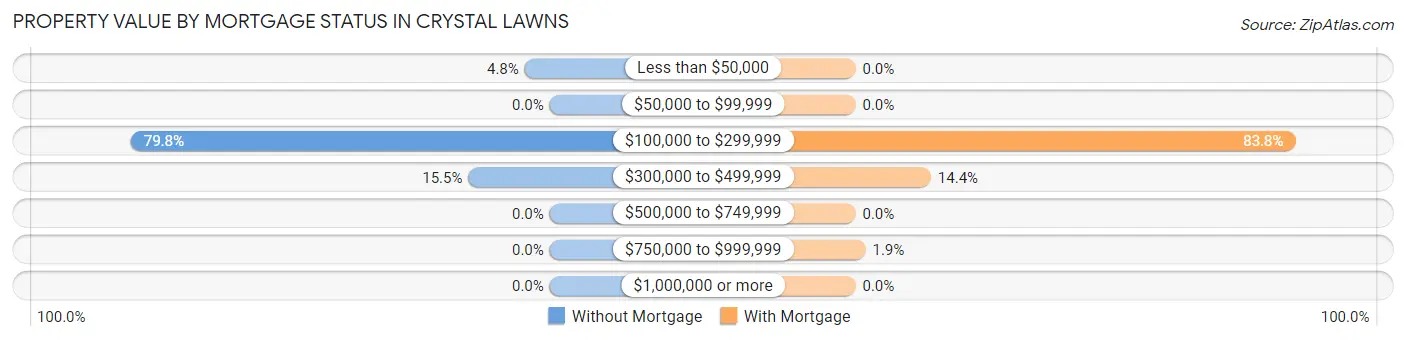
| Property Value | Without Mortgage | With Mortgage |
| Less than $50,000 | 8 (4.8%) | 0 (0.0%) |
| $50,000 to $99,999 | 0 (0.0%) | 0 (0.0%) |
| $100,000 to $299,999 | 134 (79.8%) | 397 (83.8%) |
| $300,000 to $499,999 | 26 (15.5%) | 68 (14.3%) |
| $500,000 to $749,999 | 0 (0.0%) | 0 (0.0%) |
| $750,000 to $999,999 | 0 (0.0%) | 9 (1.9%) |
| $1,000,000 or more | 0 (0.0%) | 0 (0.0%) |
| Total | 168 (100.0%) | 474 (100.0%) |
Household Income by Mortgage Status in Crystal Lawns
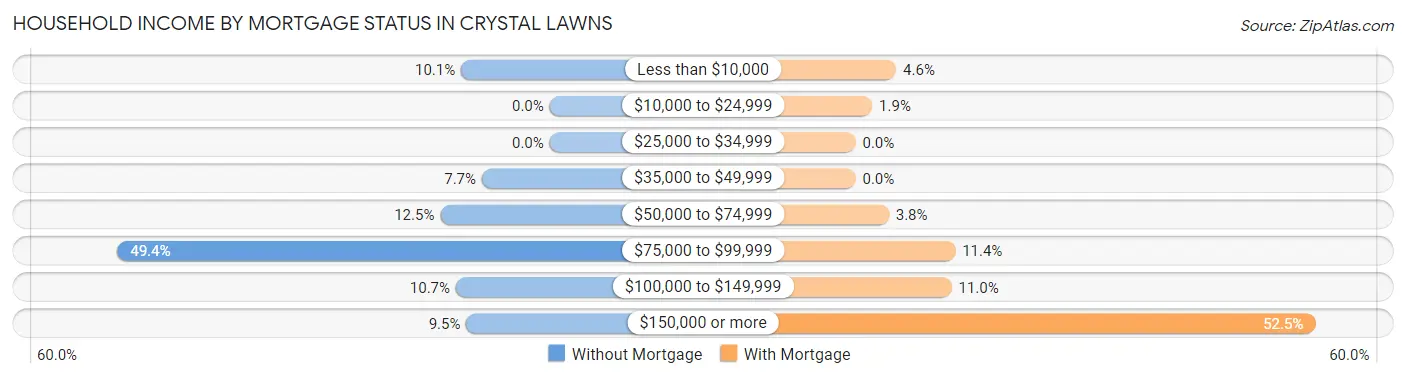
| Household Income | Without Mortgage | With Mortgage |
| Less than $10,000 | 17 (10.1%) | 22 (4.6%) |
| $10,000 to $24,999 | 0 (0.0%) | 9 (1.9%) |
| $25,000 to $34,999 | 0 (0.0%) | 0 (0.0%) |
| $35,000 to $49,999 | 13 (7.7%) | 0 (0.0%) |
| $50,000 to $74,999 | 21 (12.5%) | 18 (3.8%) |
| $75,000 to $99,999 | 83 (49.4%) | 54 (11.4%) |
| $100,000 to $149,999 | 18 (10.7%) | 52 (11.0%) |
| $150,000 or more | 16 (9.5%) | 249 (52.5%) |
| Total | 168 (100.0%) | 474 (100.0%) |
Property Value to Household Income Ratio in Crystal Lawns
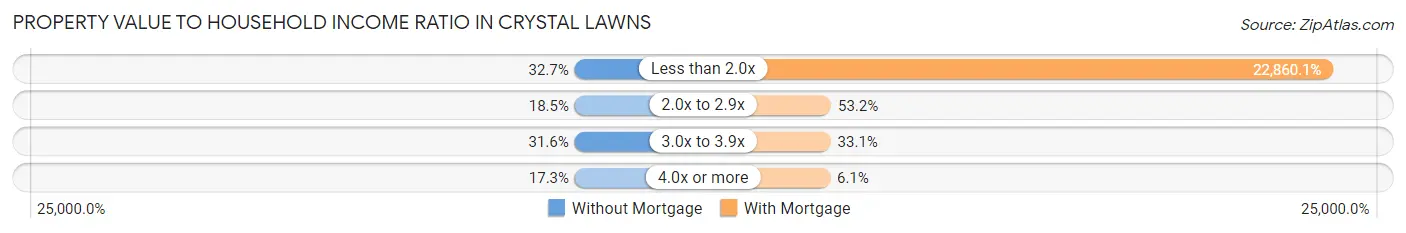
| Value-to-Income Ratio | Without Mortgage | With Mortgage |
| Less than 2.0x | 55 (32.7%) | 108,357 (22,860.1%) |
| 2.0x to 2.9x | 31 (18.4%) | 252 (53.2%) |
| 3.0x to 3.9x | 53 (31.6%) | 157 (33.1%) |
| 4.0x or more | 29 (17.3%) | 29 (6.1%) |
| Total | 168 (100.0%) | 474 (100.0%) |
Real Estate Taxes by Mortgage Status in Crystal Lawns
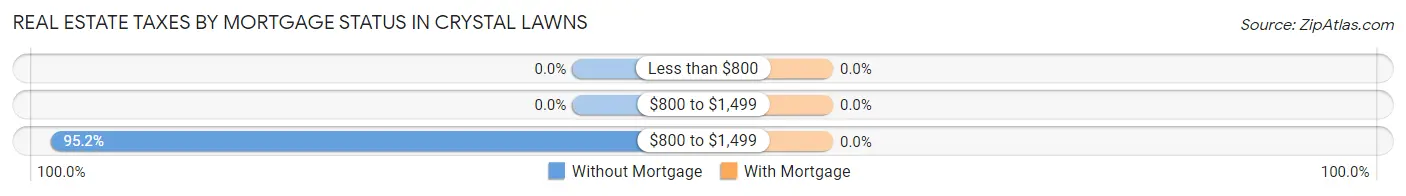
| Property Taxes | Without Mortgage | With Mortgage |
| Less than $800 | 0 (0.0%) | 0 (0.0%) |
| $800 to $1,499 | 0 (0.0%) | 0 (0.0%) |
| $800 to $1,499 | 160 (95.2%) | 0 (0.0%) |
| Total | 168 (100.0%) | 474 (100.0%) |
Health & Disability in Crystal Lawns
Health Insurance Coverage by Age in Crystal Lawns
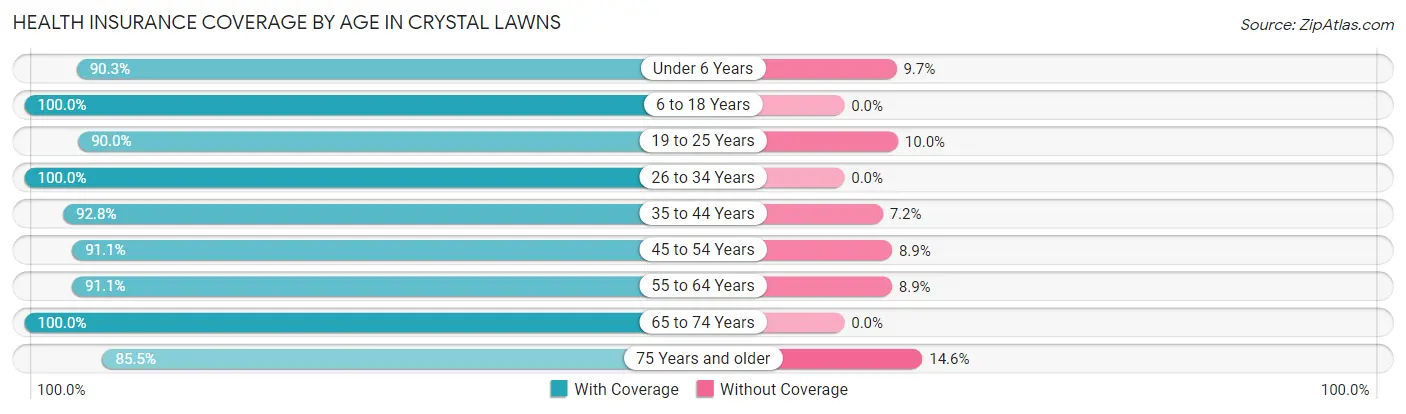
| Age Bracket | With Coverage | Without Coverage |
| Under 6 Years | 102 (90.3%) | 11 (9.7%) |
| 6 to 18 Years | 224 (100.0%) | 0 (0.0%) |
| 19 to 25 Years | 216 (90.0%) | 24 (10.0%) |
| 26 to 34 Years | 229 (100.0%) | 0 (0.0%) |
| 35 to 44 Years | 298 (92.8%) | 23 (7.2%) |
| 45 to 54 Years | 246 (91.1%) | 24 (8.9%) |
| 55 to 64 Years | 185 (91.1%) | 18 (8.9%) |
| 65 to 74 Years | 193 (100.0%) | 0 (0.0%) |
| 75 Years and older | 47 (85.5%) | 8 (14.5%) |
| Total | 1,740 (94.2%) | 108 (5.8%) |
Health Insurance Coverage by Citizenship Status in Crystal Lawns
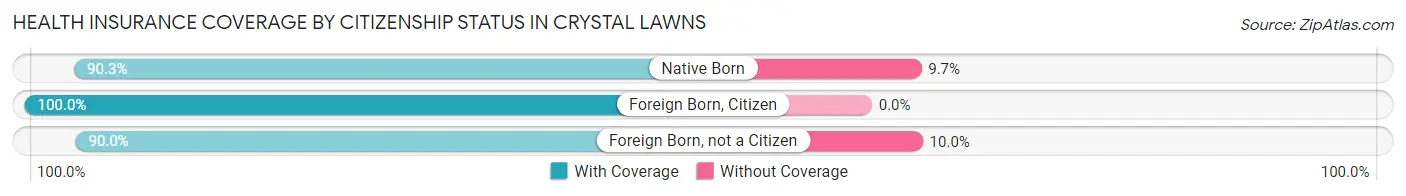
| Citizenship Status | With Coverage | Without Coverage |
| Native Born | 102 (90.3%) | 11 (9.7%) |
| Foreign Born, Citizen | 224 (100.0%) | 0 (0.0%) |
| Foreign Born, not a Citizen | 216 (90.0%) | 24 (10.0%) |
Health Insurance Coverage by Household Income in Crystal Lawns
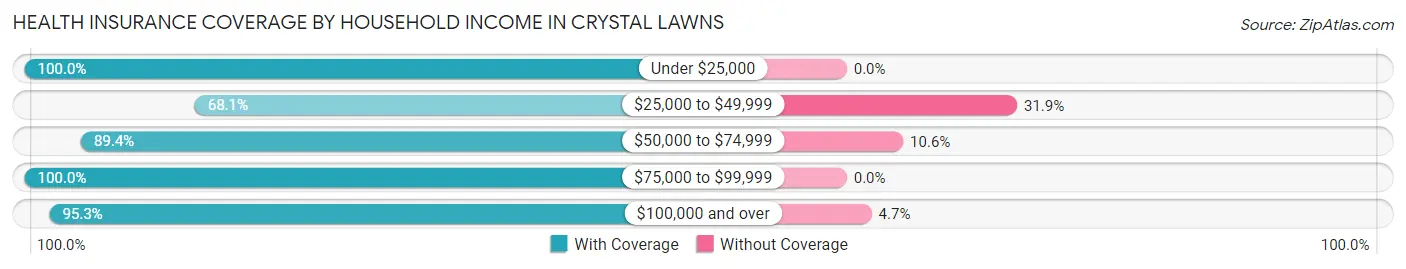
| Household Income | With Coverage | Without Coverage |
| Under $25,000 | 33 (100.0%) | 0 (0.0%) |
| $25,000 to $49,999 | 79 (68.1%) | 37 (31.9%) |
| $50,000 to $74,999 | 127 (89.4%) | 15 (10.6%) |
| $75,000 to $99,999 | 351 (100.0%) | 0 (0.0%) |
| $100,000 and over | 1,147 (95.3%) | 56 (4.7%) |
Public vs Private Health Insurance Coverage by Age in Crystal Lawns
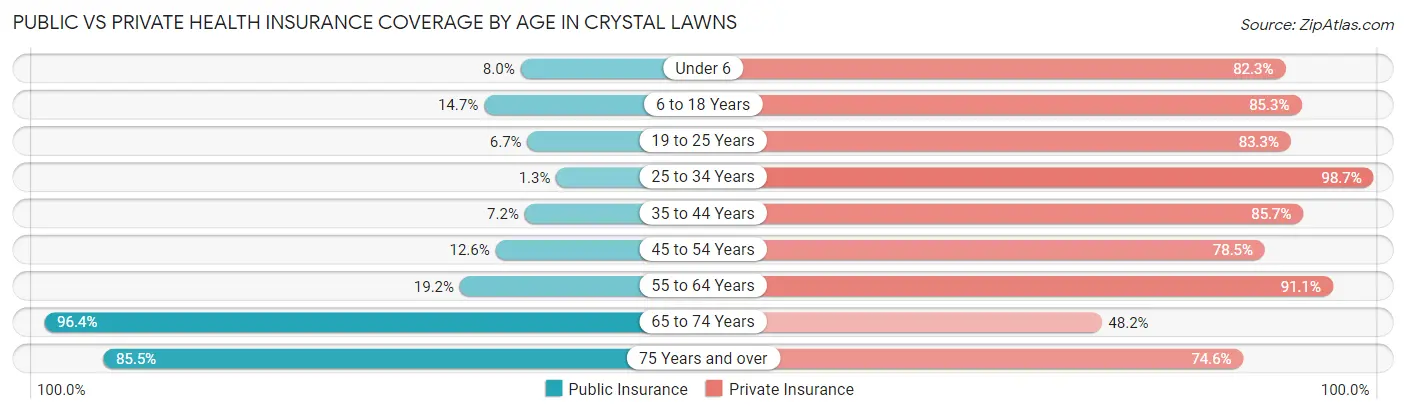
| Age Bracket | Public Insurance | Private Insurance |
| Under 6 | 9 (8.0%) | 93 (82.3%) |
| 6 to 18 Years | 33 (14.7%) | 191 (85.3%) |
| 19 to 25 Years | 16 (6.7%) | 200 (83.3%) |
| 25 to 34 Years | 3 (1.3%) | 226 (98.7%) |
| 35 to 44 Years | 23 (7.2%) | 275 (85.7%) |
| 45 to 54 Years | 34 (12.6%) | 212 (78.5%) |
| 55 to 64 Years | 39 (19.2%) | 185 (91.1%) |
| 65 to 74 Years | 186 (96.4%) | 93 (48.2%) |
| 75 Years and over | 47 (85.5%) | 41 (74.6%) |
| Total | 390 (21.1%) | 1,516 (82.0%) |
Disability Status by Sex by Age in Crystal Lawns
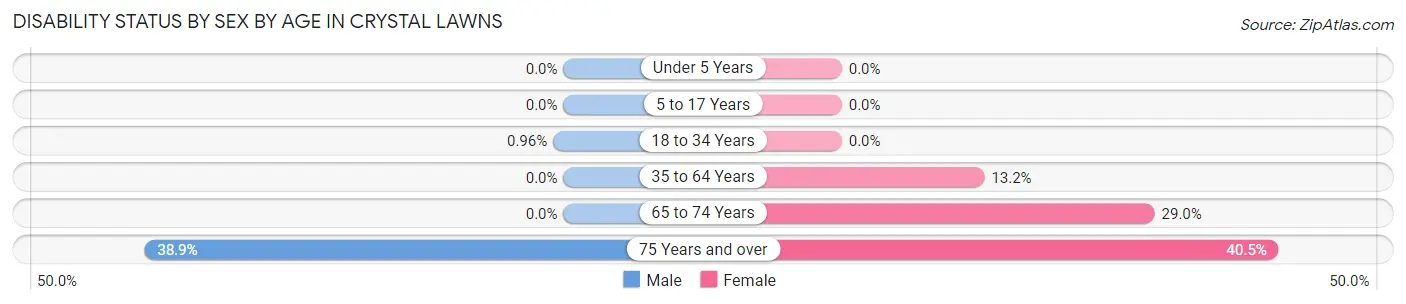
| Age Bracket | Male | Female |
| Under 5 Years | 0 (0.0%) | 0 (0.0%) |
| 5 to 17 Years | 0 (0.0%) | 0 (0.0%) |
| 18 to 34 Years | 3 (1.0%) | 0 (0.0%) |
| 35 to 64 Years | 0 (0.0%) | 47 (13.2%) |
| 65 to 74 Years | 0 (0.0%) | 27 (29.0%) |
| 75 Years and over | 7 (38.9%) | 15 (40.5%) |
Disability Class by Sex by Age in Crystal Lawns
Disability Class: Hearing Difficulty
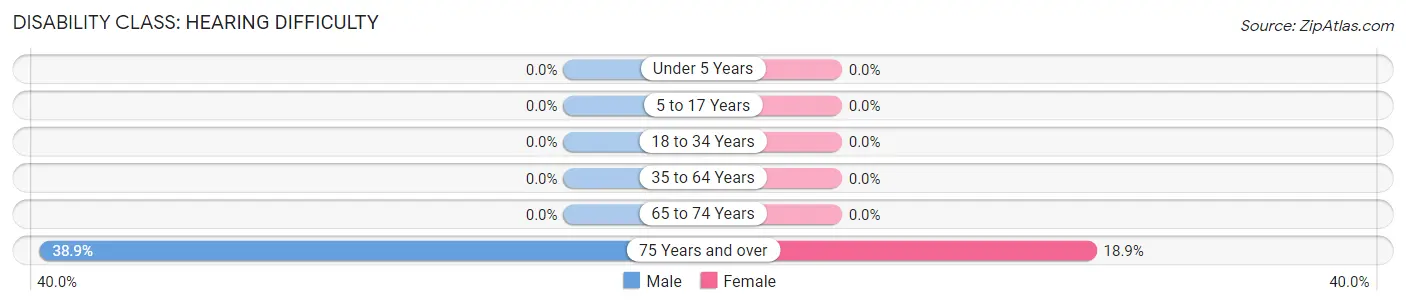
| Age Bracket | Male | Female |
| Under 5 Years | 0 (0.0%) | 0 (0.0%) |
| 5 to 17 Years | 0 (0.0%) | 0 (0.0%) |
| 18 to 34 Years | 0 (0.0%) | 0 (0.0%) |
| 35 to 64 Years | 0 (0.0%) | 0 (0.0%) |
| 65 to 74 Years | 0 (0.0%) | 0 (0.0%) |
| 75 Years and over | 7 (38.9%) | 7 (18.9%) |
Disability Class: Vision Difficulty
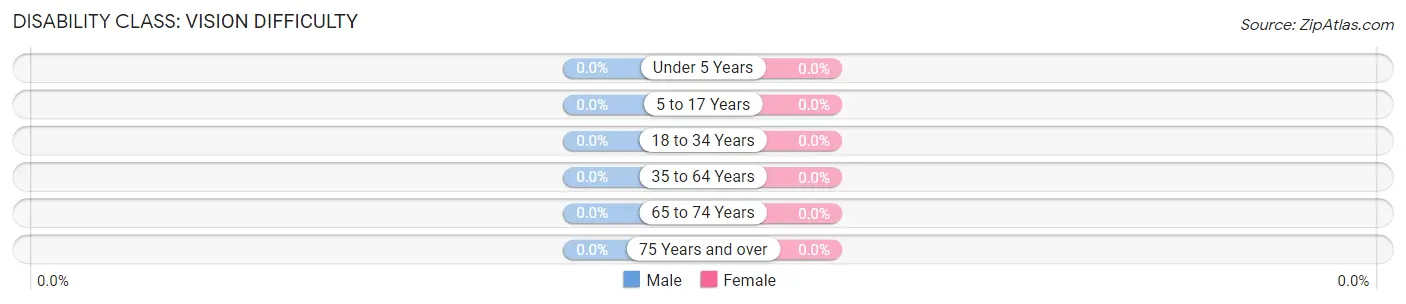
| Age Bracket | Male | Female |
| Under 5 Years | 0 (0.0%) | 0 (0.0%) |
| 5 to 17 Years | 0 (0.0%) | 0 (0.0%) |
| 18 to 34 Years | 0 (0.0%) | 0 (0.0%) |
| 35 to 64 Years | 0 (0.0%) | 0 (0.0%) |
| 65 to 74 Years | 0 (0.0%) | 0 (0.0%) |
| 75 Years and over | 0 (0.0%) | 0 (0.0%) |
Disability Class: Cognitive Difficulty
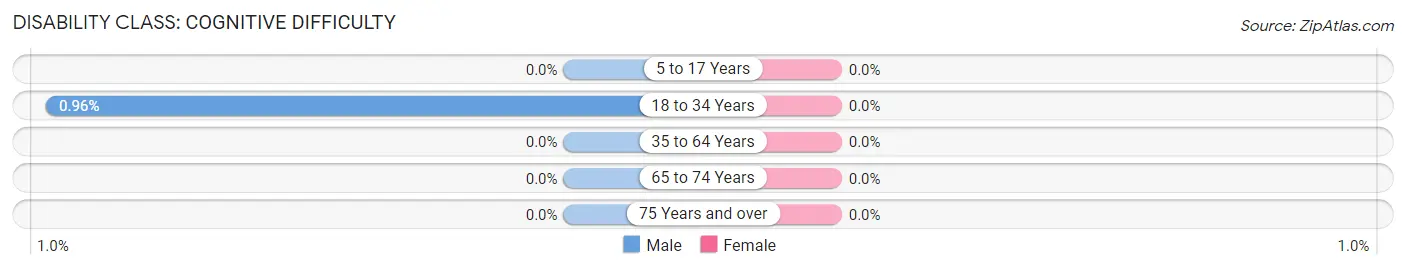
| Age Bracket | Male | Female |
| 5 to 17 Years | 0 (0.0%) | 0 (0.0%) |
| 18 to 34 Years | 3 (1.0%) | 0 (0.0%) |
| 35 to 64 Years | 0 (0.0%) | 0 (0.0%) |
| 65 to 74 Years | 0 (0.0%) | 0 (0.0%) |
| 75 Years and over | 0 (0.0%) | 0 (0.0%) |
Disability Class: Ambulatory Difficulty
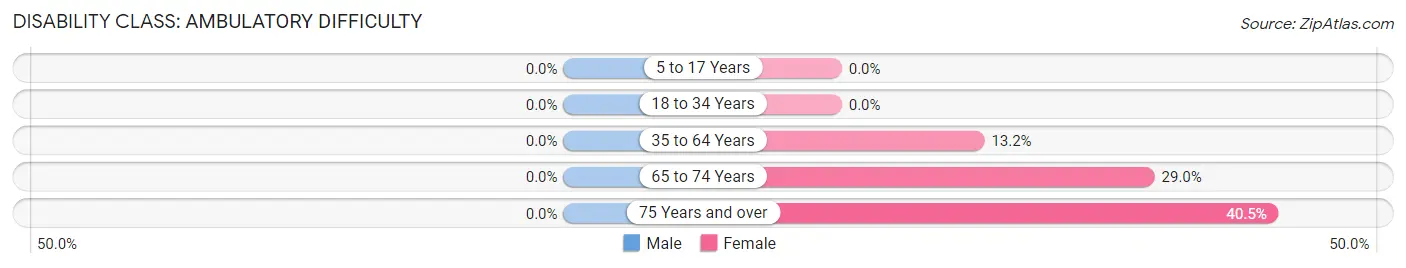
| Age Bracket | Male | Female |
| 5 to 17 Years | 0 (0.0%) | 0 (0.0%) |
| 18 to 34 Years | 0 (0.0%) | 0 (0.0%) |
| 35 to 64 Years | 0 (0.0%) | 47 (13.2%) |
| 65 to 74 Years | 0 (0.0%) | 27 (29.0%) |
| 75 Years and over | 0 (0.0%) | 15 (40.5%) |
Disability Class: Self-Care Difficulty
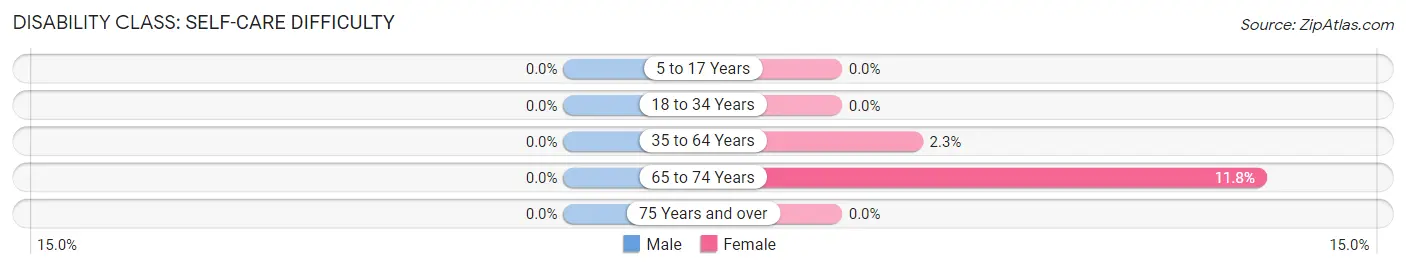
| Age Bracket | Male | Female |
| 5 to 17 Years | 0 (0.0%) | 0 (0.0%) |
| 18 to 34 Years | 0 (0.0%) | 0 (0.0%) |
| 35 to 64 Years | 0 (0.0%) | 8 (2.2%) |
| 65 to 74 Years | 0 (0.0%) | 11 (11.8%) |
| 75 Years and over | 0 (0.0%) | 0 (0.0%) |
Technology Access in Crystal Lawns
Computing Device Access in Crystal Lawns
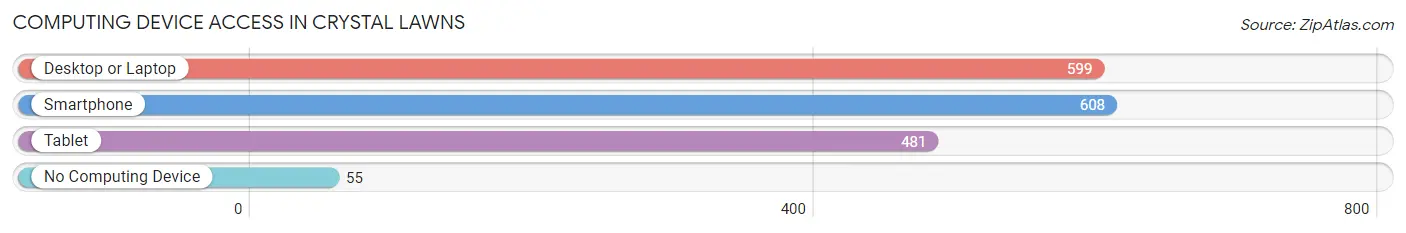
| Device Type | # Households | % Households |
| Desktop or Laptop | 599 | 87.2% |
| Smartphone | 608 | 88.5% |
| Tablet | 481 | 70.0% |
| No Computing Device | 55 | 8.0% |
| Total | 687 | 100.0% |
Internet Access in Crystal Lawns
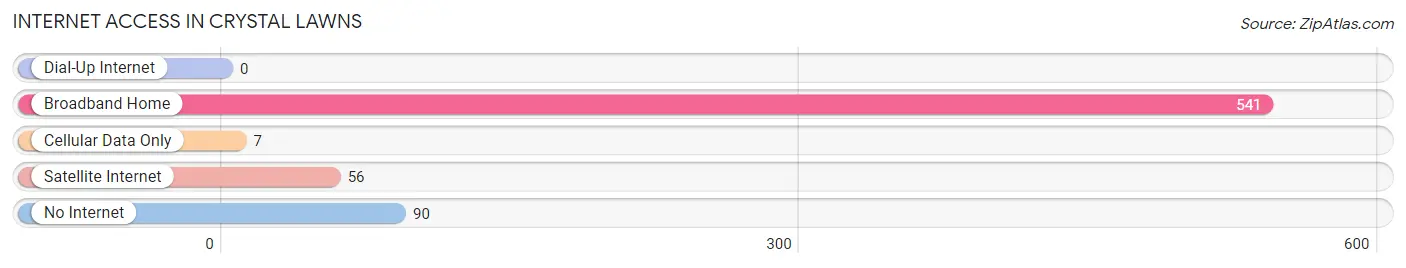
| Internet Type | # Households | % Households |
| Dial-Up Internet | 0 | 0.0% |
| Broadband Home | 541 | 78.7% |
| Cellular Data Only | 7 | 1.0% |
| Satellite Internet | 56 | 8.2% |
| No Internet | 90 | 13.1% |
| Total | 687 | 100.0% |
Crystal Lawns Summary
History
The village of Crystal Lawns, Illinois is located in the northeastern corner of the state, in Lake County. It was first settled in the late 1800s by a group of German immigrants who were looking for a place to start a new life. The village was originally called “Krystal Lawns”, but the name was changed to “Crystal Lawns” in the early 1900s.
The village was incorporated in 1908 and has since grown to a population of over 5,000 people. The village was originally a farming community, but has since become a bedroom community for the nearby city of Chicago.
Geography
Crystal Lawns is located in Lake County, Illinois, in the northeastern corner of the state. It is bordered by the cities of Waukegan, North Chicago, and Zion. The village is situated on the shores of Lake Michigan, and is approximately 40 miles north of downtown Chicago.
The village is located in a flat, low-lying area, with an elevation of 645 feet above sea level. The climate is humid continental, with hot summers and cold winters. The average annual temperature is around 50 degrees Fahrenheit.
Economy
The economy of Crystal Lawns is largely based on the service industry. The village is home to a number of small businesses, including restaurants, retail stores, and professional services. The village also has a number of manufacturing companies, including a plastics factory and a metal fabrication plant.
The village is also home to a number of corporate headquarters, including a major pharmaceutical company and a large insurance company. The village is also home to a number of medical facilities, including a hospital and several clinics.
Demographics
As of the 2010 census, the population of Crystal Lawns was 5,072. The racial makeup of the village was 79.3% White, 11.2% African American, 0.7% Native American, 2.2% Asian, and 6.6% from other races. Hispanic or Latino of any race were 8.3% of the population.
The median household income in Crystal Lawns was $50,945, and the median family income was $60,945. The per capita income was $25,945. About 8.3% of families and 10.2% of the population were below the poverty line, including 14.2% of those under age 18 and 6.2% of those age 65 or over.
The village is served by two public school districts, the Waukegan Community Unit School District 60 and the North Chicago Community Unit School District 187. The village is also home to a number of private schools, including a Catholic school and a Montessori school.
Common Questions
What is Per Capita Income in Crystal Lawns?
Per Capita income in Crystal Lawns is $39,363.
What is the Median Family Income in Crystal Lawns?
Median Family Income in Crystal Lawns is $107,953.
What is the Median Household income in Crystal Lawns?
Median Household Income in Crystal Lawns is $102,250.
What is Income or Wage Gap in Crystal Lawns?
Income or Wage Gap in Crystal Lawns is 31.5%.
Women in Crystal Lawns earn 68.5 cents for every dollar earned by a man.
What is Inequality or Gini Index in Crystal Lawns?
Inequality or Gini Index in Crystal Lawns is 0.27.
What is the Total Population of Crystal Lawns?
Total Population of Crystal Lawns is 1,848.
What is the Total Male Population of Crystal Lawns?
Total Male Population of Crystal Lawns is 981.
What is the Total Female Population of Crystal Lawns?
Total Female Population of Crystal Lawns is 867.
What is the Ratio of Males per 100 Females in Crystal Lawns?
There are 113.15 Males per 100 Females in Crystal Lawns.
What is the Ratio of Females per 100 Males in Crystal Lawns?
There are 88.38 Females per 100 Males in Crystal Lawns.
What is the Median Population Age in Crystal Lawns?
Median Population Age in Crystal Lawns is 38.2 Years.
What is the Average Family Size in Crystal Lawns
Average Family Size in Crystal Lawns is 3.1 People.
What is the Average Household Size in Crystal Lawns
Average Household Size in Crystal Lawns is 2.7 People.
How Large is the Labor Force in Crystal Lawns?
There are 1,236 People in the Labor Forcein in Crystal Lawns.
What is the Percentage of People in the Labor Force in Crystal Lawns?
79.4% of People are in the Labor Force in Crystal Lawns.
What is the Unemployment Rate in Crystal Lawns?
Unemployment Rate in Crystal Lawns is 4.4%.