Cities with the Highest Percentage of Mexican Population in Puerto Rico
RELATED REPORTS & OPTIONS
Mexican
Puerto Rico
Compare Cities
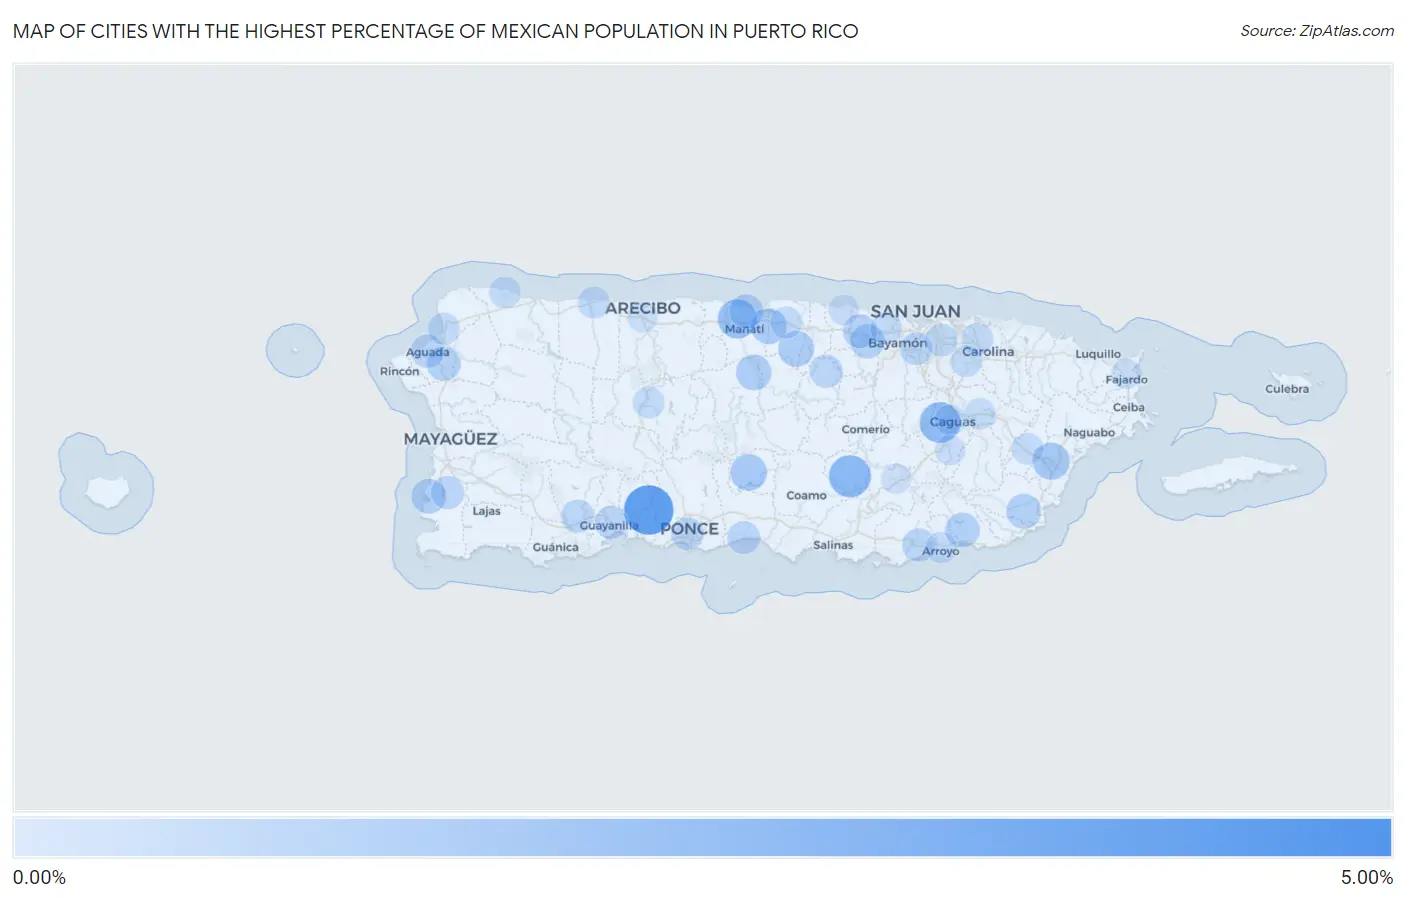
Map of Cities with the Highest Percentage of Mexican Population in Puerto Rico
0.00%
5.00%
Cities with the Highest Percentage of Mexican Population in Puerto Rico
| City | Mexican | vs State | vs National | |
| 1. | Palmarejo Comunidad Lajas Municipio | 4.05% | 0.24%(+3.81)#1 | 11.22%(-7.17)#9,410 |
| 2. | Tallaboa Alta | 3.40% | 0.24%(+3.16)#2 | 11.22%(-7.82)#10,268 |
| 3. | Pueblito Del Rio | 2.16% | 0.24%(+1.92)#3 | 11.22%(-9.06)#12,655 |
| 4. | Pastos | 2.05% | 0.24%(+1.81)#4 | 11.22%(-9.17)#12,931 |
| 5. | Los Prados | 1.82% | 0.24%(+1.58)#5 | 11.22%(-9.40)#13,530 |
| 6. | La Luisa | 1.57% | 0.24%(+1.33)#6 | 11.22%(-9.65)#14,197 |
| 7. | Cambalache | 1.36% | 0.24%(+1.12)#7 | 11.22%(-9.86)#14,815 |
| 8. | Playita Comunidad Yabucoa Municipio | 1.34% | 0.24%(+1.10)#8 | 11.22%(-9.88)#14,875 |
| 9. | Humacao | 1.18% | 0.24%(+0.936)#9 | 11.22%(-10.0)#15,404 |
| 10. | Villalba | 1.09% | 0.24%(+0.851)#10 | 11.22%(-10.1)#15,684 |
| 11. | Luis Llorens Torres | 1.07% | 0.24%(+0.827)#11 | 11.22%(-10.2)#15,775 |
| 12. | Catano | 1.03% | 0.24%(+0.788)#12 | 11.22%(-10.2)#15,912 |
| 13. | San Sebastian | 1.00% | 0.24%(+0.756)#13 | 11.22%(-10.2)#16,055 |
| 14. | Miranda | 0.98% | 0.24%(+0.738)#14 | 11.22%(-10.2)#16,136 |
| 15. | Coto Norte | 0.97% | 0.24%(+0.733)#15 | 11.22%(-10.2)#16,153 |
| 16. | Brisas Del Campanero | 0.93% | 0.24%(+0.686)#16 | 11.22%(-10.3)#16,313 |
| 17. | Ciales | 0.91% | 0.24%(+0.672)#17 | 11.22%(-10.3)#16,369 |
| 18. | Vazquez | 0.89% | 0.24%(+0.647)#18 | 11.22%(-10.3)#16,469 |
| 19. | Puerto Real | 0.81% | 0.24%(+0.567)#19 | 11.22%(-10.4)#16,790 |
| 20. | Yabucoa | 0.79% | 0.24%(+0.550)#20 | 11.22%(-10.4)#16,860 |
| 21. | Rio Grande | 0.79% | 0.24%(+0.548)#21 | 11.22%(-10.4)#16,862 |
| 22. | Patillas | 0.78% | 0.24%(+0.539)#22 | 11.22%(-10.4)#16,910 |
| 23. | Candelaria | 0.72% | 0.24%(+0.476)#23 | 11.22%(-10.5)#17,167 |
| 24. | Luyando | 0.68% | 0.24%(+0.438)#24 | 11.22%(-10.5)#17,307 |
| 25. | Tierras Nuevas Poniente | 0.67% | 0.24%(+0.431)#25 | 11.22%(-10.5)#17,333 |
| 26. | Manati | 0.65% | 0.24%(+0.407)#26 | 11.22%(-10.6)#17,425 |
| 27. | Campanilla | 0.63% | 0.24%(+0.387)#27 | 11.22%(-10.6)#17,515 |
| 28. | Aguada | 0.56% | 0.24%(+0.317)#28 | 11.22%(-10.7)#17,821 |
| 29. | Corozal | 0.54% | 0.24%(+0.299)#29 | 11.22%(-10.7)#17,878 |
| 30. | Hacienda San Jose | 0.53% | 0.24%(+0.292)#30 | 11.22%(-10.7)#17,906 |
| 31. | Guayama | 0.53% | 0.24%(+0.289)#31 | 11.22%(-10.7)#17,926 |
| 32. | Cabo Rojo | 0.52% | 0.24%(+0.283)#32 | 11.22%(-10.7)#17,943 |
| 33. | Yauco | 0.52% | 0.24%(+0.281)#33 | 11.22%(-10.7)#17,956 |
| 34. | Guayanilla | 0.51% | 0.24%(+0.275)#34 | 11.22%(-10.7)#17,984 |
| 35. | Potala Pastillo | 0.49% | 0.24%(+0.246)#35 | 11.22%(-10.7)#18,112 |
| 36. | Ponce | 0.44% | 0.24%(+0.204)#36 | 11.22%(-10.8)#18,331 |
| 37. | Guaynabo | 0.42% | 0.24%(+0.181)#37 | 11.22%(-10.8)#18,430 |
| 38. | San Juan | 0.40% | 0.24%(+0.165)#38 | 11.22%(-10.8)#18,480 |
| 39. | Caban | 0.36% | 0.24%(+0.123)#39 | 11.22%(-10.9)#18,665 |
| 40. | Juana Diaz | 0.32% | 0.24%(+0.080)#40 | 11.22%(-10.9)#18,869 |
| 41. | Aguadilla | 0.32% | 0.24%(+0.077)#41 | 11.22%(-10.9)#18,875 |
| 42. | Vega Baja | 0.31% | 0.24%(+0.072)#42 | 11.22%(-10.9)#18,896 |
| 43. | Bayamón | 0.31% | 0.24%(+0.070)#43 | 11.22%(-10.9)#18,901 |
| 44. | Hatillo | 0.30% | 0.24%(+0.057)#44 | 11.22%(-10.9)#18,961 |
| 45. | Utuado | 0.29% | 0.24%(+0.052)#45 | 11.22%(-10.9)#18,977 |
| 46. | Carolina | 0.29% | 0.24%(+0.049)#46 | 11.22%(-10.9)#18,989 |
| 47. | Penuelas | 0.28% | 0.24%(+0.044)#47 | 11.22%(-10.9)#19,017 |
| 48. | Isabela | 0.27% | 0.24%(+0.027)#48 | 11.22%(-11.0)#19,104 |
| 49. | Trujillo Alto | 0.26% | 0.24%(+0.024)#49 | 11.22%(-11.0)#19,130 |
| 50. | Las Piedras | 0.26% | 0.24%(+0.021)#50 | 11.22%(-11.0)#19,147 |
| 51. | Sabana Seca | 0.26% | 0.24%(+0.018)#51 | 11.22%(-11.0)#19,157 |
| 52. | Mayaguez | 0.22% | 0.24%(-0.018)#52 | 11.22%(-11.0)#19,321 |
| 53. | Loiza | 0.22% | 0.24%(-0.019)#53 | 11.22%(-11.0)#19,323 |
| 54. | Arroyo | 0.22% | 0.24%(-0.022)#54 | 11.22%(-11.0)#19,336 |
| 55. | Gurabo | 0.22% | 0.24%(-0.024)#55 | 11.22%(-11.0)#19,347 |
| 56. | Mansión Del Mar | 0.18% | 0.24%(-0.060)#56 | 11.22%(-11.0)#19,508 |
| 57. | Caño Martin Peña | 0.13% | 0.24%(-0.106)#57 | 11.22%(-11.1)#19,694 |
| 58. | Caguas | 0.13% | 0.24%(-0.109)#58 | 11.22%(-11.1)#19,708 |
| 59. | Parcelas Viejas Borinquen | 0.092% | 0.24%(-0.147)#59 | 11.22%(-11.1)#19,821 |
| 60. | Canovanas | 0.088% | 0.24%(-0.151)#60 | 11.22%(-11.1)#19,829 |
| 61. | Dorado | 0.076% | 0.24%(-0.164)#61 | 11.22%(-11.1)#19,864 |
| 62. | Cayey | 0.062% | 0.24%(-0.177)#62 | 11.22%(-11.2)#19,895 |
| 63. | Fajardo | 0.059% | 0.24%(-0.181)#63 | 11.22%(-11.2)#19,903 |
| 64. | Arecibo | 0.042% | 0.24%(-0.198)#64 | 11.22%(-11.2)#19,930 |
Common Questions
What are the Top 10 Cities with the Highest Percentage of Mexican Population in Puerto Rico?
Top 10 Cities with the Highest Percentage of Mexican Population in Puerto Rico are:
#1
3.40%
#2
2.05%
#3
1.82%
#4
1.57%
#5
1.18%
#6
1.09%
#7
0.98%
#8
0.97%
#9
0.91%
#10
0.81%
What city has the Highest Percentage of Mexican Population in Puerto Rico?
Tallaboa Alta has the Highest Percentage of Mexican Population in Puerto Rico with 3.40%.
What is the Percentage of Mexican Population in the State of Puerto Rico?
Percentage of Mexican Population in Puerto Rico is 0.24%.
What is the Percentage of Mexican Population in the United States?
Percentage of Mexican Population in the United States is 11.22%.