Zip Codes with the Highest Percentage of Mexican Population in East Saint Louis, IL
RELATED REPORTS & OPTIONS
Mexican
East Saint Louis
Compare Zip Codes
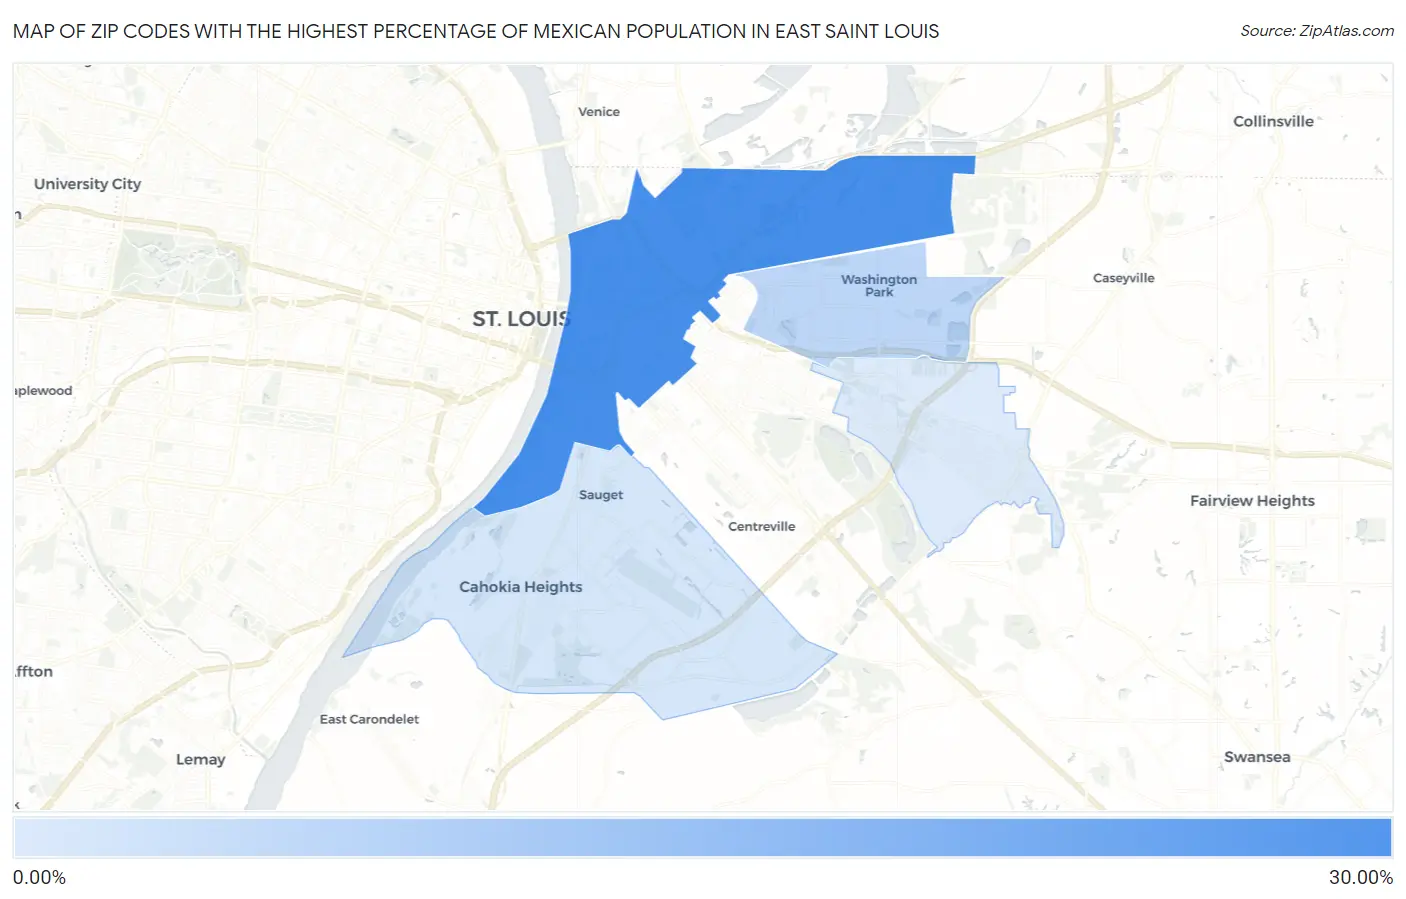
Map of Zip Codes with the Highest Percentage of Mexican Population in East Saint Louis
0.20%
26.04%
Zip Codes with the Highest Percentage of Mexican Population in East Saint Louis, IL
| Zip Code | Mexican | vs State | vs National | |
| 1. | 62201 | 26.04% | 13.83%(+12.2)#64 | 11.22%(+14.8)#2,188 |
| 2. | 62204 | 5.35% | 13.83%(-8.49)#365 | 11.22%(-5.87)#8,155 |
| 3. | 62206 | 1.12% | 13.83%(-12.7)#810 | 11.22%(-10.1)#17,534 |
| 4. | 62203 | 0.20% | 13.83%(-13.6)#1,018 | 11.22%(-11.0)#22,964 |
1
Common Questions
What are the Top 3 Zip Codes with the Highest Percentage of Mexican Population in East Saint Louis, IL?
Top 3 Zip Codes with the Highest Percentage of Mexican Population in East Saint Louis, IL are:
What zip code has the Highest Percentage of Mexican Population in East Saint Louis, IL?
62201 has the Highest Percentage of Mexican Population in East Saint Louis, IL with 26.04%.
What is the Percentage of Mexican Population in Illinois?
Percentage of Mexican Population in Illinois is 13.83%.
What is the Percentage of Mexican Population in the United States?
Percentage of Mexican Population in the United States is 11.22%.