Burnham, IL Map & Demographics
Burnham Map
Burnham Overview
$26,881
PER CAPITA INCOME
$53,301
AVG FAMILY INCOME
$53,397
AVG HOUSEHOLD INCOME
30.3%
WAGE / INCOME GAP [ % ]
69.7¢/ $1
WAGE / INCOME GAP [ $ ]
0.38
INEQUALITY / GINI INDEX
4,028
TOTAL POPULATION
1,751
MALE POPULATION
2,277
FEMALE POPULATION
76.90
MALES / 100 FEMALES
130.04
FEMALES / 100 MALES
36.7
MEDIAN AGE
3.6
AVG FAMILY SIZE
2.5
AVG HOUSEHOLD SIZE
2,140
LABOR FORCE [ PEOPLE ]
65.1%
PERCENT IN LABOR FORCE
12.3%
UNEMPLOYMENT RATE
Burnham Area Codes
Income in Burnham
Income Overview in Burnham
Per Capita Income in Burnham is $26,881, while median incomes of families and households are $53,301 and $53,397 respectively.
| Characteristic | Number | Measure |
| Per Capita Income | 4,028 | $26,881 |
| Median Family Income | 819 | $53,301 |
| Mean Family Income | 819 | $70,546 |
| Median Household Income | 1,522 | $53,397 |
| Mean Household Income | 1,522 | $66,888 |
| Income Deficit | 819 | $0 |
| Wage / Income Gap (%) | 4,028 | 30.26% |
| Wage / Income Gap ($) | 4,028 | 69.74¢ per $1 |
| Gini / Inequality Index | 4,028 | 0.38 |
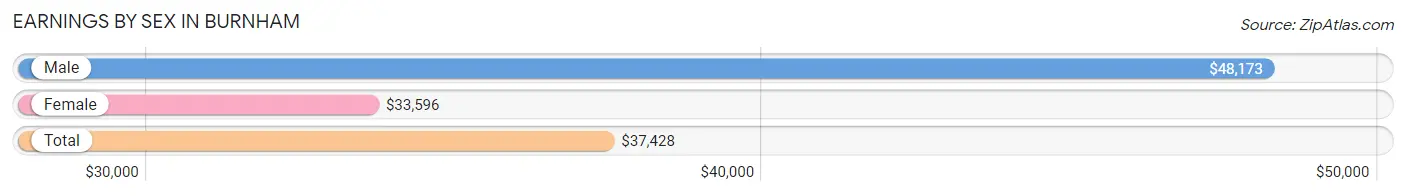
Earnings by Sex in Burnham
Average Earnings in Burnham are $37,428, $48,173 for men and $33,596 for women, a difference of 30.3%.
| Sex | Number | Average Earnings |
| Male | 907 (45.2%) | $48,173 |
| Female | 1,099 (54.8%) | $33,596 |
| Total | 2,006 (100.0%) | $37,428 |
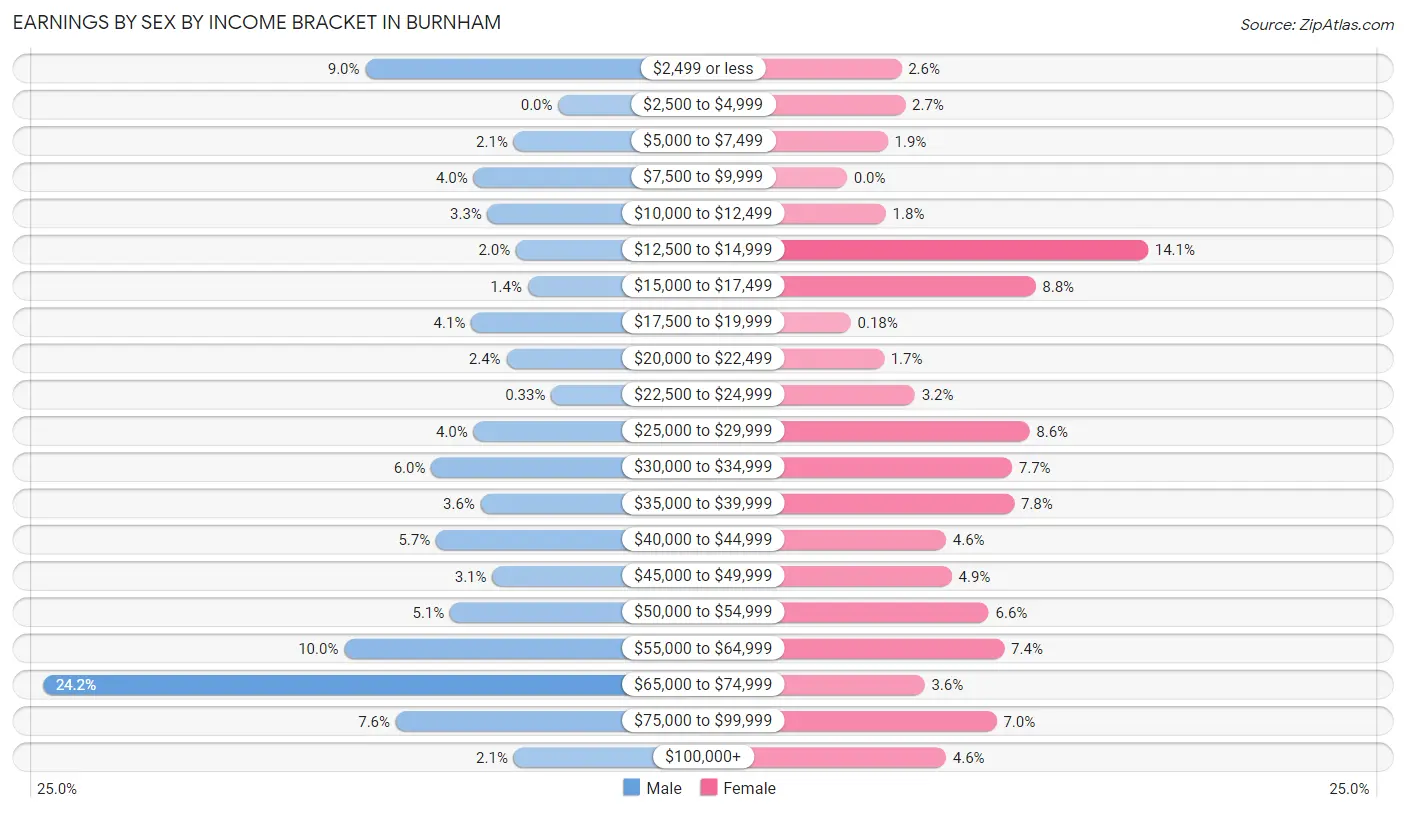
Earnings by Sex by Income Bracket in Burnham
The most common earnings brackets in Burnham are $65,000 to $74,999 for men (219 | 24.1%) and $12,500 to $14,999 for women (155 | 14.1%).
| Income | Male | Female |
| $2,499 or less | 82 (9.0%) | 28 (2.5%) |
| $2,500 to $4,999 | 0 (0.0%) | 30 (2.7%) |
| $5,000 to $7,499 | 19 (2.1%) | 21 (1.9%) |
| $7,500 to $9,999 | 36 (4.0%) | 0 (0.0%) |
| $10,000 to $12,499 | 30 (3.3%) | 20 (1.8%) |
| $12,500 to $14,999 | 18 (2.0%) | 155 (14.1%) |
| $15,000 to $17,499 | 13 (1.4%) | 97 (8.8%) |
| $17,500 to $19,999 | 37 (4.1%) | 2 (0.2%) |
| $20,000 to $22,499 | 22 (2.4%) | 19 (1.7%) |
| $22,500 to $24,999 | 3 (0.3%) | 35 (3.2%) |
| $25,000 to $29,999 | 36 (4.0%) | 94 (8.6%) |
| $30,000 to $34,999 | 54 (5.9%) | 85 (7.7%) |
| $35,000 to $39,999 | 33 (3.6%) | 86 (7.8%) |
| $40,000 to $44,999 | 52 (5.7%) | 51 (4.6%) |
| $45,000 to $49,999 | 28 (3.1%) | 54 (4.9%) |
| $50,000 to $54,999 | 46 (5.1%) | 73 (6.6%) |
| $55,000 to $64,999 | 91 (10.0%) | 81 (7.4%) |
| $65,000 to $74,999 | 219 (24.1%) | 40 (3.6%) |
| $75,000 to $99,999 | 69 (7.6%) | 77 (7.0%) |
| $100,000+ | 19 (2.1%) | 51 (4.6%) |
| Total | 907 (100.0%) | 1,099 (100.0%) |
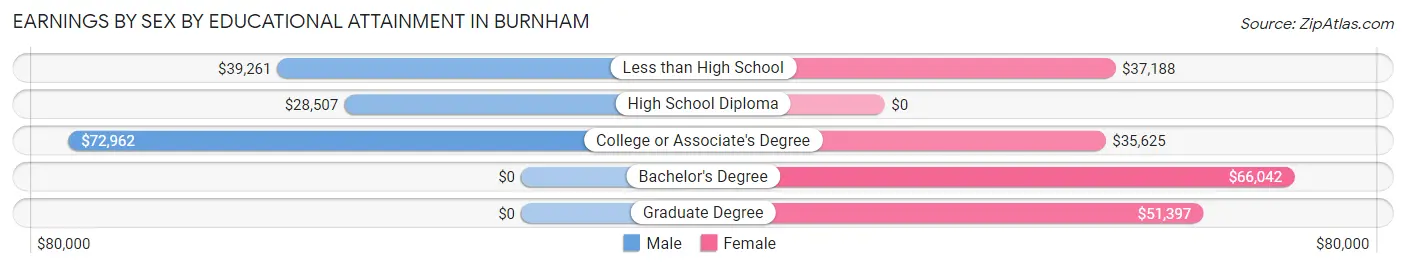
Earnings by Sex by Educational Attainment in Burnham
Average earnings in Burnham are $55,000 for men and $34,346 for women, a difference of 37.6%. Men with an educational attainment of college or associate's degree enjoy the highest average annual earnings of $72,962, while those with high school diploma education earn the least with $28,507. Women with an educational attainment of bachelor's degree earn the most with the average annual earnings of $66,042, while those with college or associate's degree education have the smallest earnings of $35,625.
| Educational Attainment | Male Income | Female Income |
| Less than High School | $39,261 | $37,188 |
| High School Diploma | $28,507 | $0 |
| College or Associate's Degree | $72,962 | $35,625 |
| Bachelor's Degree | - | - |
| Graduate Degree | - | - |
| Total | $55,000 | $34,346 |
Family Income in Burnham
Family Income Brackets in Burnham
According to the Burnham family income data, there are 189 families falling into the $50,000 to $74,999 income range, which is the most common income bracket and makes up 23.1% of all families. Conversely, the less than $10,000 income bracket is the least frequent group with only 22 families (2.7%) belonging to this category.
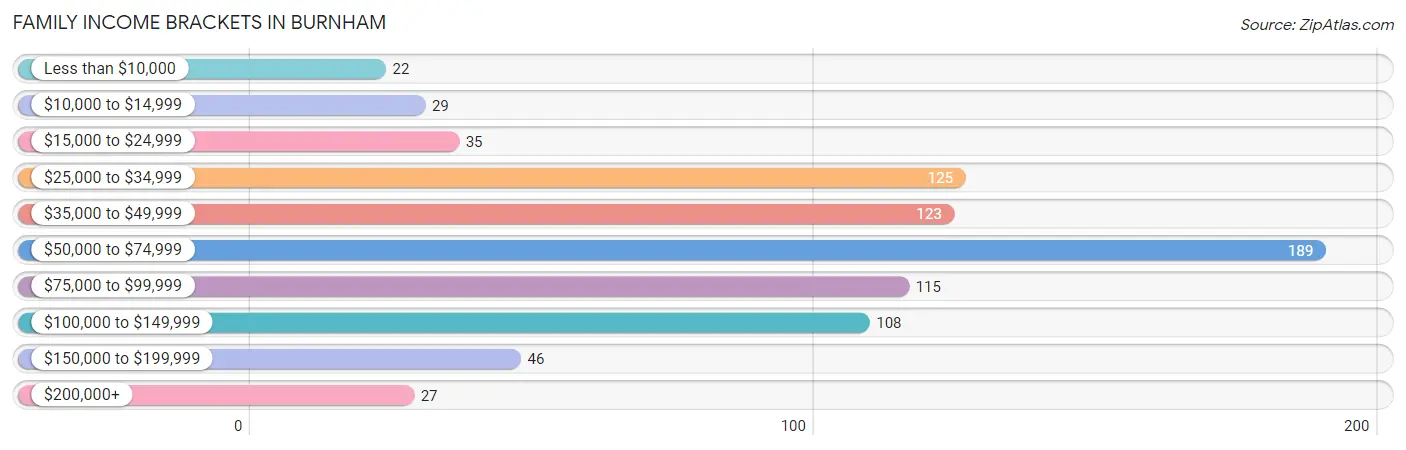
| Income Bracket | # Families | % Families |
| Less than $10,000 | 22 | 2.7% |
| $10,000 to $14,999 | 29 | 3.5% |
| $15,000 to $24,999 | 35 | 4.3% |
| $25,000 to $34,999 | 125 | 15.3% |
| $35,000 to $49,999 | 123 | 15.0% |
| $50,000 to $74,999 | 189 | 23.1% |
| $75,000 to $99,999 | 115 | 14.0% |
| $100,000 to $149,999 | 108 | 13.2% |
| $150,000 to $199,999 | 46 | 5.6% |
| $200,000+ | 27 | 3.3% |
Family Income by Famaliy Size in Burnham
7+ person families (53 | 6.5%) account for the highest median family income in Burnham with $119,583 per family, while 2-person families (360 | 44.0%) have the highest median income of $26,834 per family member.
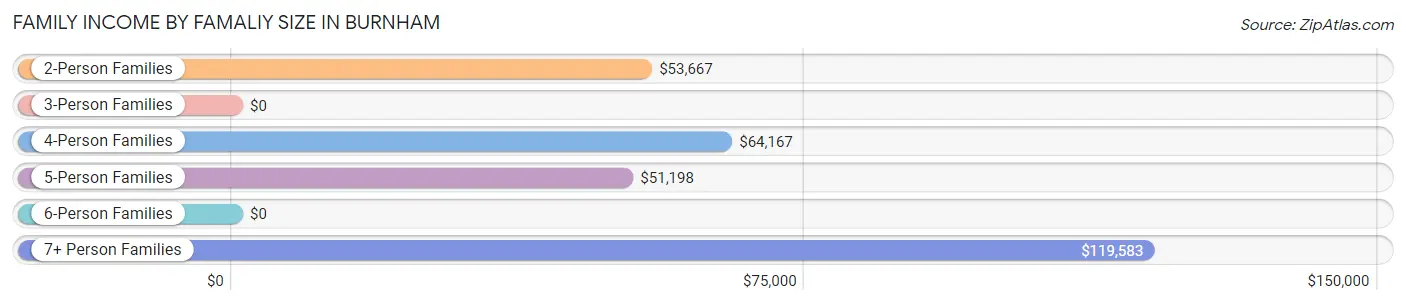
| Income Bracket | # Families | Median Income |
| 2-Person Families | 360 (44.0%) | $53,667 |
| 3-Person Families | 227 (27.7%) | $0 |
| 4-Person Families | 92 (11.2%) | $64,167 |
| 5-Person Families | 83 (10.1%) | $51,198 |
| 6-Person Families | 4 (0.5%) | $0 |
| 7+ Person Families | 53 (6.5%) | $119,583 |
| Total | 819 (100.0%) | $53,301 |
Family Income by Number of Earners in Burnham
The median family income in Burnham is $53,301, with families comprising 3+ earners (129) having the highest median family income of $97,344, while families with no earners (43) have the lowest median family income of $42,656, accounting for 15.8% and 5.2% of families, respectively.
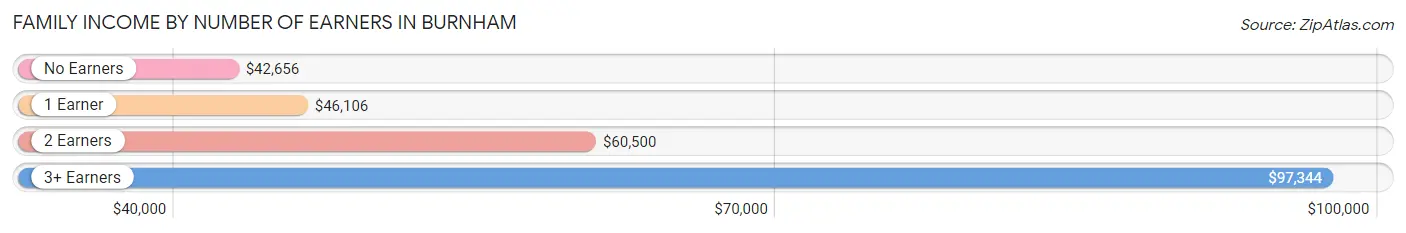
| Number of Earners | # Families | Median Income |
| No Earners | 43 (5.2%) | $42,656 |
| 1 Earner | 371 (45.3%) | $46,106 |
| 2 Earners | 276 (33.7%) | $60,500 |
| 3+ Earners | 129 (15.8%) | $97,344 |
| Total | 819 (100.0%) | $53,301 |
Household Income in Burnham
Household Income Brackets in Burnham
With 336 households falling in the category, the $100,000 to $149,999 income range is the most frequent in Burnham, accounting for 22.1% of all households. In contrast, only 27 households (1.8%) fall into the $200,000+ income bracket, making it the least populous group.
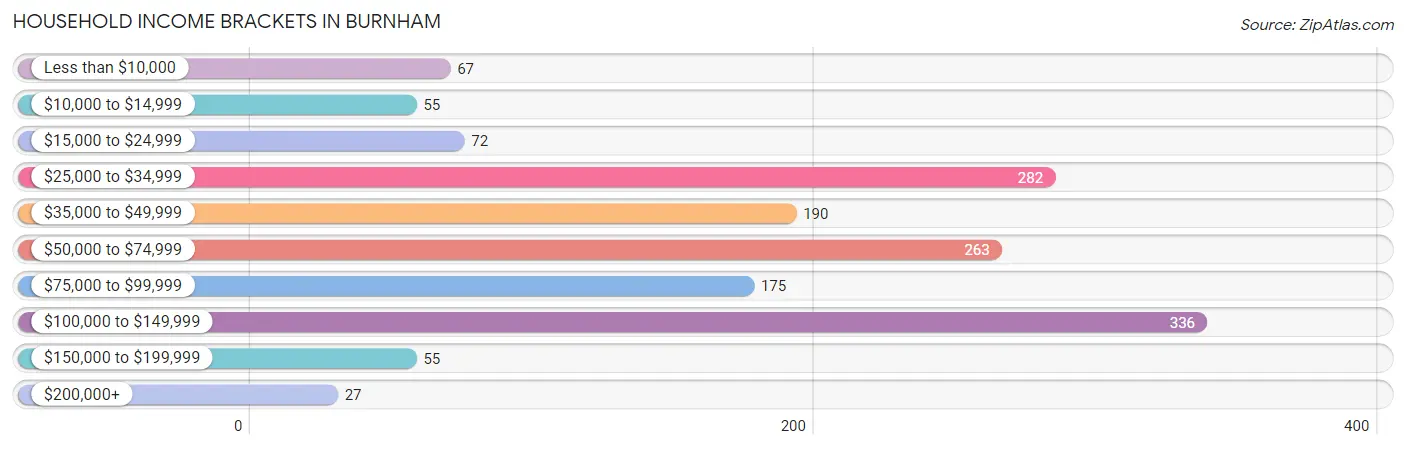
| Income Bracket | # Households | % Households |
| Less than $10,000 | 67 | 4.4% |
| $10,000 to $14,999 | 55 | 3.6% |
| $15,000 to $24,999 | 72 | 4.7% |
| $25,000 to $34,999 | 282 | 18.5% |
| $35,000 to $49,999 | 190 | 12.5% |
| $50,000 to $74,999 | 263 | 17.3% |
| $75,000 to $99,999 | 175 | 11.5% |
| $100,000 to $149,999 | 336 | 22.1% |
| $150,000 to $199,999 | 55 | 3.6% |
| $200,000+ | 27 | 1.8% |
Household Income by Householder Age in Burnham
The median household income in Burnham is $53,397, with the highest median household income of $79,813 found in the 25 to 44 years age bracket for the primary householder. A total of 441 households (29.0%) fall into this category. Meanwhile, the 65+ years age bracket for the primary householder has the lowest median household income of $39,917, with 281 households (18.5%) in this group.
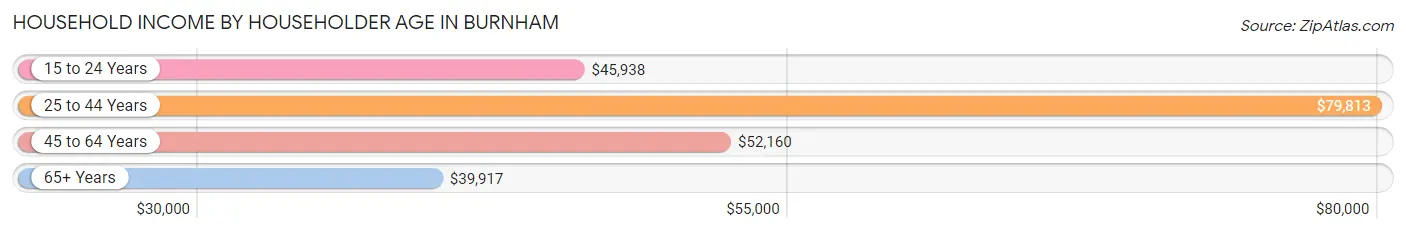
| Income Bracket | # Households | Median Income |
| 15 to 24 Years | 34 (2.2%) | $45,938 |
| 25 to 44 Years | 441 (29.0%) | $79,813 |
| 45 to 64 Years | 766 (50.3%) | $52,160 |
| 65+ Years | 281 (18.5%) | $39,917 |
| Total | 1,522 (100.0%) | $53,397 |
Poverty in Burnham
Income Below Poverty by Sex and Age in Burnham
With 13.9% poverty level for males and 8.7% for females among the residents of Burnham, 15 year old males and 15 year old females are the most vulnerable to poverty, with 11 males (68.8%) and 11 females (100.0%) in their respective age groups living below the poverty level.
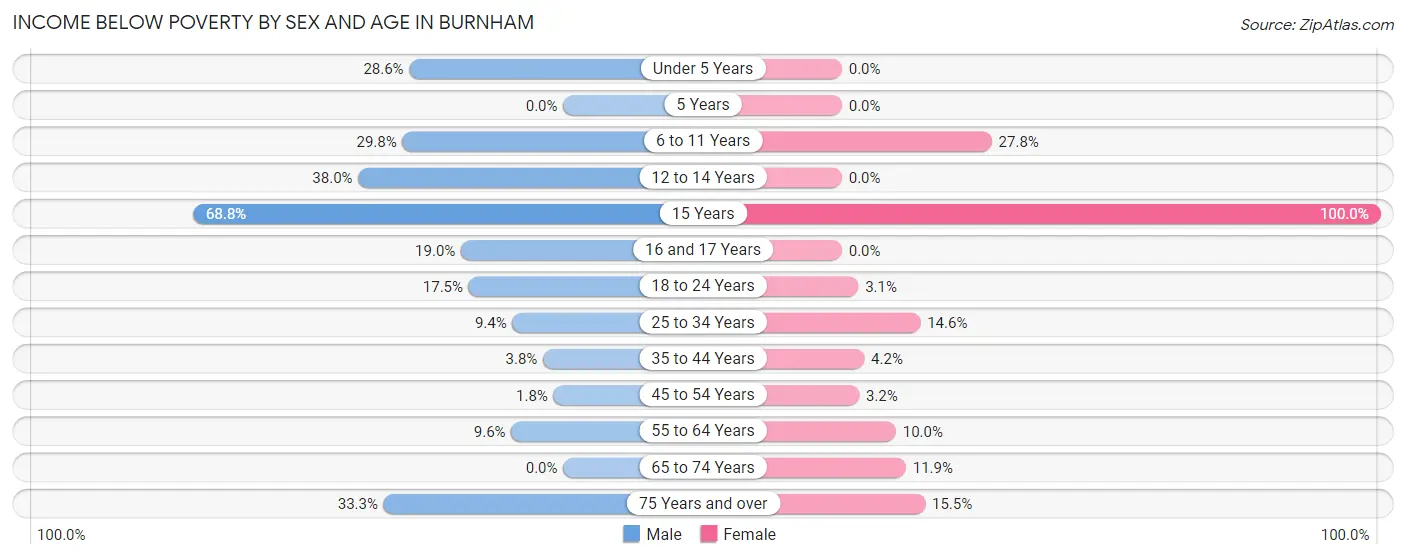
| Age Bracket | Male | Female |
| Under 5 Years | 16 (28.6%) | 0 (0.0%) |
| 5 Years | 0 (0.0%) | 0 (0.0%) |
| 6 to 11 Years | 57 (29.8%) | 37 (27.8%) |
| 12 to 14 Years | 35 (38.0%) | 0 (0.0%) |
| 15 Years | 11 (68.8%) | 11 (100.0%) |
| 16 and 17 Years | 11 (19.0%) | 0 (0.0%) |
| 18 to 24 Years | 30 (17.5%) | 4 (3.0%) |
| 25 to 34 Years | 20 (9.4%) | 46 (14.6%) |
| 35 to 44 Years | 11 (3.7%) | 10 (4.2%) |
| 45 to 54 Years | 4 (1.8%) | 14 (3.2%) |
| 55 to 64 Years | 16 (9.6%) | 32 (10.0%) |
| 65 to 74 Years | 0 (0.0%) | 12 (11.9%) |
| 75 Years and over | 18 (33.3%) | 17 (15.4%) |
| Total | 229 (13.9%) | 183 (8.7%) |
Income Above Poverty by Sex and Age in Burnham
According to the poverty statistics in Burnham, males aged 5 years and females aged under 5 years are the age groups that are most secure financially, with 100.0% of males and 100.0% of females in these age groups living above the poverty line.
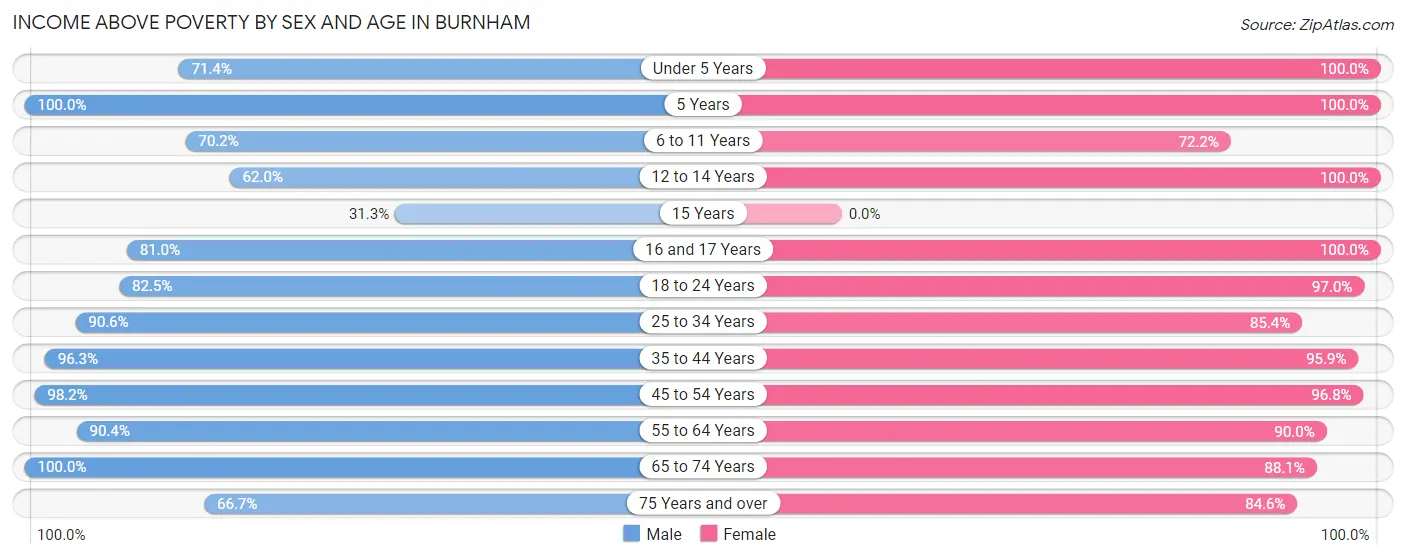
| Age Bracket | Male | Female |
| Under 5 Years | 40 (71.4%) | 100 (100.0%) |
| 5 Years | 38 (100.0%) | 31 (100.0%) |
| 6 to 11 Years | 134 (70.2%) | 96 (72.2%) |
| 12 to 14 Years | 57 (62.0%) | 56 (100.0%) |
| 15 Years | 5 (31.2%) | 0 (0.0%) |
| 16 and 17 Years | 47 (81.0%) | 108 (100.0%) |
| 18 to 24 Years | 141 (82.5%) | 127 (97.0%) |
| 25 to 34 Years | 192 (90.6%) | 270 (85.4%) |
| 35 to 44 Years | 282 (96.3%) | 231 (95.9%) |
| 45 to 54 Years | 218 (98.2%) | 426 (96.8%) |
| 55 to 64 Years | 150 (90.4%) | 287 (90.0%) |
| 65 to 74 Years | 78 (100.0%) | 89 (88.1%) |
| 75 Years and over | 36 (66.7%) | 93 (84.6%) |
| Total | 1,418 (86.1%) | 1,914 (91.3%) |
Income Below Poverty Among Married-Couple Families in Burnham
The poverty statistics for married-couple families in Burnham show that 6.9% or 27 of the total 393 families live below the poverty line. Families with 3 or 4 children have the highest poverty rate of 15.4%, comprising of 4 families. On the other hand, families with 5 or more children have the lowest poverty rate of 0.0%, which includes 0 families.
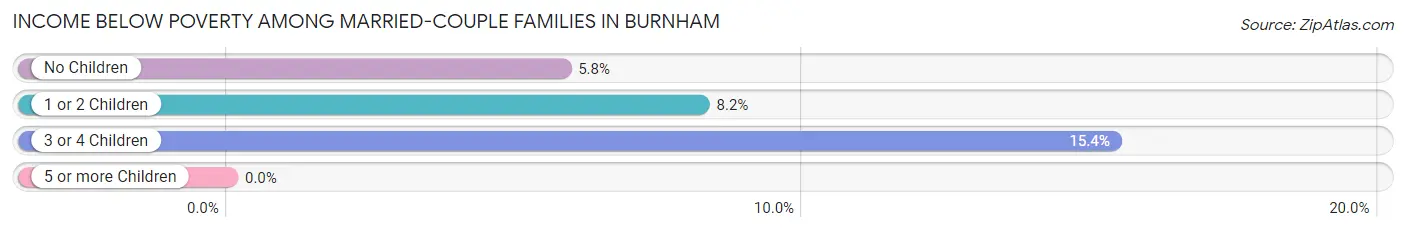
| Children | Above Poverty | Below Poverty |
| No Children | 195 (94.2%) | 12 (5.8%) |
| 1 or 2 Children | 123 (91.8%) | 11 (8.2%) |
| 3 or 4 Children | 22 (84.6%) | 4 (15.4%) |
| 5 or more Children | 26 (100.0%) | 0 (0.0%) |
| Total | 366 (93.1%) | 27 (6.9%) |
Income Below Poverty Among Single-Parent Households in Burnham
According to the poverty data in Burnham, 11.1% or 4 single-father households and 10.8% or 42 single-mother households are living below the poverty line. Among single-father households, those with no children have the highest poverty rate, with 4 households (19.1%) experiencing poverty. Likewise, among single-mother households, those with 5 or more children have the highest poverty rate, with 10 households (100.0%) falling below the poverty line.
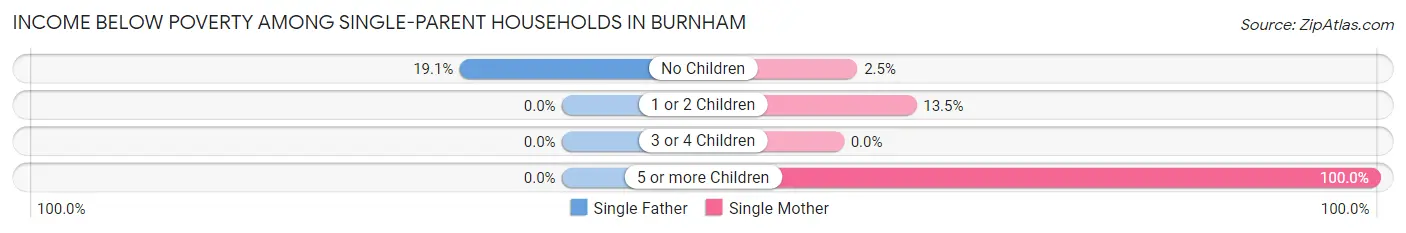
| Children | Single Father | Single Mother |
| No Children | 4 (19.1%) | 4 (2.5%) |
| 1 or 2 Children | 0 (0.0%) | 28 (13.5%) |
| 3 or 4 Children | 0 (0.0%) | 0 (0.0%) |
| 5 or more Children | 0 (0.0%) | 10 (100.0%) |
| Total | 4 (11.1%) | 42 (10.8%) |
Income Below Poverty Among Married-Couple vs Single-Parent Households in Burnham
The poverty data for Burnham shows that 27 of the married-couple family households (6.9%) and 46 of the single-parent households (10.8%) are living below the poverty level. Within the married-couple family households, those with 3 or 4 children have the highest poverty rate, with 4 households (15.4%) falling below the poverty line. Among the single-parent households, those with 5 or more children have the highest poverty rate, with 10 household (100.0%) living below poverty.
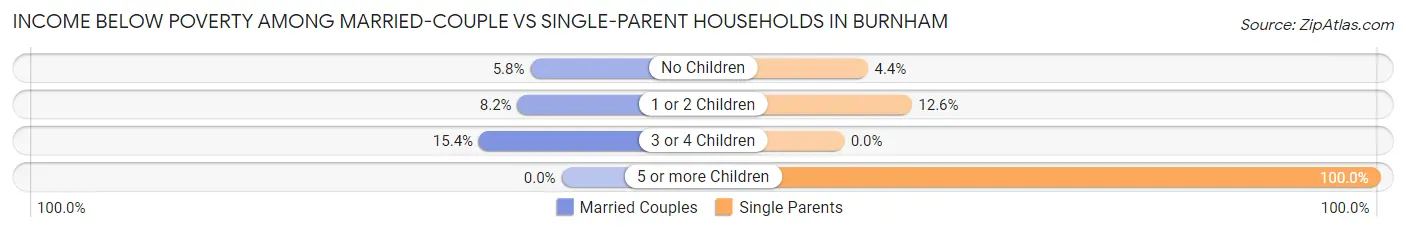
| Children | Married-Couple Families | Single-Parent Households |
| No Children | 12 (5.8%) | 8 (4.4%) |
| 1 or 2 Children | 11 (8.2%) | 28 (12.6%) |
| 3 or 4 Children | 4 (15.4%) | 0 (0.0%) |
| 5 or more Children | 0 (0.0%) | 10 (100.0%) |
| Total | 27 (6.9%) | 46 (10.8%) |
Race in Burnham
The most populous races in Burnham are Black / African American (2,634 | 65.4%), Hispanic or Latino (958 | 23.8%), and White / Caucasian (722 | 17.9%).
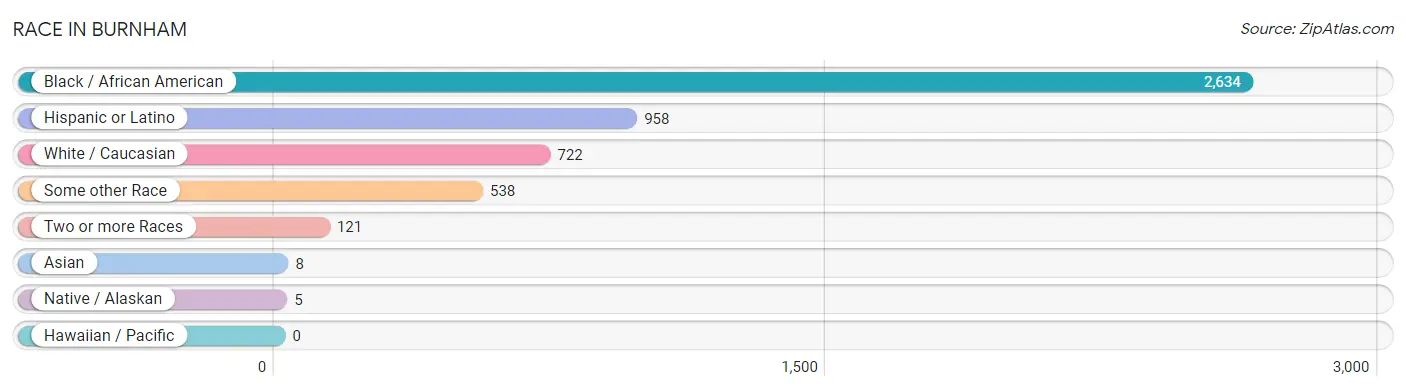
| Race | # Population | % Population |
| Asian | 8 | 0.2% |
| Black / African American | 2,634 | 65.4% |
| Hawaiian / Pacific | 0 | 0.0% |
| Hispanic or Latino | 958 | 23.8% |
| Native / Alaskan | 5 | 0.1% |
| White / Caucasian | 722 | 17.9% |
| Two or more Races | 121 | 3.0% |
| Some other Race | 538 | 13.4% |
| Total | 4,028 | 100.0% |
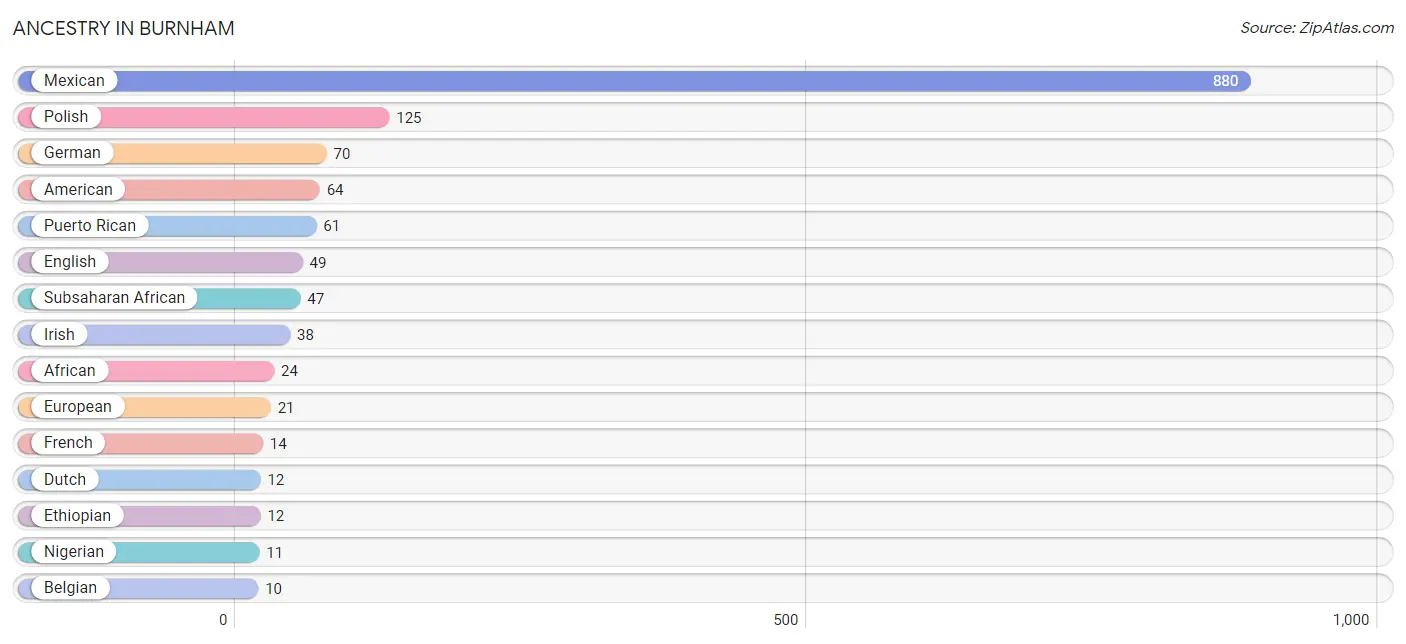
Ancestry in Burnham
The most populous ancestries reported in Burnham are Mexican (880 | 21.8%), Polish (125 | 3.1%), German (70 | 1.7%), American (64 | 1.6%), and Puerto Rican (61 | 1.5%), together accounting for 29.8% of all Burnham residents.
| Ancestry | # Population | % Population |
| African | 24 | 0.6% |
| American | 64 | 1.6% |
| Belgian | 10 | 0.3% |
| Central American | 8 | 0.2% |
| Creek | 7 | 0.2% |
| Dutch | 12 | 0.3% |
| Ecuadorian | 9 | 0.2% |
| English | 49 | 1.2% |
| Ethiopian | 12 | 0.3% |
| European | 21 | 0.5% |
| French | 14 | 0.4% |
| German | 70 | 1.7% |
| Greek | 4 | 0.1% |
| Irish | 38 | 0.9% |
| Italian | 3 | 0.1% |
| Jamaican | 3 | 0.1% |
| Korean | 8 | 0.2% |
| Lithuanian | 3 | 0.1% |
| Mexican | 880 | 21.8% |
| Nigerian | 11 | 0.3% |
| Norwegian | 10 | 0.3% |
| Panamanian | 8 | 0.2% |
| Polish | 125 | 3.1% |
| Puerto Rican | 61 | 1.5% |
| Russian | 1 | 0.0% |
| Scottish | 7 | 0.2% |
| South American | 9 | 0.2% |
| Subsaharan African | 47 | 1.2% | View All 28 Rows |
Immigrants in Burnham
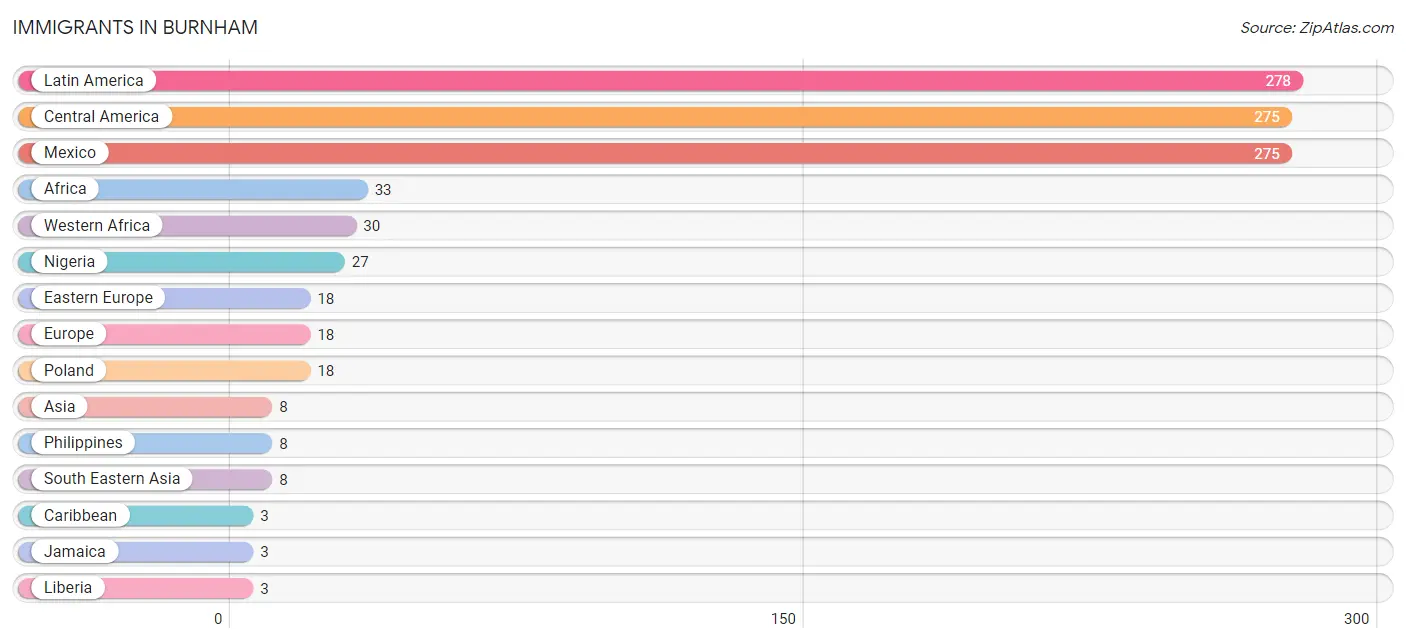
The most numerous immigrant groups reported in Burnham came from Latin America (278 | 6.9%), Central America (275 | 6.8%), Mexico (275 | 6.8%), Africa (33 | 0.8%), and Western Africa (30 | 0.7%), together accounting for 22.1% of all Burnham residents.
| Immigration Origin | # Population | % Population |
| Africa | 33 | 0.8% |
| Asia | 8 | 0.2% |
| Caribbean | 3 | 0.1% |
| Central America | 275 | 6.8% |
| Eastern Europe | 18 | 0.4% |
| Europe | 18 | 0.4% |
| Jamaica | 3 | 0.1% |
| Latin America | 278 | 6.9% |
| Liberia | 3 | 0.1% |
| Mexico | 275 | 6.8% |
| Nigeria | 27 | 0.7% |
| Philippines | 8 | 0.2% |
| Poland | 18 | 0.4% |
| South Eastern Asia | 8 | 0.2% |
| Western Africa | 30 | 0.7% | View All 15 Rows |
Sex and Age in Burnham
Sex and Age in Burnham
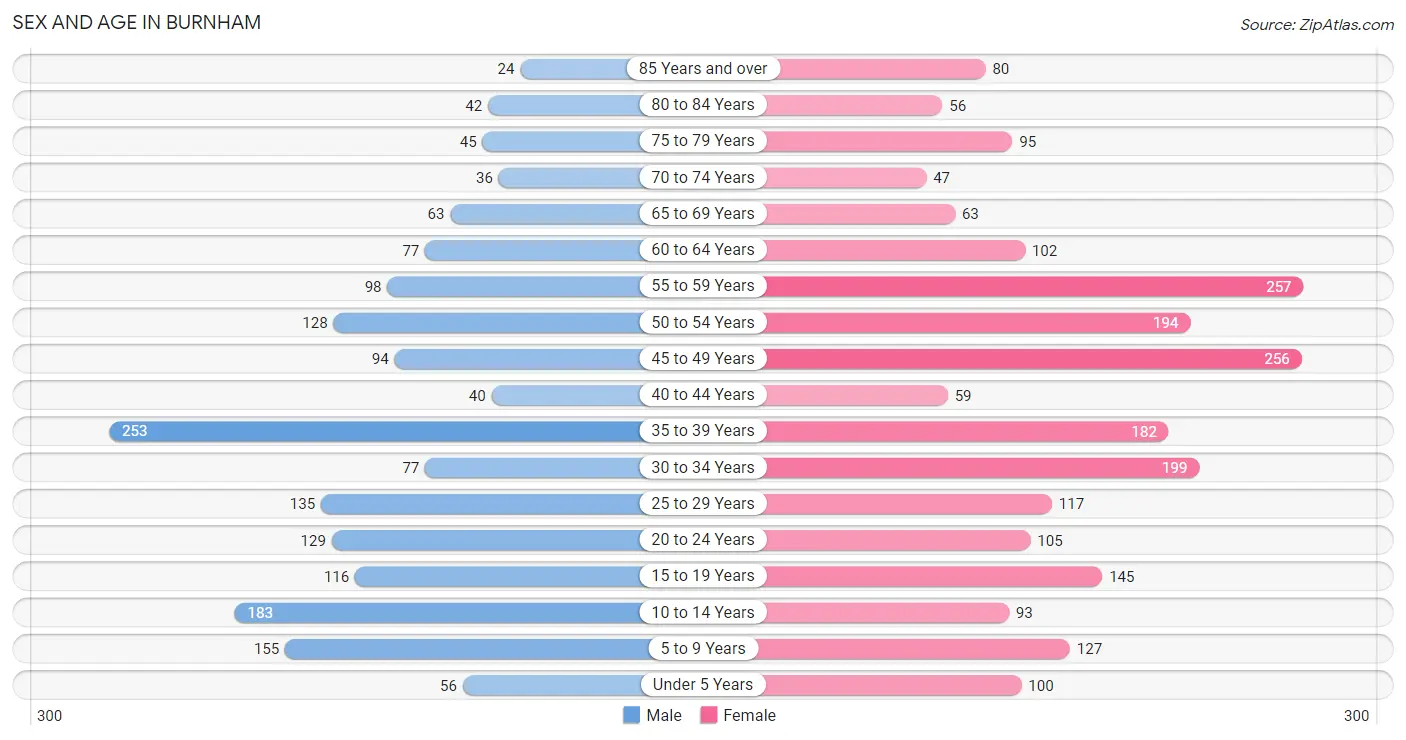
The most populous age groups in Burnham are 35 to 39 Years (253 | 14.4%) for men and 55 to 59 Years (257 | 11.3%) for women.
| Age Bracket | Male | Female |
| Under 5 Years | 56 (3.2%) | 100 (4.4%) |
| 5 to 9 Years | 155 (8.8%) | 127 (5.6%) |
| 10 to 14 Years | 183 (10.4%) | 93 (4.1%) |
| 15 to 19 Years | 116 (6.6%) | 145 (6.4%) |
| 20 to 24 Years | 129 (7.4%) | 105 (4.6%) |
| 25 to 29 Years | 135 (7.7%) | 117 (5.1%) |
| 30 to 34 Years | 77 (4.4%) | 199 (8.7%) |
| 35 to 39 Years | 253 (14.4%) | 182 (8.0%) |
| 40 to 44 Years | 40 (2.3%) | 59 (2.6%) |
| 45 to 49 Years | 94 (5.4%) | 256 (11.2%) |
| 50 to 54 Years | 128 (7.3%) | 194 (8.5%) |
| 55 to 59 Years | 98 (5.6%) | 257 (11.3%) |
| 60 to 64 Years | 77 (4.4%) | 102 (4.5%) |
| 65 to 69 Years | 63 (3.6%) | 63 (2.8%) |
| 70 to 74 Years | 36 (2.1%) | 47 (2.1%) |
| 75 to 79 Years | 45 (2.6%) | 95 (4.2%) |
| 80 to 84 Years | 42 (2.4%) | 56 (2.5%) |
| 85 Years and over | 24 (1.4%) | 80 (3.5%) |
| Total | 1,751 (100.0%) | 2,277 (100.0%) |
Families and Households in Burnham
Median Family Size in Burnham
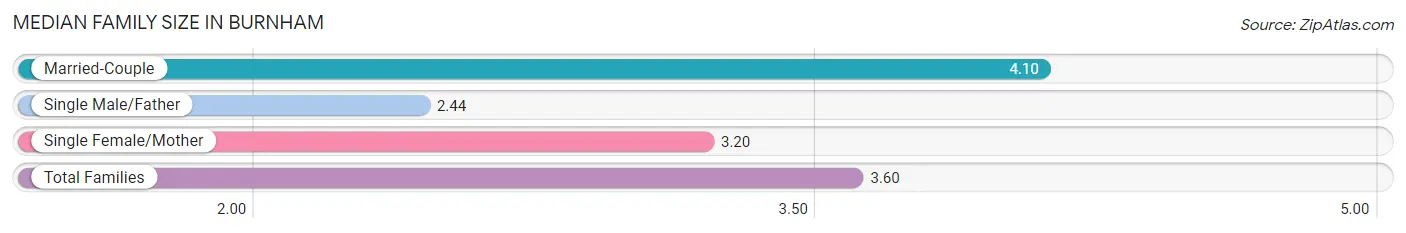
The median family size in Burnham is 3.60 persons per family, with married-couple families (393 | 48.0%) accounting for the largest median family size of 4.1 persons per family. On the other hand, single male/father families (36 | 4.4%) represent the smallest median family size with 2.44 persons per family.
| Family Type | # Families | Family Size |
| Married-Couple | 393 (48.0%) | 4.10 |
| Single Male/Father | 36 (4.4%) | 2.44 |
| Single Female/Mother | 390 (47.6%) | 3.20 |
| Total Families | 819 (100.0%) | 3.60 |
Median Household Size in Burnham
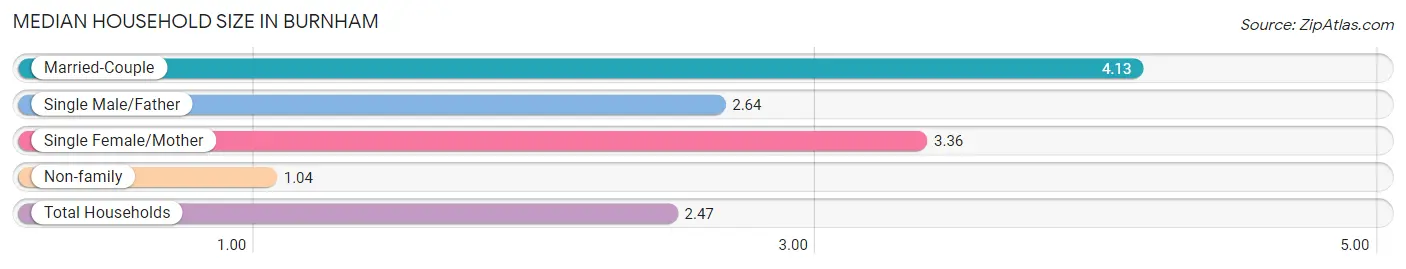
The median household size in Burnham is 2.47 persons per household, with married-couple households (393 | 25.8%) accounting for the largest median household size of 4.13 persons per household. non-family households (703 | 46.2%) represent the smallest median household size with 1.04 persons per household.
| Household Type | # Households | Household Size |
| Married-Couple | 393 (25.8%) | 4.13 |
| Single Male/Father | 36 (2.4%) | 2.64 |
| Single Female/Mother | 390 (25.6%) | 3.36 |
| Non-family | 703 (46.2%) | 1.04 |
| Total Households | 1,522 (100.0%) | 2.47 |
Household Size by Marriage Status in Burnham
Out of a total of 1,522 households in Burnham, 819 (53.8%) are family households, while 703 (46.2%) are nonfamily households. The most numerous type of family households are 2-person households, comprising 333, and the most common type of nonfamily households are 1-person households, comprising 674.
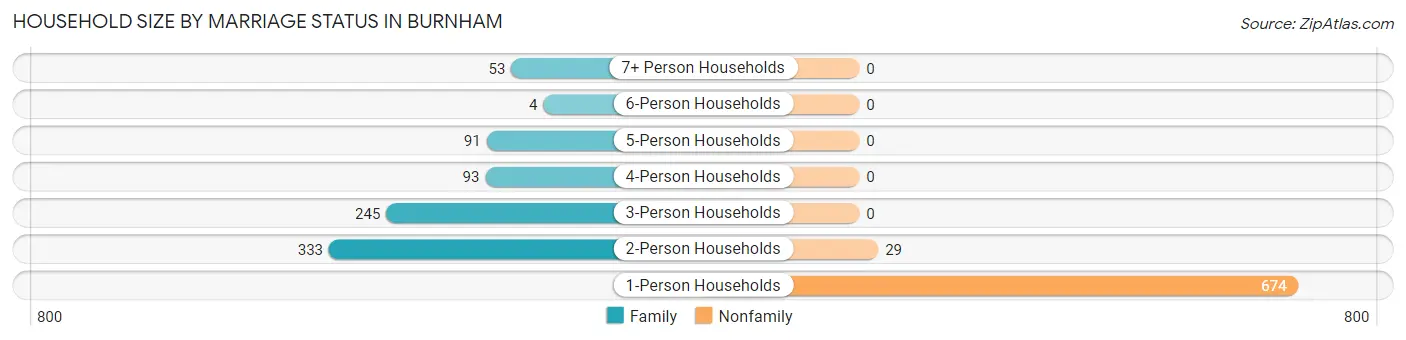
| Household Size | Family Households | Nonfamily Households |
| 1-Person Households | - | 674 (44.3%) |
| 2-Person Households | 333 (21.9%) | 29 (1.9%) |
| 3-Person Households | 245 (16.1%) | 0 (0.0%) |
| 4-Person Households | 93 (6.1%) | 0 (0.0%) |
| 5-Person Households | 91 (6.0%) | 0 (0.0%) |
| 6-Person Households | 4 (0.3%) | 0 (0.0%) |
| 7+ Person Households | 53 (3.5%) | 0 (0.0%) |
| Total | 819 (53.8%) | 703 (46.2%) |
Female Fertility in Burnham
Fertility by Age in Burnham
Average fertility rate in Burnham is 11.0 births per 1,000 women. Women in the age bracket of 20 to 34 years have the highest fertility rate with 29.0 births per 1,000 women. Women in the age bracket of 20 to 34 years acount for 100.0% of all women with births.
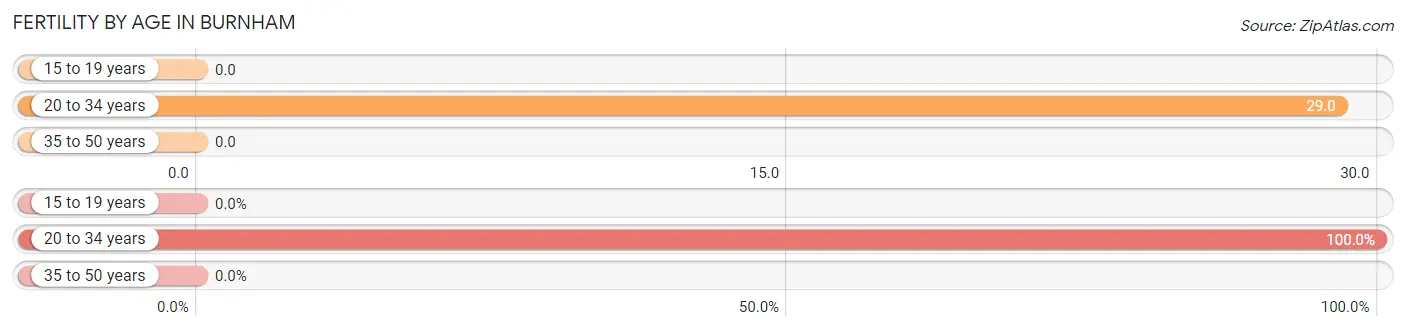
| Age Bracket | Women with Births | Births / 1,000 Women |
| 15 to 19 years | 0 (0.0%) | 0.0 |
| 20 to 34 years | 12 (100.0%) | 29.0 |
| 35 to 50 years | 0 (0.0%) | 0.0 |
| Total | 12 (100.0%) | 11.0 |
Fertility by Age by Marriage Status in Burnham
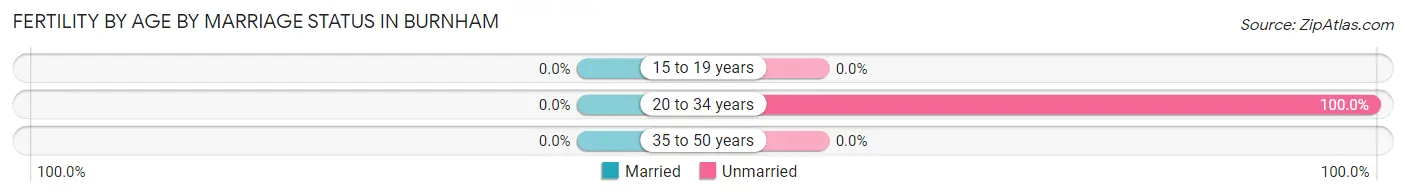
| Age Bracket | Married | Unmarried |
| 15 to 19 years | 0 (0.0%) | 0 (0.0%) |
| 20 to 34 years | 0 (0.0%) | 12 (100.0%) |
| 35 to 50 years | 0 (0.0%) | 0 (0.0%) |
| Total | 0 (0.0%) | 12 (100.0%) |
Fertility by Education in Burnham
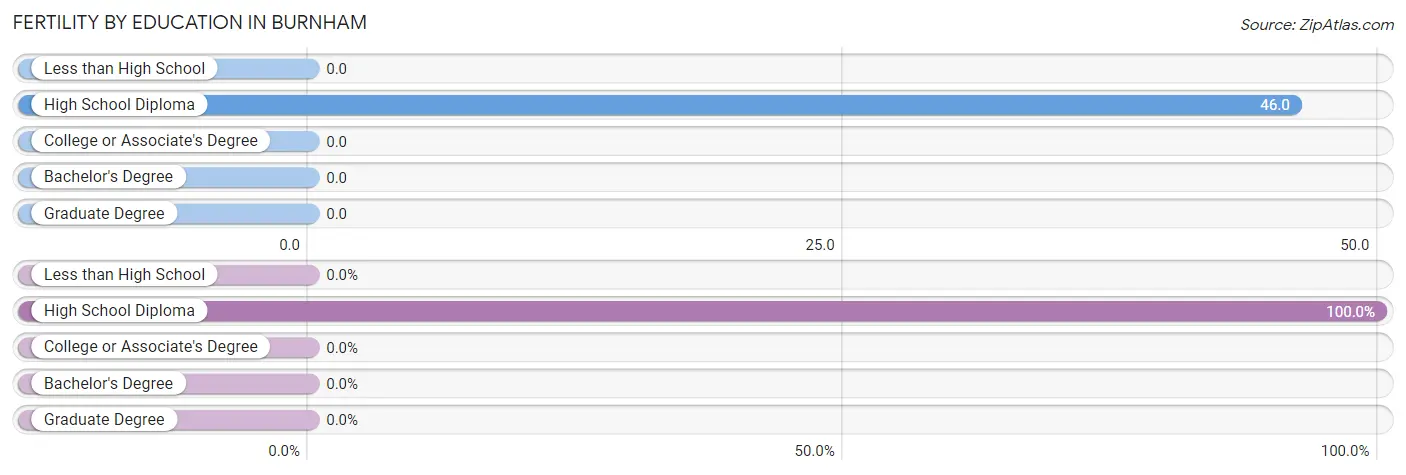
| Educational Attainment | Women with Births | Births / 1,000 Women |
| Less than High School | 0 (0.0%) | 0.0 |
| High School Diploma | 12 (100.0%) | 46.0 |
| College or Associate's Degree | 0 (0.0%) | 0.0 |
| Bachelor's Degree | 0 (0.0%) | 0.0 |
| Graduate Degree | 0 (0.0%) | 0.0 |
| Total | 12 (100.0%) | 11.0 |
Fertility by Education by Marriage Status in Burnham
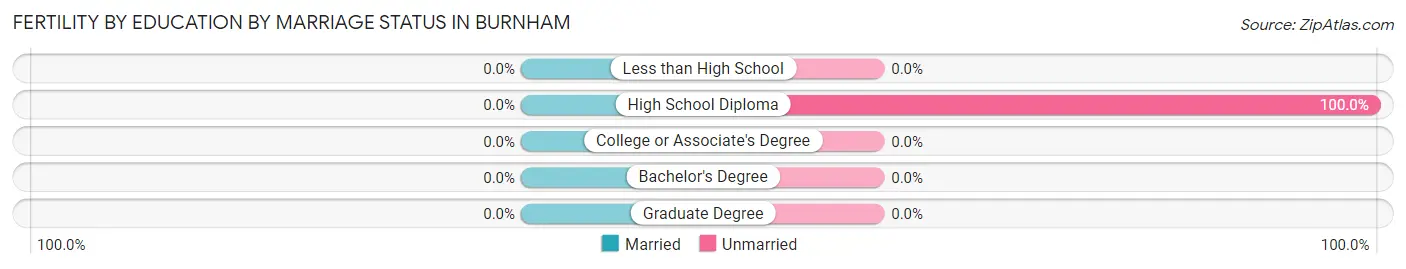
| Educational Attainment | Married | Unmarried |
| Less than High School | 0 (0.0%) | 0 (0.0%) |
| High School Diploma | 0 (0.0%) | 12 (100.0%) |
| College or Associate's Degree | 0 (0.0%) | 0 (0.0%) |
| Bachelor's Degree | 0 (0.0%) | 0 (0.0%) |
| Graduate Degree | 0 (0.0%) | 0 (0.0%) |
| Total | 0 (0.0%) | 12 (100.0%) |
Employment Characteristics in Burnham
Employment by Class of Employer in Burnham
Among the 1,804 employed individuals in Burnham, private company employees (1,080 | 59.9%), not-for-profit organizations (257 | 14.2%), and local government employees (125 | 6.9%) make up the most common classes of employment.
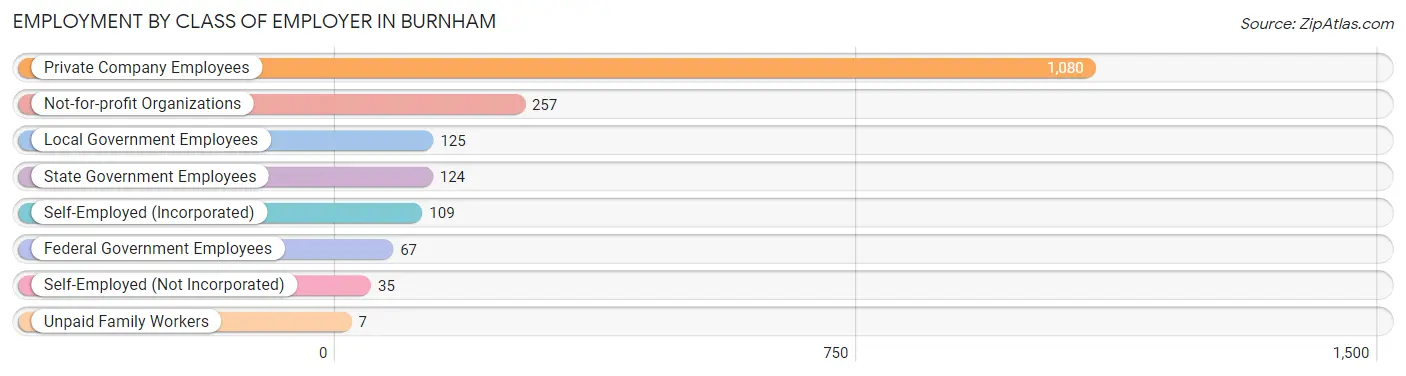
| Employer Class | # Employees | % Employees |
| Private Company Employees | 1,080 | 59.9% |
| Self-Employed (Incorporated) | 109 | 6.0% |
| Self-Employed (Not Incorporated) | 35 | 1.9% |
| Not-for-profit Organizations | 257 | 14.2% |
| Local Government Employees | 125 | 6.9% |
| State Government Employees | 124 | 6.9% |
| Federal Government Employees | 67 | 3.7% |
| Unpaid Family Workers | 7 | 0.4% |
| Total | 1,804 | 100.0% |
Employment Status by Age in Burnham
According to the labor force statistics for Burnham, out of the total population over 16 years of age (3,287), 65.1% or 2,140 individuals are in the labor force, with 12.3% or 263 of them unemployed. The age group with the highest labor force participation rate is 45 to 54 years, with 93.6% or 629 individuals in the labor force. Within the labor force, the 20 to 24 years age range has the highest percentage of unemployed individuals, with 59.0% or 98 of them being unemployed.
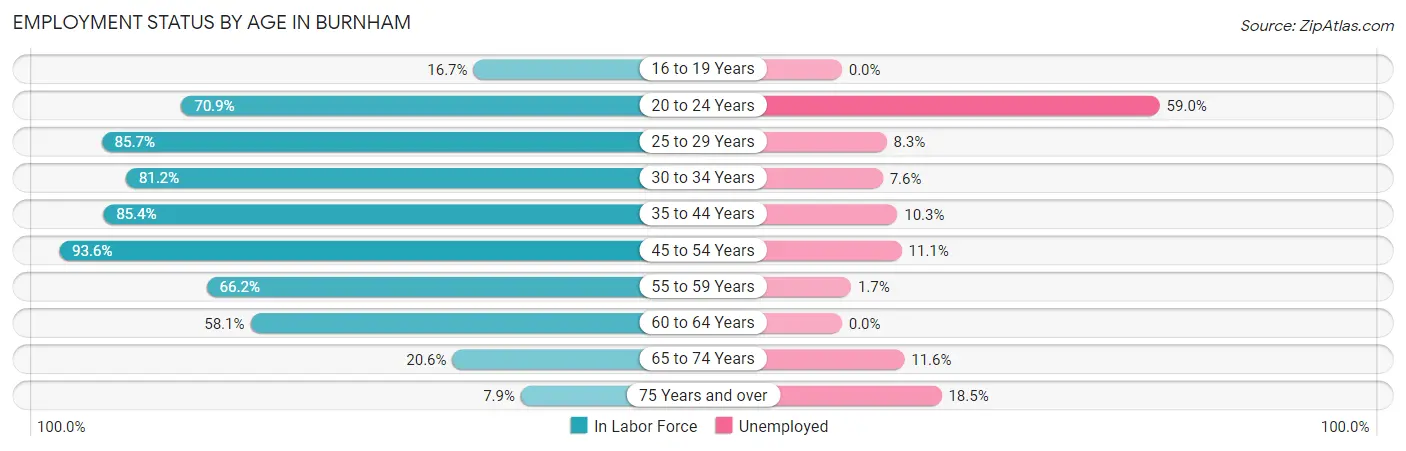
| Age Bracket | In Labor Force | Unemployed |
| 16 to 19 Years | 39 (16.7%) | 0 (0.0%) |
| 20 to 24 Years | 166 (70.9%) | 98 (59.0%) |
| 25 to 29 Years | 216 (85.7%) | 18 (8.3%) |
| 30 to 34 Years | 224 (81.2%) | 17 (7.6%) |
| 35 to 44 Years | 456 (85.4%) | 47 (10.3%) |
| 45 to 54 Years | 629 (93.6%) | 70 (11.1%) |
| 55 to 59 Years | 235 (66.2%) | 4 (1.7%) |
| 60 to 64 Years | 104 (58.1%) | 0 (0.0%) |
| 65 to 74 Years | 43 (20.6%) | 5 (11.6%) |
| 75 Years and over | 27 (7.9%) | 5 (18.5%) |
| Total | 2,140 (65.1%) | 263 (12.3%) |
Employment Status by Educational Attainment in Burnham
According to labor force statistics for Burnham, 82.2% of individuals (1,864) out of the total population between 25 and 64 years of age (2,268) are in the labor force, with 8.4% or 157 of them being unemployed. The group with the highest labor force participation rate are those with the educational attainment of bachelor's degree or higher, with 91.9% or 330 individuals in the labor force. Within the labor force, individuals with less than high school education have the highest percentage of unemployment, with 12.6% or 24 of them being unemployed.
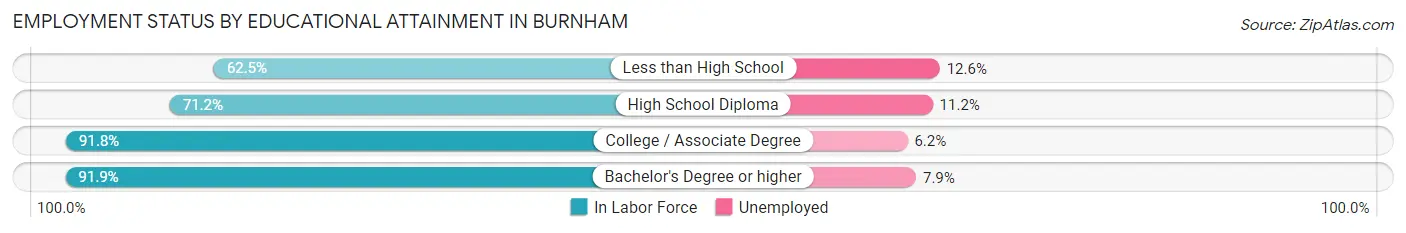
| Educational Attainment | In Labor Force | Unemployed |
| Less than High School | 190 (62.5%) | 38 (12.6%) |
| High School Diploma | 447 (71.2%) | 70 (11.2%) |
| College / Associate Degree | 897 (91.8%) | 61 (6.2%) |
| Bachelor's Degree or higher | 330 (91.9%) | 28 (7.9%) |
| Total | 1,864 (82.2%) | 191 (8.4%) |
Employment Occupations by Sex in Burnham
Management, Business, Science and Arts Occupations
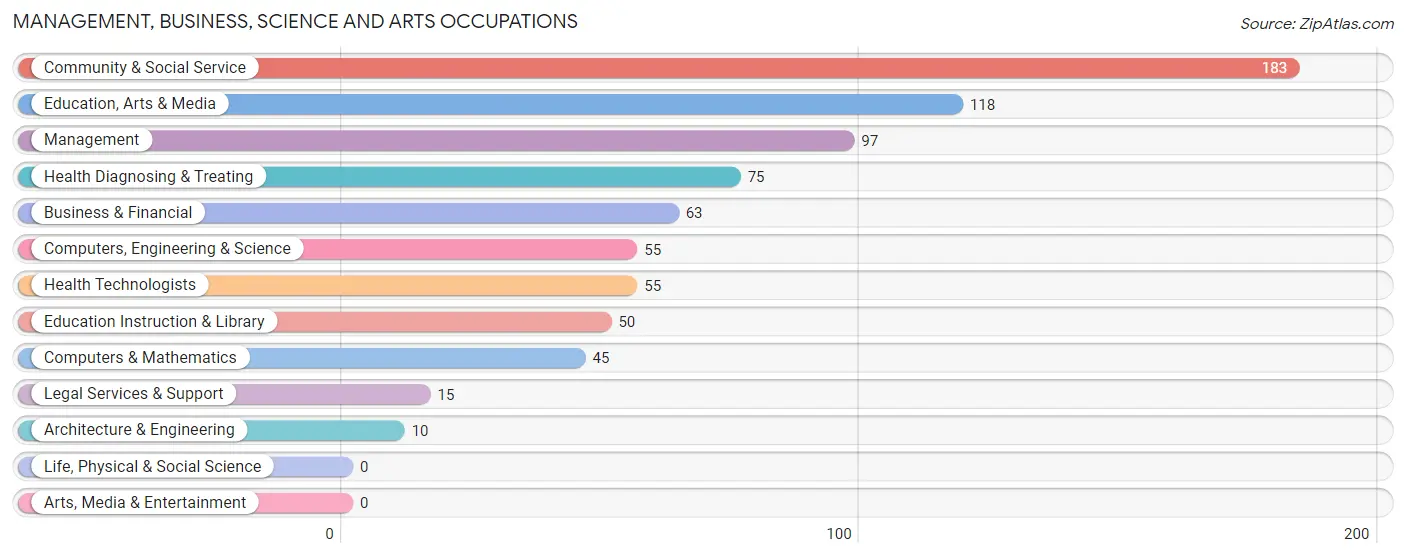
The most common Management, Business, Science and Arts occupations in Burnham are Community & Social Service (183 | 9.8%), Education, Arts & Media (118 | 6.3%), Management (97 | 5.2%), Health Diagnosing & Treating (75 | 4.0%), and Business & Financial (63 | 3.4%).
Management, Business, Science and Arts Occupations by Sex
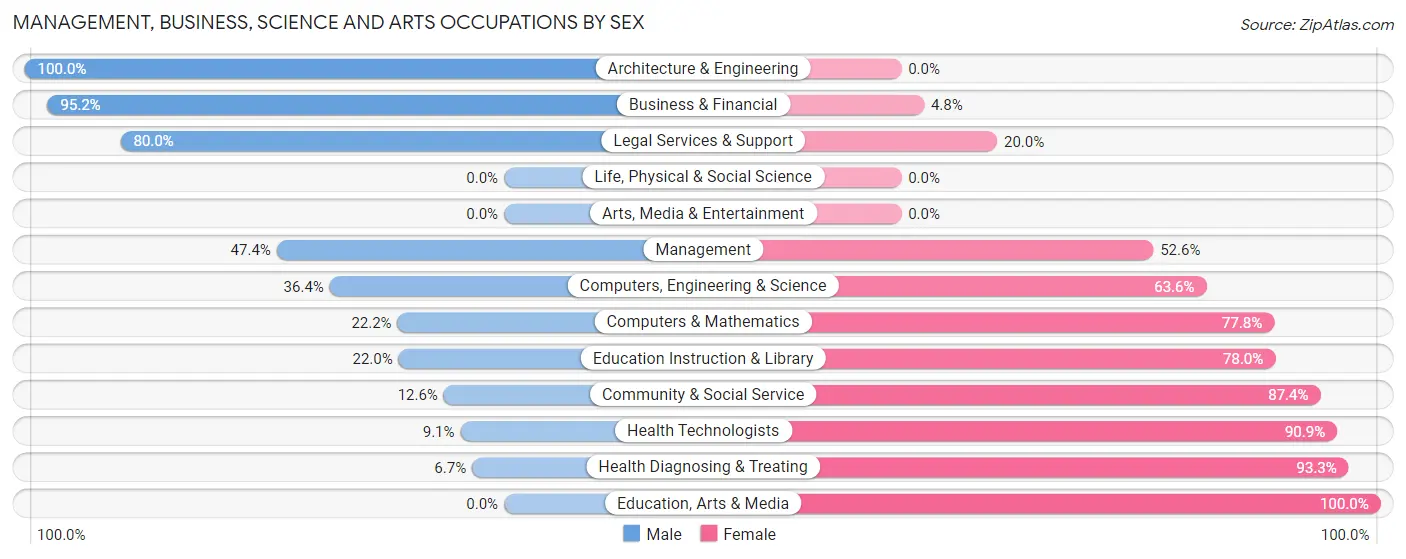
Within the Management, Business, Science and Arts occupations in Burnham, the most male-oriented occupations are Architecture & Engineering (100.0%), Business & Financial (95.2%), and Legal Services & Support (80.0%), while the most female-oriented occupations are Education, Arts & Media (100.0%), Health Diagnosing & Treating (93.3%), and Health Technologists (90.9%).
| Occupation | Male | Female |
| Management | 46 (47.4%) | 51 (52.6%) |
| Business & Financial | 60 (95.2%) | 3 (4.8%) |
| Computers, Engineering & Science | 20 (36.4%) | 35 (63.6%) |
| Computers & Mathematics | 10 (22.2%) | 35 (77.8%) |
| Architecture & Engineering | 10 (100.0%) | 0 (0.0%) |
| Life, Physical & Social Science | 0 (0.0%) | 0 (0.0%) |
| Community & Social Service | 23 (12.6%) | 160 (87.4%) |
| Education, Arts & Media | 0 (0.0%) | 118 (100.0%) |
| Legal Services & Support | 12 (80.0%) | 3 (20.0%) |
| Education Instruction & Library | 11 (22.0%) | 39 (78.0%) |
| Arts, Media & Entertainment | 0 (0.0%) | 0 (0.0%) |
| Health Diagnosing & Treating | 5 (6.7%) | 70 (93.3%) |
| Health Technologists | 5 (9.1%) | 50 (90.9%) |
| Total (Category) | 154 (32.6%) | 319 (67.4%) |
| Total (Overall) | 835 (44.5%) | 1,040 (55.5%) |
Services Occupations
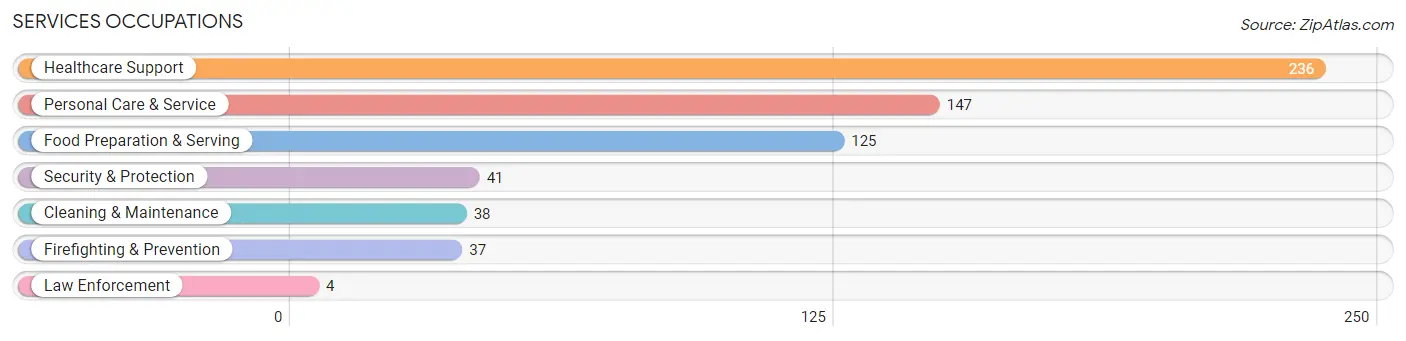
The most common Services occupations in Burnham are Healthcare Support (236 | 12.6%), Personal Care & Service (147 | 7.8%), Food Preparation & Serving (125 | 6.7%), Security & Protection (41 | 2.2%), and Cleaning & Maintenance (38 | 2.0%).
Services Occupations by Sex
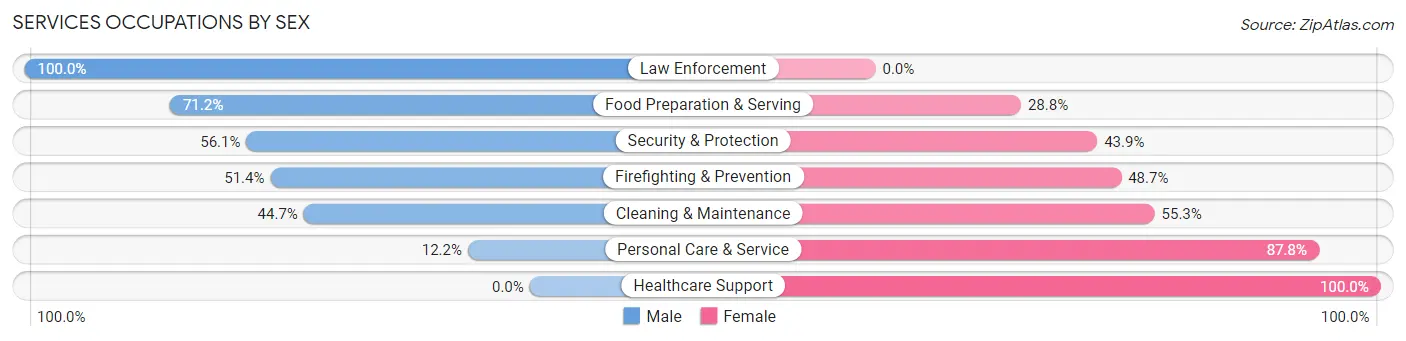
Within the Services occupations in Burnham, the most male-oriented occupations are Law Enforcement (100.0%), Food Preparation & Serving (71.2%), and Security & Protection (56.1%), while the most female-oriented occupations are Healthcare Support (100.0%), Personal Care & Service (87.8%), and Cleaning & Maintenance (55.3%).
| Occupation | Male | Female |
| Healthcare Support | 0 (0.0%) | 236 (100.0%) |
| Security & Protection | 23 (56.1%) | 18 (43.9%) |
| Firefighting & Prevention | 19 (51.3%) | 18 (48.6%) |
| Law Enforcement | 4 (100.0%) | 0 (0.0%) |
| Food Preparation & Serving | 89 (71.2%) | 36 (28.8%) |
| Cleaning & Maintenance | 17 (44.7%) | 21 (55.3%) |
| Personal Care & Service | 18 (12.2%) | 129 (87.8%) |
| Total (Category) | 147 (25.0%) | 440 (75.0%) |
| Total (Overall) | 835 (44.5%) | 1,040 (55.5%) |
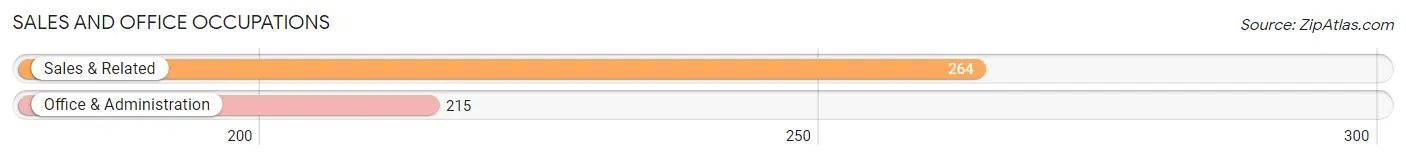
Sales and Office Occupations
The most common Sales and Office occupations in Burnham are Sales & Related (264 | 14.1%), and Office & Administration (215 | 11.5%).
Sales and Office Occupations by Sex
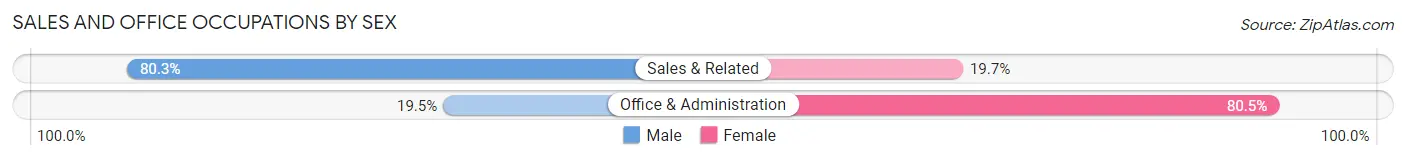
| Occupation | Male | Female |
| Sales & Related | 212 (80.3%) | 52 (19.7%) |
| Office & Administration | 42 (19.5%) | 173 (80.5%) |
| Total (Category) | 254 (53.0%) | 225 (47.0%) |
| Total (Overall) | 835 (44.5%) | 1,040 (55.5%) |
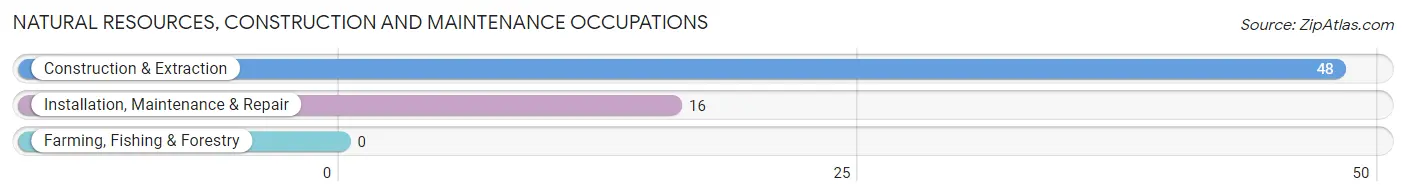
Natural Resources, Construction and Maintenance Occupations
The most common Natural Resources, Construction and Maintenance occupations in Burnham are Construction & Extraction (48 | 2.6%), and Installation, Maintenance & Repair (16 | 0.9%).
Natural Resources, Construction and Maintenance Occupations by Sex
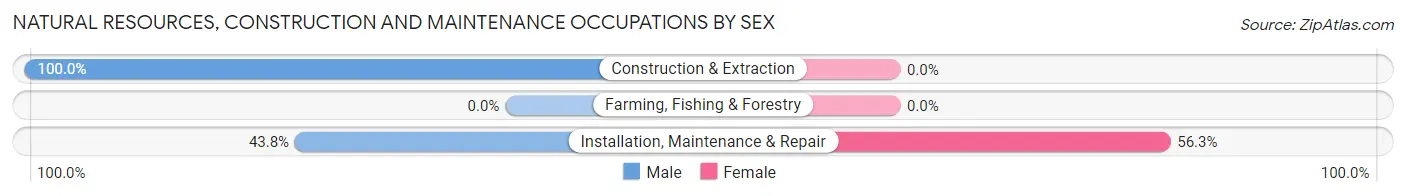
| Occupation | Male | Female |
| Farming, Fishing & Forestry | 0 (0.0%) | 0 (0.0%) |
| Construction & Extraction | 48 (100.0%) | 0 (0.0%) |
| Installation, Maintenance & Repair | 7 (43.8%) | 9 (56.2%) |
| Total (Category) | 55 (85.9%) | 9 (14.1%) |
| Total (Overall) | 835 (44.5%) | 1,040 (55.5%) |
Production, Transportation and Moving Occupations
The most common Production, Transportation and Moving occupations in Burnham are Material Moving (118 | 6.3%), Production (90 | 4.8%), and Transportation (64 | 3.4%).
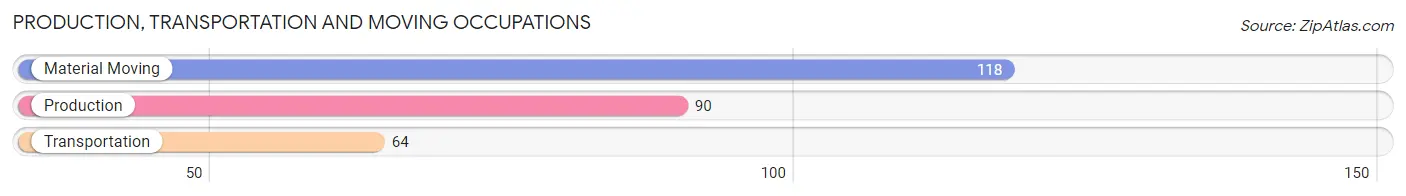
Production, Transportation and Moving Occupations by Sex
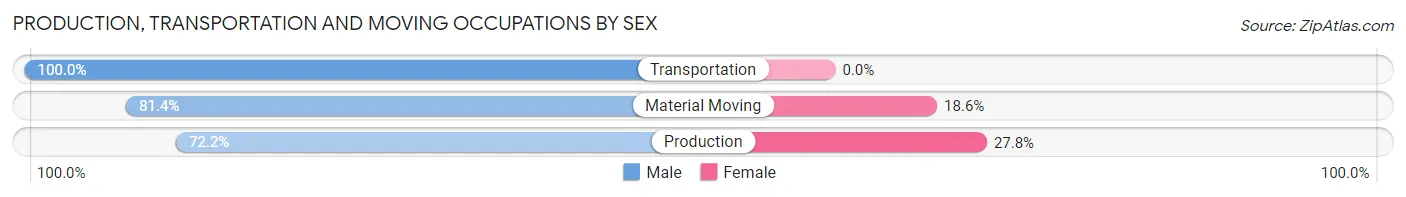
| Occupation | Male | Female |
| Production | 65 (72.2%) | 25 (27.8%) |
| Transportation | 64 (100.0%) | 0 (0.0%) |
| Material Moving | 96 (81.4%) | 22 (18.6%) |
| Total (Category) | 225 (82.7%) | 47 (17.3%) |
| Total (Overall) | 835 (44.5%) | 1,040 (55.5%) |
Employment Industries by Sex in Burnham
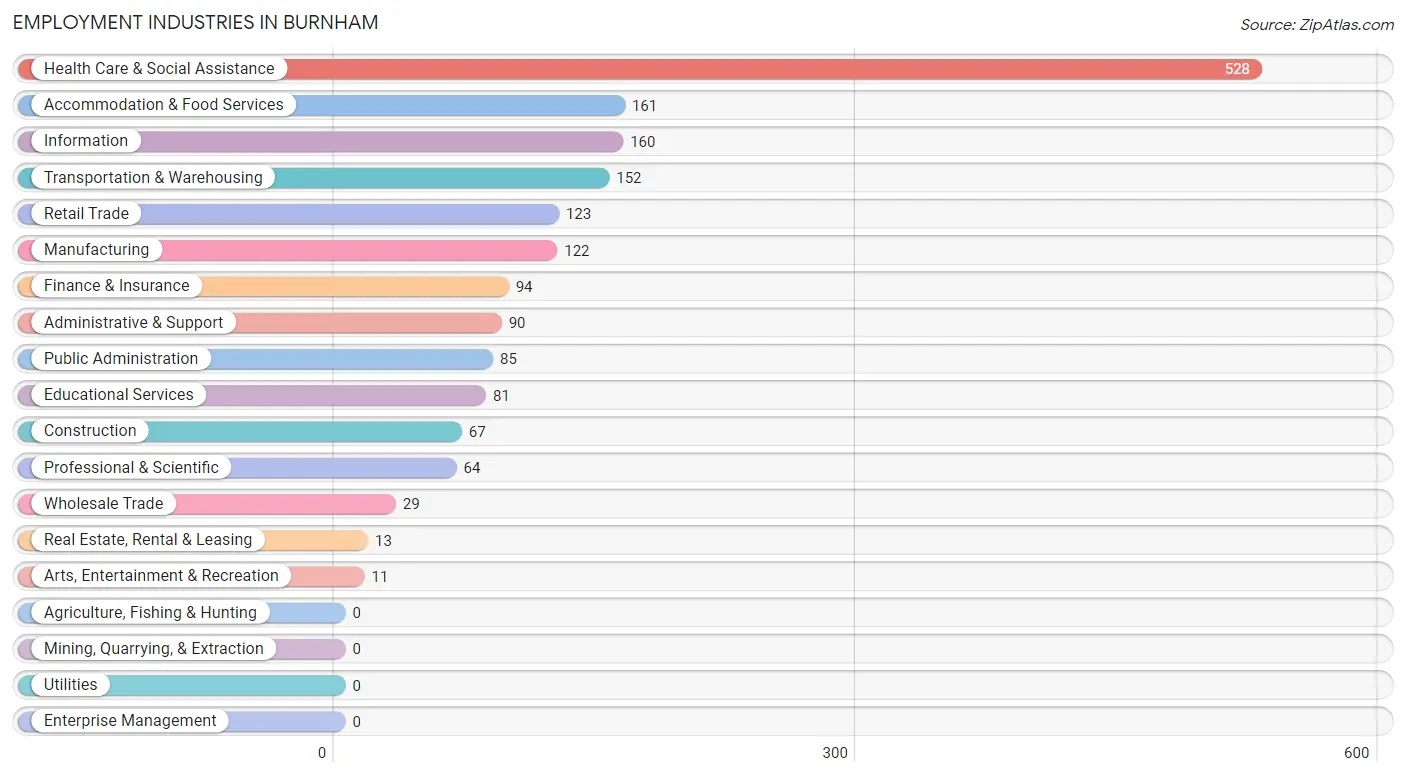
Employment Industries in Burnham
The major employment industries in Burnham include Health Care & Social Assistance (528 | 28.2%), Accommodation & Food Services (161 | 8.6%), Information (160 | 8.5%), Transportation & Warehousing (152 | 8.1%), and Retail Trade (123 | 6.6%).
Employment Industries by Sex in Burnham
The Burnham industries that see more men than women are Information (100.0%), Real Estate, Rental & Leasing (100.0%), and Construction (86.6%), whereas the industries that tend to have a higher number of women are Health Care & Social Assistance (99.1%), Educational Services (79.0%), and Retail Trade (57.7%).
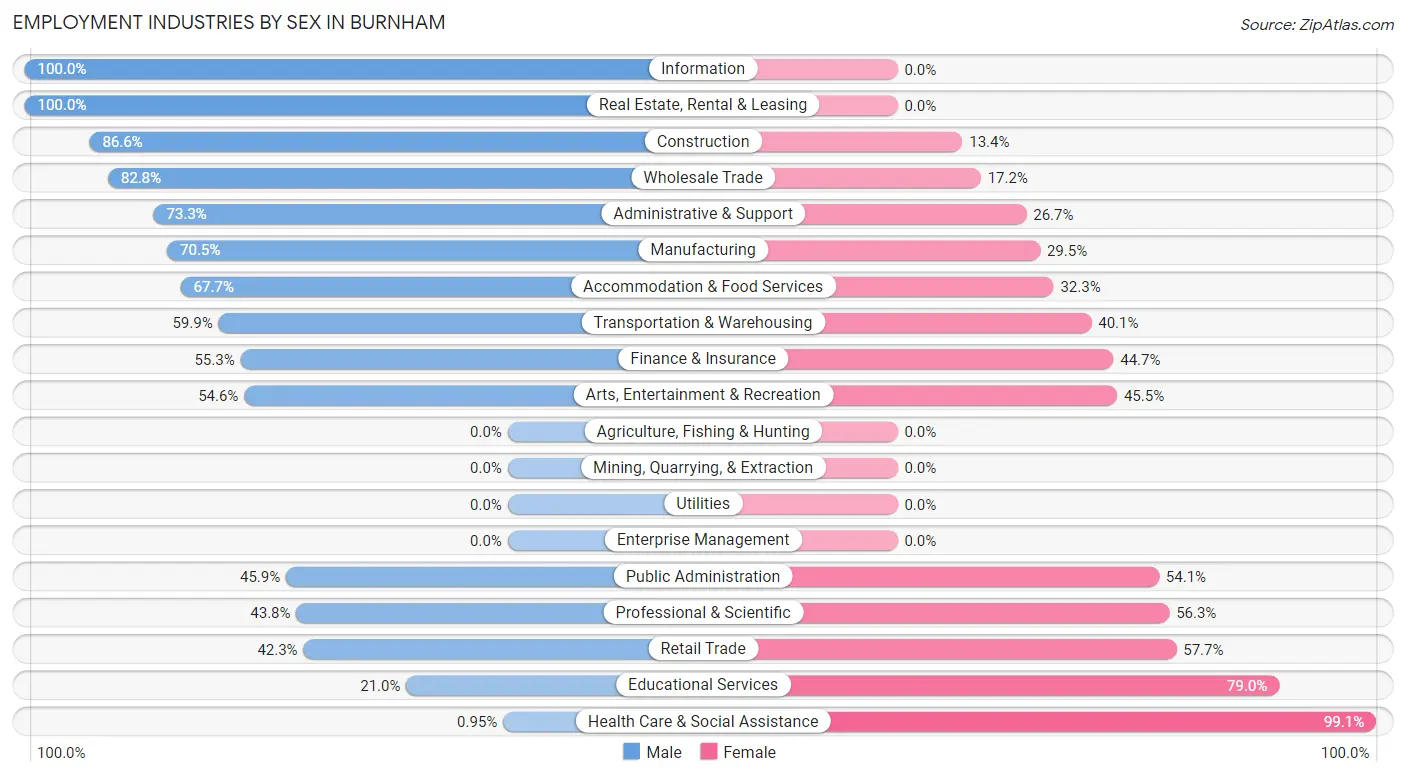
| Industry | Male | Female |
| Agriculture, Fishing & Hunting | 0 (0.0%) | 0 (0.0%) |
| Mining, Quarrying, & Extraction | 0 (0.0%) | 0 (0.0%) |
| Construction | 58 (86.6%) | 9 (13.4%) |
| Manufacturing | 86 (70.5%) | 36 (29.5%) |
| Wholesale Trade | 24 (82.8%) | 5 (17.2%) |
| Retail Trade | 52 (42.3%) | 71 (57.7%) |
| Transportation & Warehousing | 91 (59.9%) | 61 (40.1%) |
| Utilities | 0 (0.0%) | 0 (0.0%) |
| Information | 160 (100.0%) | 0 (0.0%) |
| Finance & Insurance | 52 (55.3%) | 42 (44.7%) |
| Real Estate, Rental & Leasing | 13 (100.0%) | 0 (0.0%) |
| Professional & Scientific | 28 (43.8%) | 36 (56.2%) |
| Enterprise Management | 0 (0.0%) | 0 (0.0%) |
| Administrative & Support | 66 (73.3%) | 24 (26.7%) |
| Educational Services | 17 (21.0%) | 64 (79.0%) |
| Health Care & Social Assistance | 5 (0.9%) | 523 (99.1%) |
| Arts, Entertainment & Recreation | 6 (54.5%) | 5 (45.5%) |
| Accommodation & Food Services | 109 (67.7%) | 52 (32.3%) |
| Public Administration | 39 (45.9%) | 46 (54.1%) |
| Total | 835 (44.5%) | 1,040 (55.5%) |
Education in Burnham
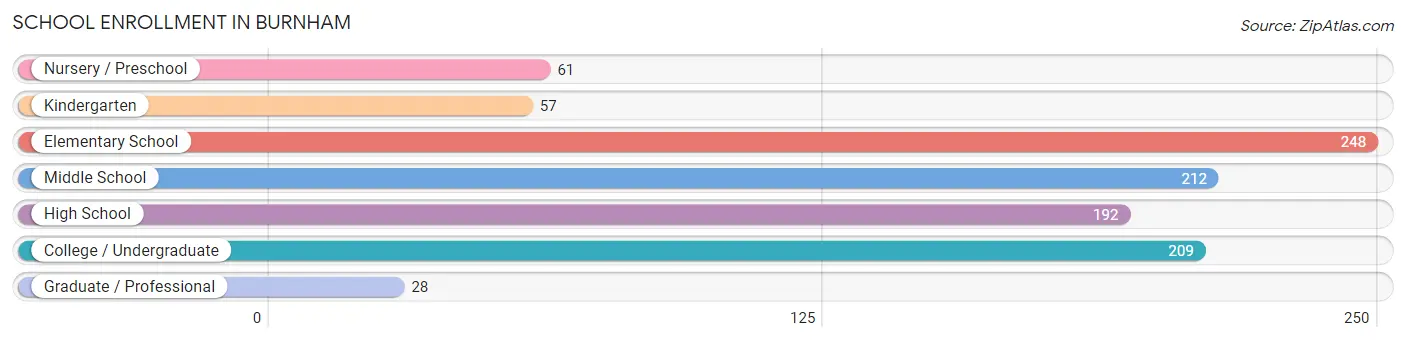
School Enrollment in Burnham
The most common levels of schooling among the 1,007 students in Burnham are elementary school (248 | 24.6%), middle school (212 | 21.0%), and college / undergraduate (209 | 20.7%).
| School Level | # Students | % Students |
| Nursery / Preschool | 61 | 6.1% |
| Kindergarten | 57 | 5.7% |
| Elementary School | 248 | 24.6% |
| Middle School | 212 | 21.0% |
| High School | 192 | 19.1% |
| College / Undergraduate | 209 | 20.7% |
| Graduate / Professional | 28 | 2.8% |
| Total | 1,007 | 100.0% |
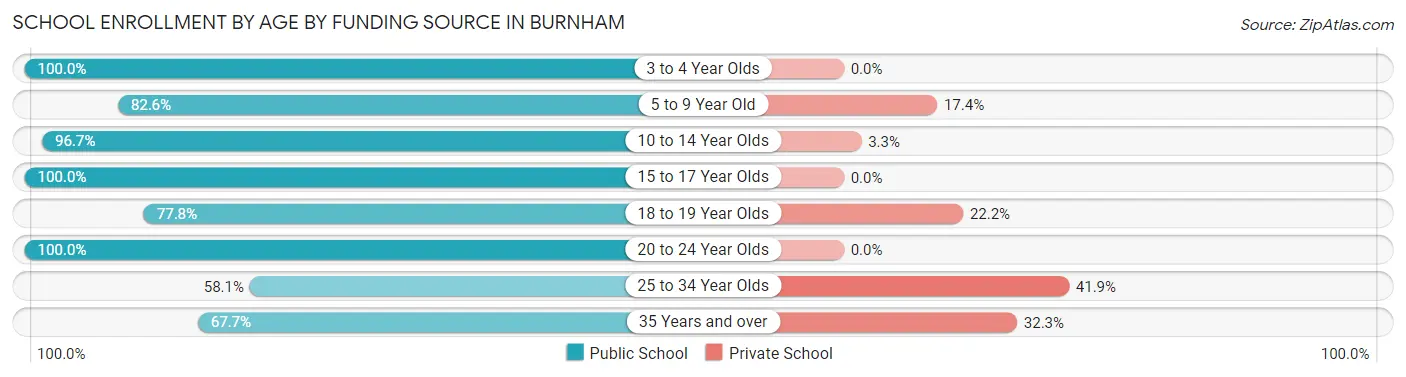
School Enrollment by Age by Funding Source in Burnham
Out of a total of 1,007 students who are enrolled in schools in Burnham, 122 (12.1%) attend a private institution, while the remaining 885 (87.9%) are enrolled in public schools. The age group of 25 to 34 year olds has the highest likelihood of being enrolled in private schools, with 26 (41.9% in the age bracket) enrolled. Conversely, the age group of 3 to 4 year olds has the lowest likelihood of being enrolled in a private school, with 30 (100.0% in the age bracket) attending a public institution.
| Age Bracket | Public School | Private School |
| 3 to 4 Year Olds | 30 (100.0%) | 0 (0.0%) |
| 5 to 9 Year Old | 233 (82.6%) | 49 (17.4%) |
| 10 to 14 Year Olds | 267 (96.7%) | 9 (3.3%) |
| 15 to 17 Year Olds | 182 (100.0%) | 0 (0.0%) |
| 18 to 19 Year Olds | 28 (77.8%) | 8 (22.2%) |
| 20 to 24 Year Olds | 46 (100.0%) | 0 (0.0%) |
| 25 to 34 Year Olds | 36 (58.1%) | 26 (41.9%) |
| 35 Years and over | 63 (67.7%) | 30 (32.3%) |
| Total | 885 (87.9%) | 122 (12.1%) |
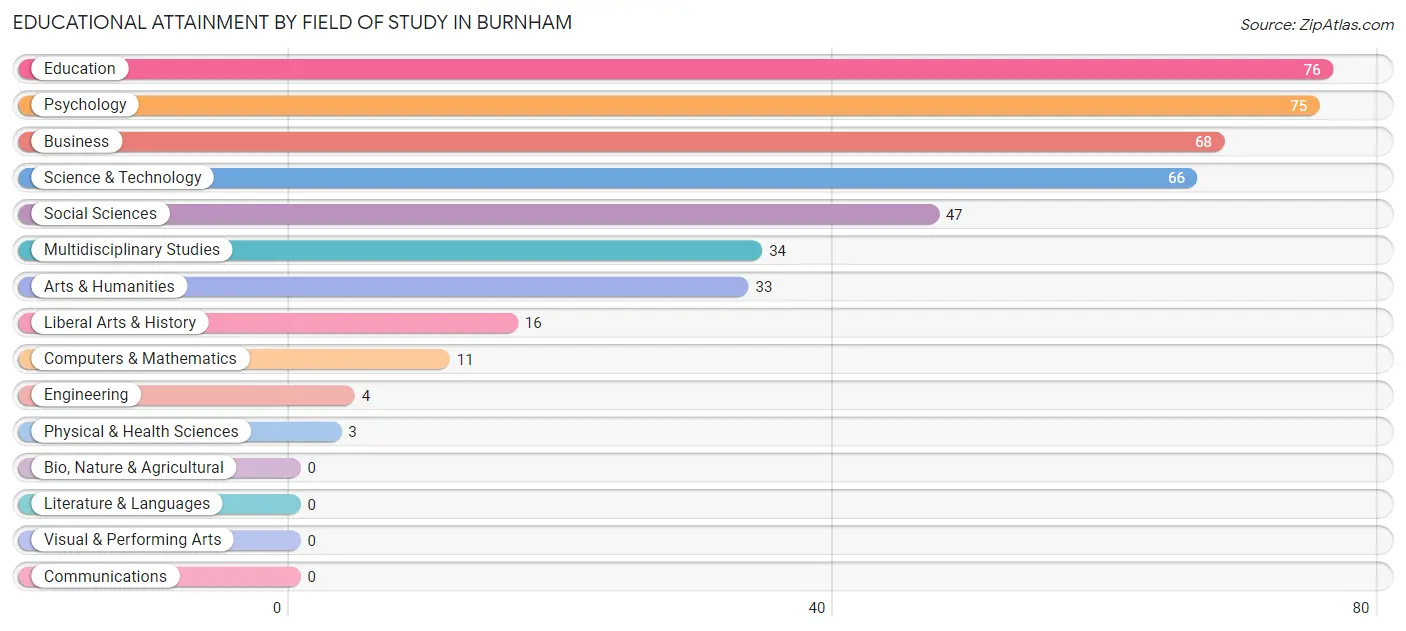
Educational Attainment by Field of Study in Burnham
Education (76 | 17.5%), psychology (75 | 17.3%), business (68 | 15.7%), science & technology (66 | 15.2%), and social sciences (47 | 10.8%) are the most common fields of study among 433 individuals in Burnham who have obtained a bachelor's degree or higher.
| Field of Study | # Graduates | % Graduates |
| Computers & Mathematics | 11 | 2.5% |
| Bio, Nature & Agricultural | 0 | 0.0% |
| Physical & Health Sciences | 3 | 0.7% |
| Psychology | 75 | 17.3% |
| Social Sciences | 47 | 10.8% |
| Engineering | 4 | 0.9% |
| Multidisciplinary Studies | 34 | 7.9% |
| Science & Technology | 66 | 15.2% |
| Business | 68 | 15.7% |
| Education | 76 | 17.5% |
| Literature & Languages | 0 | 0.0% |
| Liberal Arts & History | 16 | 3.7% |
| Visual & Performing Arts | 0 | 0.0% |
| Communications | 0 | 0.0% |
| Arts & Humanities | 33 | 7.6% |
| Total | 433 | 100.0% |
Transportation & Commute in Burnham
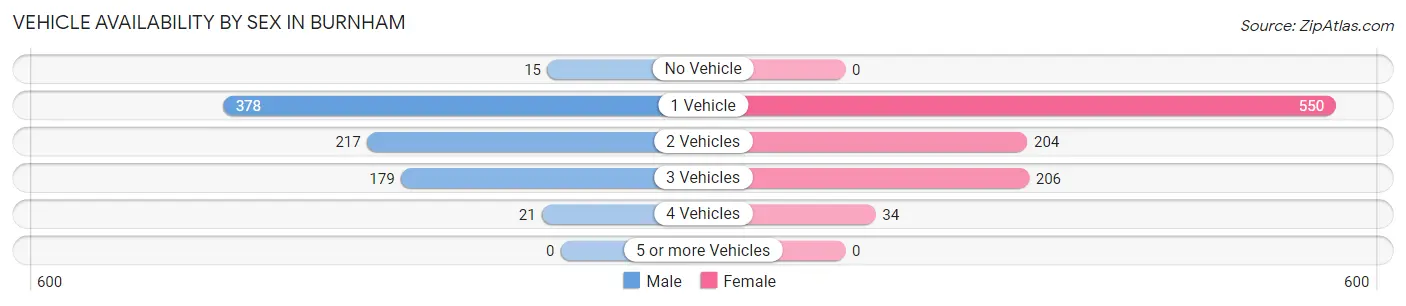
Vehicle Availability by Sex in Burnham
The most prevalent vehicle ownership categories in Burnham are males with 1 vehicle (378, accounting for 46.7%) and females with 1 vehicle (550, making up 38.0%).
| Vehicles Available | Male | Female |
| No Vehicle | 15 (1.8%) | 0 (0.0%) |
| 1 Vehicle | 378 (46.7%) | 550 (55.3%) |
| 2 Vehicles | 217 (26.8%) | 204 (20.5%) |
| 3 Vehicles | 179 (22.1%) | 206 (20.7%) |
| 4 Vehicles | 21 (2.6%) | 34 (3.4%) |
| 5 or more Vehicles | 0 (0.0%) | 0 (0.0%) |
| Total | 810 (100.0%) | 994 (100.0%) |
Commute Time in Burnham
The most frequently occuring commute durations in Burnham are 60 to 89 minutes (325 commuters, 20.2%), 10 to 14 minutes (236 commuters, 14.7%), and 20 to 24 minutes (179 commuters, 11.1%).
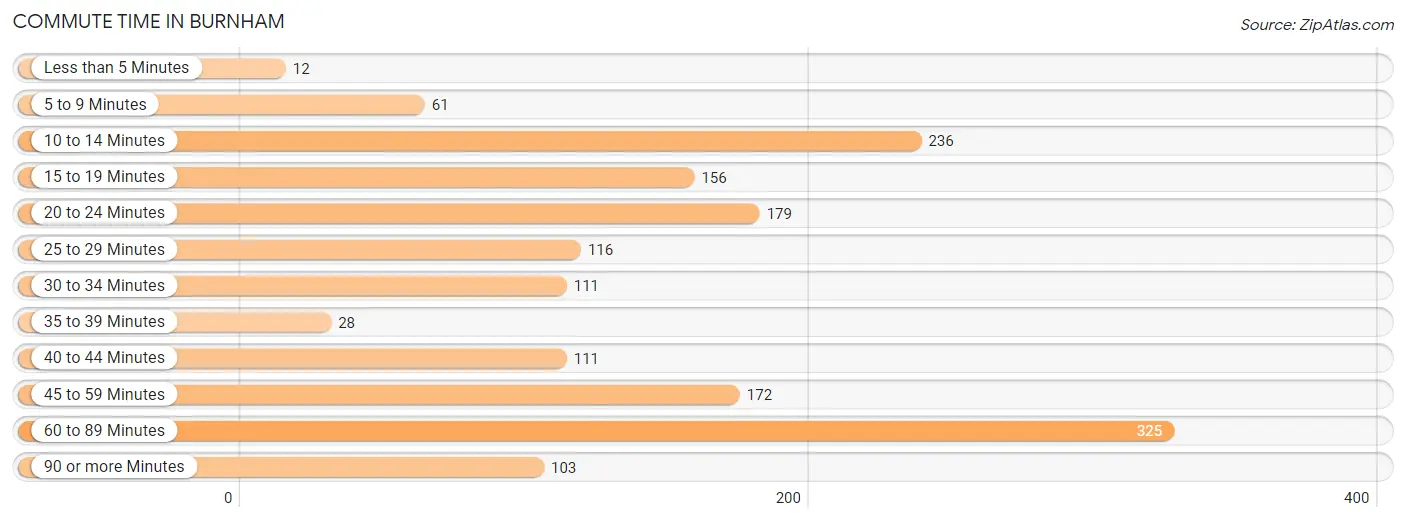
| Commute Time | # Commuters | % Commuters |
| Less than 5 Minutes | 12 | 0.7% |
| 5 to 9 Minutes | 61 | 3.8% |
| 10 to 14 Minutes | 236 | 14.7% |
| 15 to 19 Minutes | 156 | 9.7% |
| 20 to 24 Minutes | 179 | 11.1% |
| 25 to 29 Minutes | 116 | 7.2% |
| 30 to 34 Minutes | 111 | 6.9% |
| 35 to 39 Minutes | 28 | 1.7% |
| 40 to 44 Minutes | 111 | 6.9% |
| 45 to 59 Minutes | 172 | 10.7% |
| 60 to 89 Minutes | 325 | 20.2% |
| 90 or more Minutes | 103 | 6.4% |
Commute Time by Sex in Burnham
The most common commute times in Burnham are 10 to 14 minutes (211 commuters, 27.0%) for males and 60 to 89 minutes (192 commuters, 23.2%) for females.
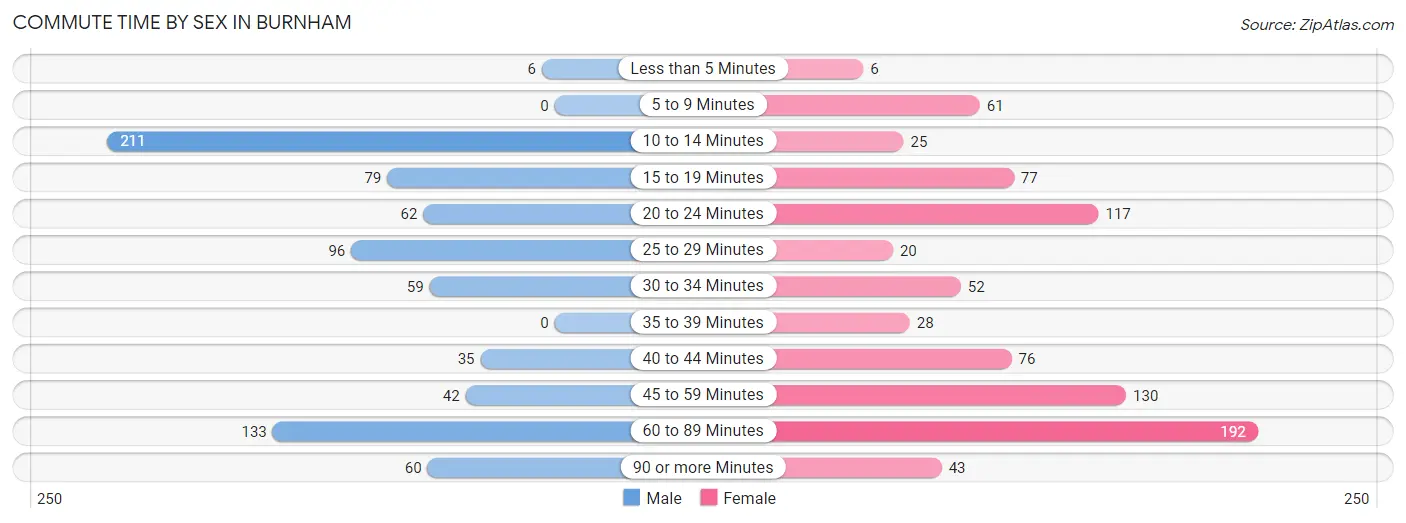
| Commute Time | Male | Female |
| Less than 5 Minutes | 6 (0.8%) | 6 (0.7%) |
| 5 to 9 Minutes | 0 (0.0%) | 61 (7.4%) |
| 10 to 14 Minutes | 211 (27.0%) | 25 (3.0%) |
| 15 to 19 Minutes | 79 (10.1%) | 77 (9.3%) |
| 20 to 24 Minutes | 62 (7.9%) | 117 (14.1%) |
| 25 to 29 Minutes | 96 (12.3%) | 20 (2.4%) |
| 30 to 34 Minutes | 59 (7.5%) | 52 (6.3%) |
| 35 to 39 Minutes | 0 (0.0%) | 28 (3.4%) |
| 40 to 44 Minutes | 35 (4.5%) | 76 (9.2%) |
| 45 to 59 Minutes | 42 (5.4%) | 130 (15.7%) |
| 60 to 89 Minutes | 133 (17.0%) | 192 (23.2%) |
| 90 or more Minutes | 60 (7.7%) | 43 (5.2%) |
Time of Departure to Work by Sex in Burnham
The most frequent times of departure to work in Burnham are 7:00 AM to 7:29 AM (216, 27.6%) for males and 7:00 AM to 7:29 AM (194, 23.5%) for females.
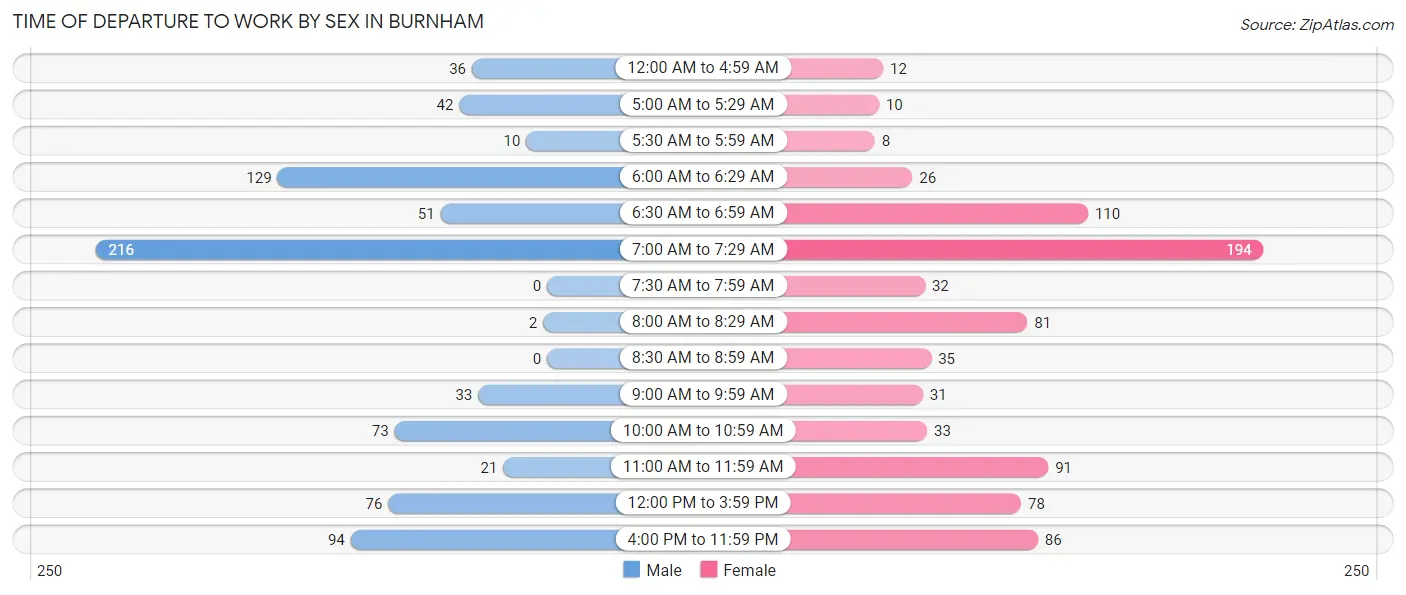
| Time of Departure | Male | Female |
| 12:00 AM to 4:59 AM | 36 (4.6%) | 12 (1.5%) |
| 5:00 AM to 5:29 AM | 42 (5.4%) | 10 (1.2%) |
| 5:30 AM to 5:59 AM | 10 (1.3%) | 8 (1.0%) |
| 6:00 AM to 6:29 AM | 129 (16.5%) | 26 (3.1%) |
| 6:30 AM to 6:59 AM | 51 (6.5%) | 110 (13.3%) |
| 7:00 AM to 7:29 AM | 216 (27.6%) | 194 (23.5%) |
| 7:30 AM to 7:59 AM | 0 (0.0%) | 32 (3.9%) |
| 8:00 AM to 8:29 AM | 2 (0.3%) | 81 (9.8%) |
| 8:30 AM to 8:59 AM | 0 (0.0%) | 35 (4.2%) |
| 9:00 AM to 9:59 AM | 33 (4.2%) | 31 (3.7%) |
| 10:00 AM to 10:59 AM | 73 (9.3%) | 33 (4.0%) |
| 11:00 AM to 11:59 AM | 21 (2.7%) | 91 (11.0%) |
| 12:00 PM to 3:59 PM | 76 (9.7%) | 78 (9.4%) |
| 4:00 PM to 11:59 PM | 94 (12.0%) | 86 (10.4%) |
| Total | 783 (100.0%) | 827 (100.0%) |
Housing Occupancy in Burnham
Occupancy by Ownership in Burnham
Of the total 1,522 dwellings in Burnham, owner-occupied units account for 993 (65.2%), while renter-occupied units make up 529 (34.8%).
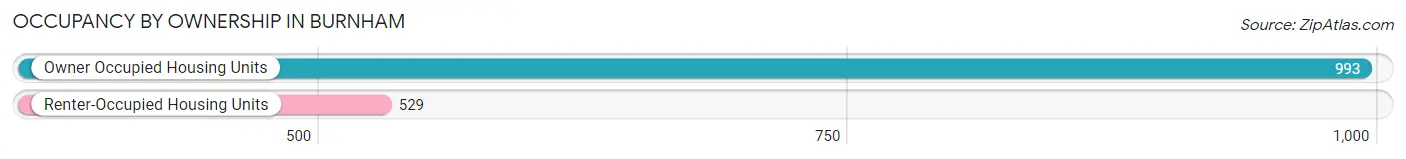
| Occupancy | # Housing Units | % Housing Units |
| Owner Occupied Housing Units | 993 | 65.2% |
| Renter-Occupied Housing Units | 529 | 34.8% |
| Total Occupied Housing Units | 1,522 | 100.0% |
Occupancy by Household Size in Burnham
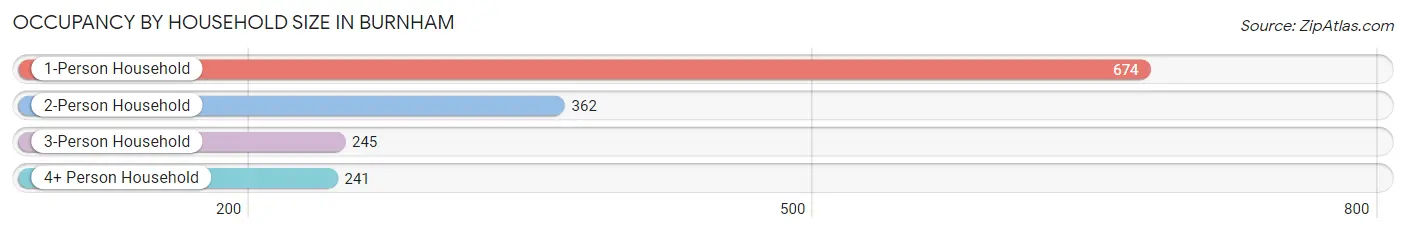
| Household Size | # Housing Units | % Housing Units |
| 1-Person Household | 674 | 44.3% |
| 2-Person Household | 362 | 23.8% |
| 3-Person Household | 245 | 16.1% |
| 4+ Person Household | 241 | 15.8% |
| Total Housing Units | 1,522 | 100.0% |
Occupancy by Ownership by Household Size in Burnham
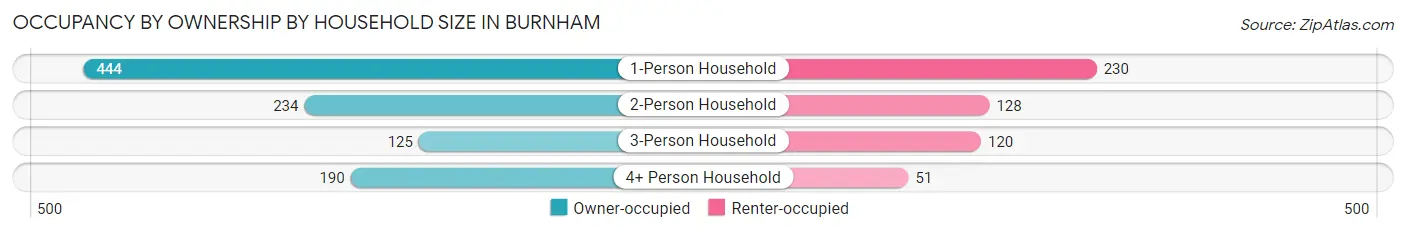
| Household Size | Owner-occupied | Renter-occupied |
| 1-Person Household | 444 (65.9%) | 230 (34.1%) |
| 2-Person Household | 234 (64.6%) | 128 (35.4%) |
| 3-Person Household | 125 (51.0%) | 120 (49.0%) |
| 4+ Person Household | 190 (78.8%) | 51 (21.2%) |
| Total Housing Units | 993 (65.2%) | 529 (34.8%) |
Occupancy by Educational Attainment in Burnham
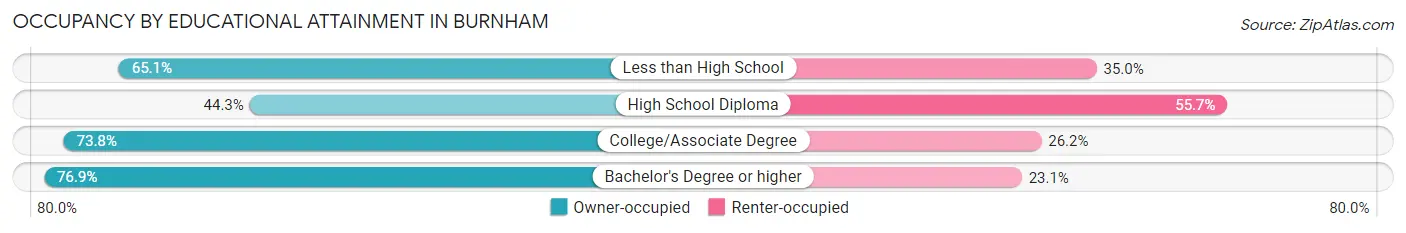
| Household Size | Owner-occupied | Renter-occupied |
| Less than High School | 134 (65.0%) | 72 (34.9%) |
| High School Diploma | 179 (44.3%) | 225 (55.7%) |
| College/Associate Degree | 510 (73.8%) | 181 (26.2%) |
| Bachelor's Degree or higher | 170 (76.9%) | 51 (23.1%) |
Occupancy by Age of Householder in Burnham
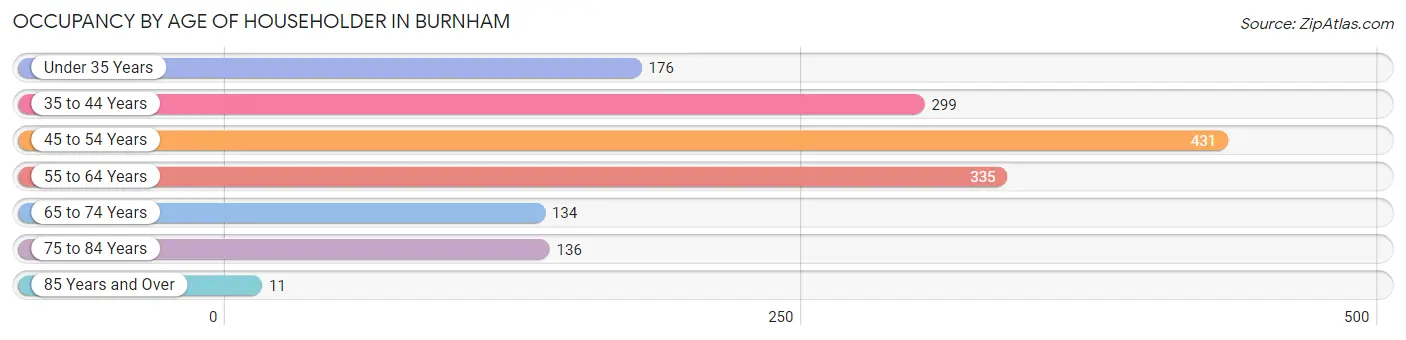
| Age Bracket | # Households | % Households |
| Under 35 Years | 176 | 11.6% |
| 35 to 44 Years | 299 | 19.7% |
| 45 to 54 Years | 431 | 28.3% |
| 55 to 64 Years | 335 | 22.0% |
| 65 to 74 Years | 134 | 8.8% |
| 75 to 84 Years | 136 | 8.9% |
| 85 Years and Over | 11 | 0.7% |
| Total | 1,522 | 100.0% |
Housing Finances in Burnham
Median Income by Occupancy in Burnham
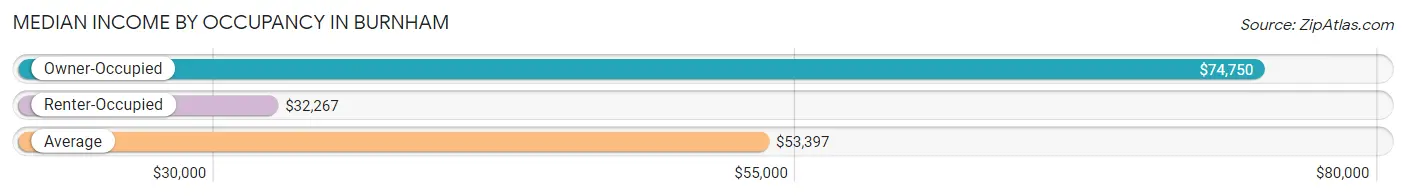
| Occupancy Type | # Households | Median Income |
| Owner-Occupied | 993 (65.2%) | $74,750 |
| Renter-Occupied | 529 (34.8%) | $32,267 |
| Average | 1,522 (100.0%) | $53,397 |
Occupancy by Householder Income Bracket in Burnham
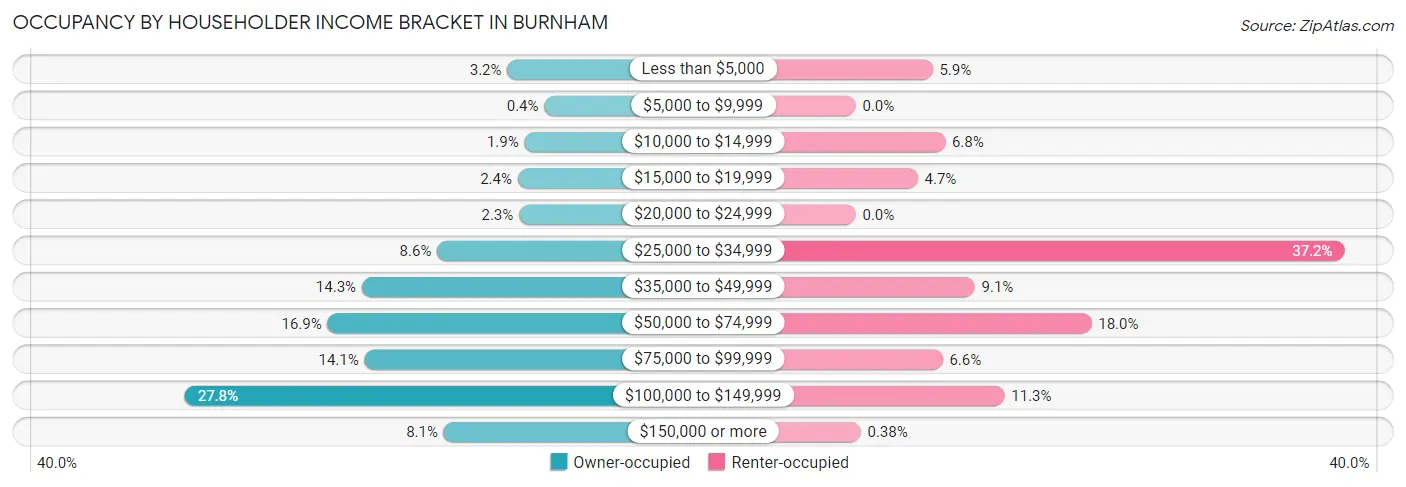
| Income Bracket | Owner-occupied | Renter-occupied |
| Less than $5,000 | 32 (3.2%) | 31 (5.9%) |
| $5,000 to $9,999 | 4 (0.4%) | 0 (0.0%) |
| $10,000 to $14,999 | 19 (1.9%) | 36 (6.8%) |
| $15,000 to $19,999 | 24 (2.4%) | 25 (4.7%) |
| $20,000 to $24,999 | 23 (2.3%) | 0 (0.0%) |
| $25,000 to $34,999 | 85 (8.6%) | 197 (37.2%) |
| $35,000 to $49,999 | 142 (14.3%) | 48 (9.1%) |
| $50,000 to $74,999 | 168 (16.9%) | 95 (18.0%) |
| $75,000 to $99,999 | 140 (14.1%) | 35 (6.6%) |
| $100,000 to $149,999 | 276 (27.8%) | 60 (11.3%) |
| $150,000 or more | 80 (8.1%) | 2 (0.4%) |
| Total | 993 (100.0%) | 529 (100.0%) |
Monthly Housing Cost Tiers in Burnham
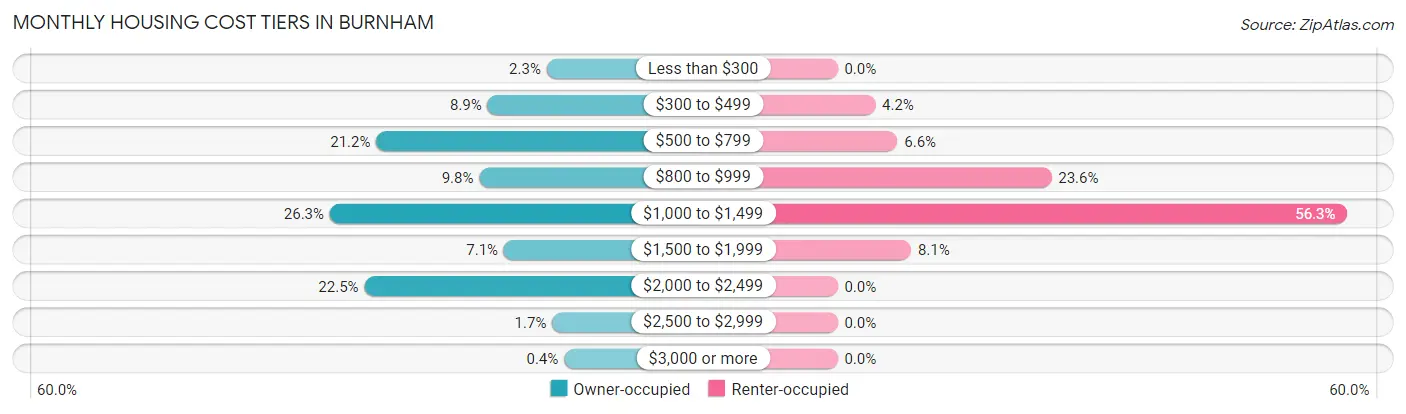
| Monthly Cost | Owner-occupied | Renter-occupied |
| Less than $300 | 23 (2.3%) | 0 (0.0%) |
| $300 to $499 | 88 (8.9%) | 22 (4.2%) |
| $500 to $799 | 210 (21.1%) | 35 (6.6%) |
| $800 to $999 | 97 (9.8%) | 125 (23.6%) |
| $1,000 to $1,499 | 261 (26.3%) | 298 (56.3%) |
| $1,500 to $1,999 | 70 (7.0%) | 43 (8.1%) |
| $2,000 to $2,499 | 223 (22.5%) | 0 (0.0%) |
| $2,500 to $2,999 | 17 (1.7%) | 0 (0.0%) |
| $3,000 or more | 4 (0.4%) | 0 (0.0%) |
| Total | 993 (100.0%) | 529 (100.0%) |
Physical Housing Characteristics in Burnham
Housing Structures in Burnham
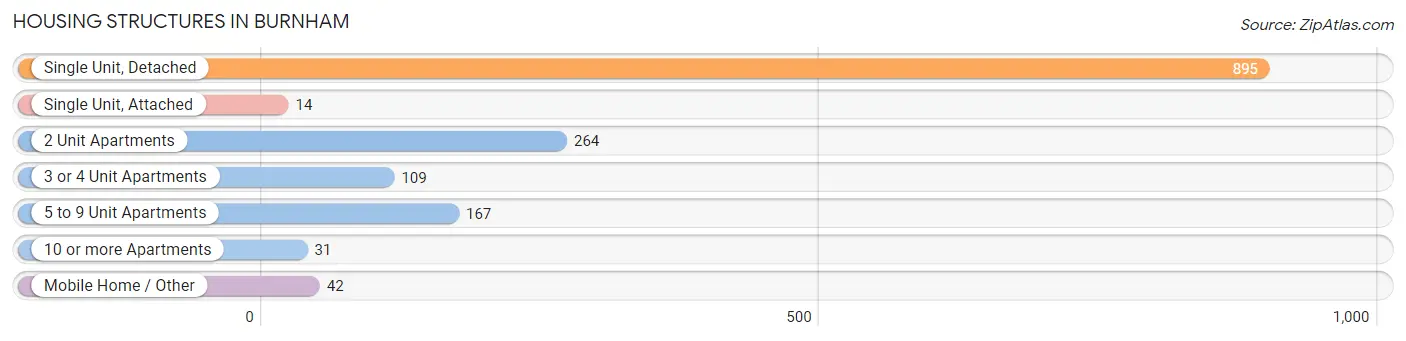
| Structure Type | # Housing Units | % Housing Units |
| Single Unit, Detached | 895 | 58.8% |
| Single Unit, Attached | 14 | 0.9% |
| 2 Unit Apartments | 264 | 17.3% |
| 3 or 4 Unit Apartments | 109 | 7.2% |
| 5 to 9 Unit Apartments | 167 | 11.0% |
| 10 or more Apartments | 31 | 2.0% |
| Mobile Home / Other | 42 | 2.8% |
| Total | 1,522 | 100.0% |
Housing Structures by Occupancy in Burnham
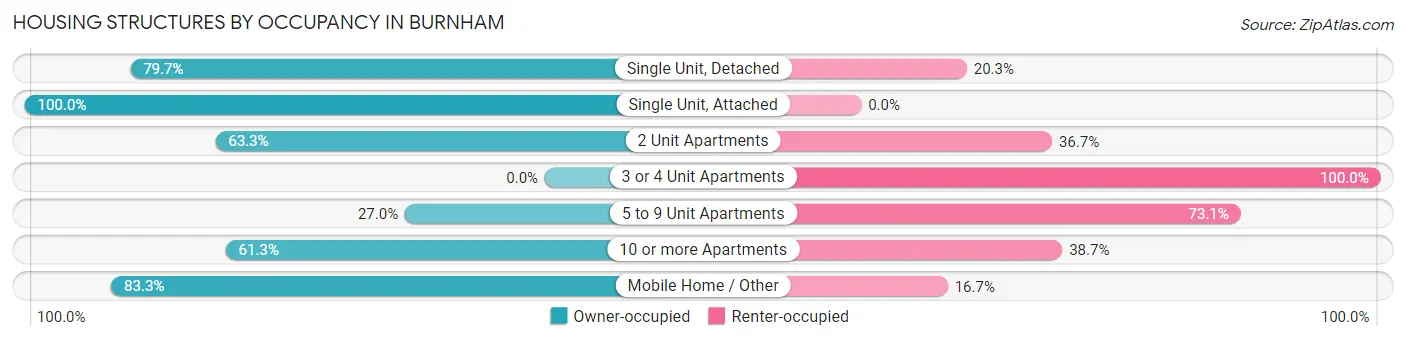
| Structure Type | Owner-occupied | Renter-occupied |
| Single Unit, Detached | 713 (79.7%) | 182 (20.3%) |
| Single Unit, Attached | 14 (100.0%) | 0 (0.0%) |
| 2 Unit Apartments | 167 (63.3%) | 97 (36.7%) |
| 3 or 4 Unit Apartments | 0 (0.0%) | 109 (100.0%) |
| 5 to 9 Unit Apartments | 45 (27.0%) | 122 (73.1%) |
| 10 or more Apartments | 19 (61.3%) | 12 (38.7%) |
| Mobile Home / Other | 35 (83.3%) | 7 (16.7%) |
| Total | 993 (65.2%) | 529 (34.8%) |
Housing Structures by Number of Rooms in Burnham
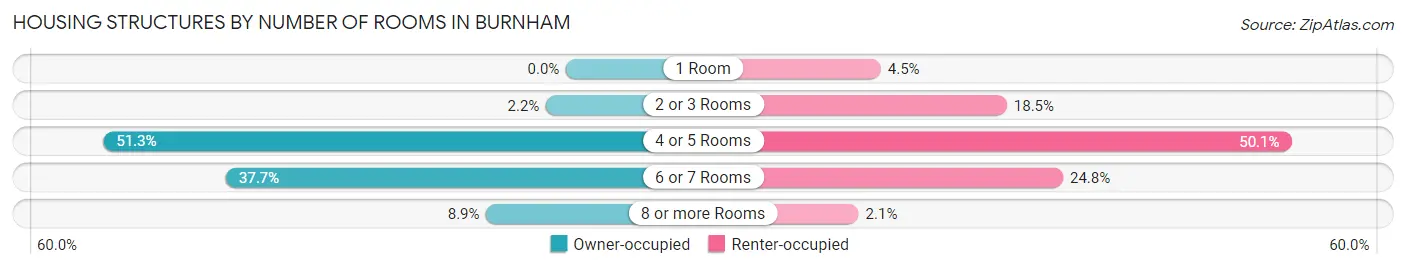
| Number of Rooms | Owner-occupied | Renter-occupied |
| 1 Room | 0 (0.0%) | 24 (4.5%) |
| 2 or 3 Rooms | 22 (2.2%) | 98 (18.5%) |
| 4 or 5 Rooms | 509 (51.3%) | 265 (50.1%) |
| 6 or 7 Rooms | 374 (37.7%) | 131 (24.8%) |
| 8 or more Rooms | 88 (8.9%) | 11 (2.1%) |
| Total | 993 (100.0%) | 529 (100.0%) |
Housing Structure by Heating Type in Burnham
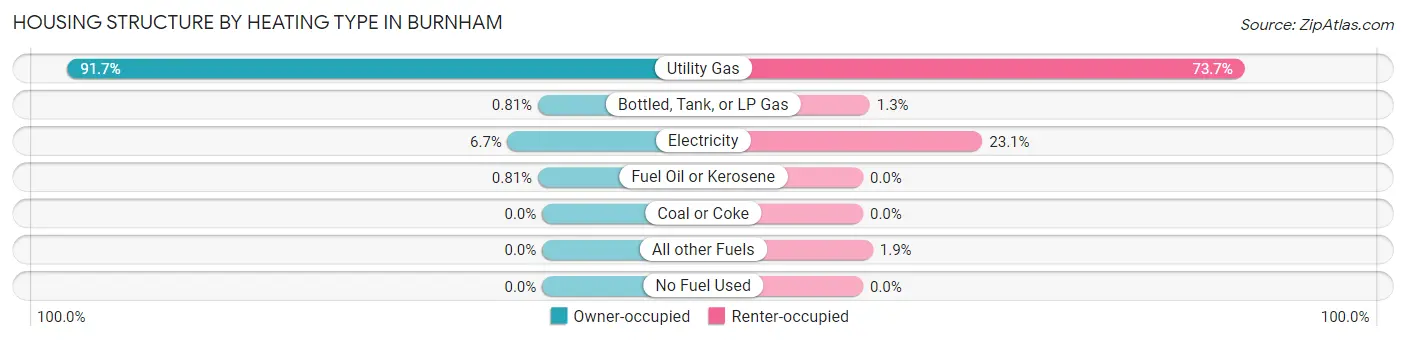
| Heating Type | Owner-occupied | Renter-occupied |
| Utility Gas | 911 (91.7%) | 390 (73.7%) |
| Bottled, Tank, or LP Gas | 8 (0.8%) | 7 (1.3%) |
| Electricity | 66 (6.7%) | 122 (23.1%) |
| Fuel Oil or Kerosene | 8 (0.8%) | 0 (0.0%) |
| Coal or Coke | 0 (0.0%) | 0 (0.0%) |
| All other Fuels | 0 (0.0%) | 10 (1.9%) |
| No Fuel Used | 0 (0.0%) | 0 (0.0%) |
| Total | 993 (100.0%) | 529 (100.0%) |
Household Vehicle Usage in Burnham
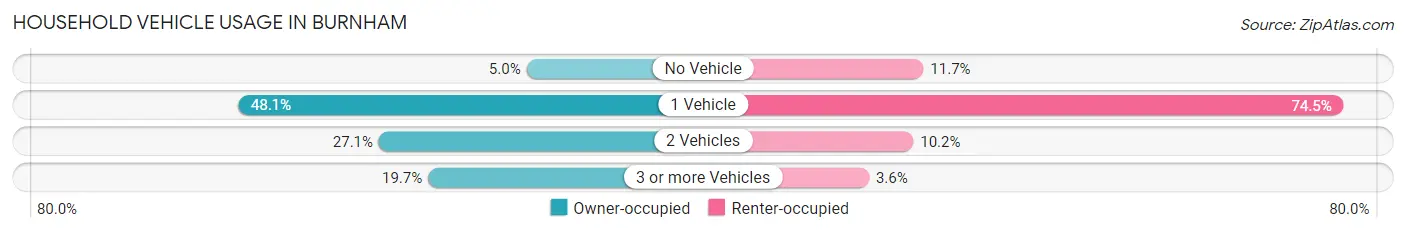
| Vehicles per Household | Owner-occupied | Renter-occupied |
| No Vehicle | 50 (5.0%) | 62 (11.7%) |
| 1 Vehicle | 478 (48.1%) | 394 (74.5%) |
| 2 Vehicles | 269 (27.1%) | 54 (10.2%) |
| 3 or more Vehicles | 196 (19.7%) | 19 (3.6%) |
| Total | 993 (100.0%) | 529 (100.0%) |
Real Estate & Mortgages in Burnham
Real Estate and Mortgage Overview in Burnham
| Characteristic | Without Mortgage | With Mortgage |
| Housing Units | 379 | 614 |
| Median Property Value | $133,500 | $154,000 |
| Median Household Income | $47,411 | $51 |
| Monthly Housing Costs | $629 | $4 |
| Real Estate Taxes | $3,130 | $14 |
Property Value by Mortgage Status in Burnham
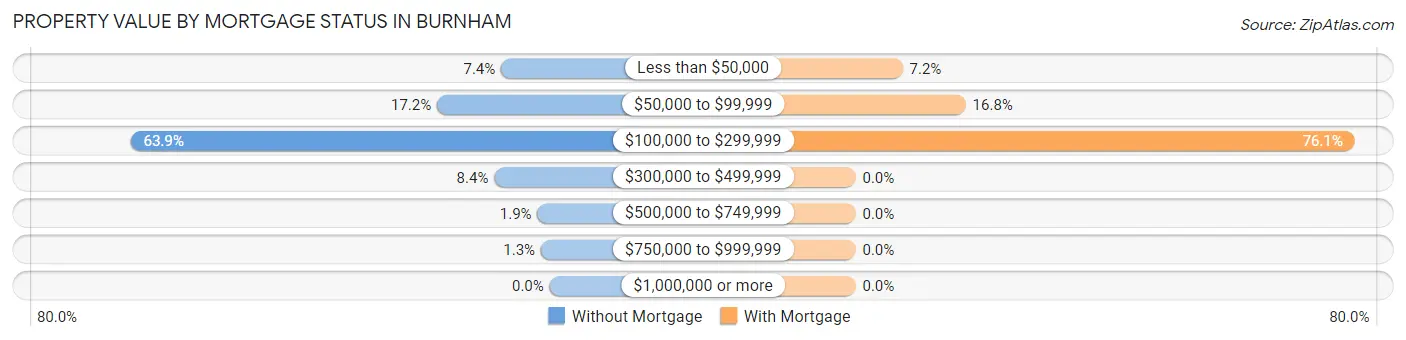
| Property Value | Without Mortgage | With Mortgage |
| Less than $50,000 | 28 (7.4%) | 44 (7.2%) |
| $50,000 to $99,999 | 65 (17.2%) | 103 (16.8%) |
| $100,000 to $299,999 | 242 (63.8%) | 467 (76.1%) |
| $300,000 to $499,999 | 32 (8.4%) | 0 (0.0%) |
| $500,000 to $749,999 | 7 (1.8%) | 0 (0.0%) |
| $750,000 to $999,999 | 5 (1.3%) | 0 (0.0%) |
| $1,000,000 or more | 0 (0.0%) | 0 (0.0%) |
| Total | 379 (100.0%) | 614 (100.0%) |
Household Income by Mortgage Status in Burnham
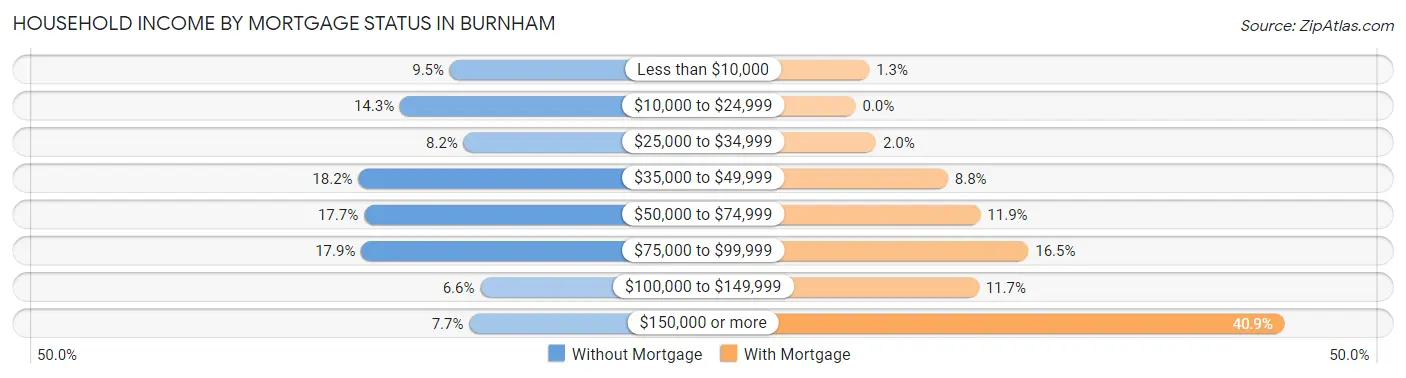
| Household Income | Without Mortgage | With Mortgage |
| Less than $10,000 | 36 (9.5%) | 8 (1.3%) |
| $10,000 to $24,999 | 54 (14.2%) | 0 (0.0%) |
| $25,000 to $34,999 | 31 (8.2%) | 12 (1.9%) |
| $35,000 to $49,999 | 69 (18.2%) | 54 (8.8%) |
| $50,000 to $74,999 | 67 (17.7%) | 73 (11.9%) |
| $75,000 to $99,999 | 68 (17.9%) | 101 (16.5%) |
| $100,000 to $149,999 | 25 (6.6%) | 72 (11.7%) |
| $150,000 or more | 29 (7.6%) | 251 (40.9%) |
| Total | 379 (100.0%) | 614 (100.0%) |
Property Value to Household Income Ratio in Burnham
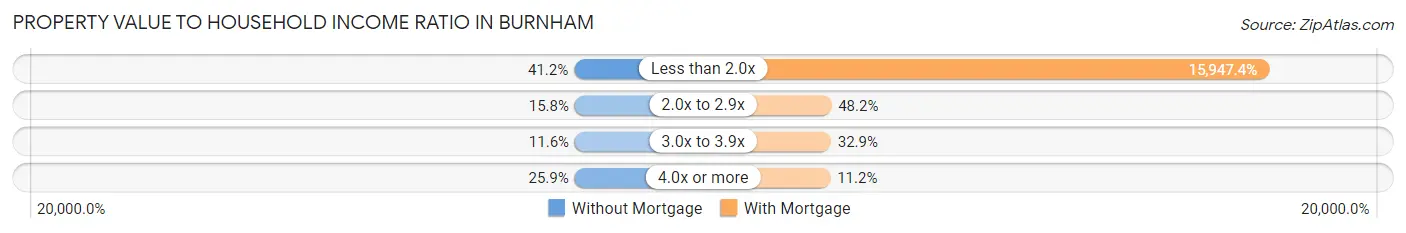
| Value-to-Income Ratio | Without Mortgage | With Mortgage |
| Less than 2.0x | 156 (41.2%) | 97,917 (15,947.4%) |
| 2.0x to 2.9x | 60 (15.8%) | 296 (48.2%) |
| 3.0x to 3.9x | 44 (11.6%) | 202 (32.9%) |
| 4.0x or more | 98 (25.9%) | 69 (11.2%) |
| Total | 379 (100.0%) | 614 (100.0%) |
Real Estate Taxes by Mortgage Status in Burnham
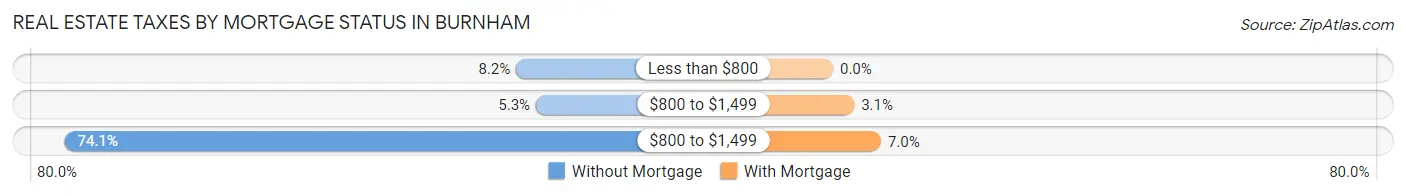
| Property Taxes | Without Mortgage | With Mortgage |
| Less than $800 | 31 (8.2%) | 0 (0.0%) |
| $800 to $1,499 | 20 (5.3%) | 19 (3.1%) |
| $800 to $1,499 | 281 (74.1%) | 43 (7.0%) |
| Total | 379 (100.0%) | 614 (100.0%) |
Health & Disability in Burnham
Health Insurance Coverage by Age in Burnham
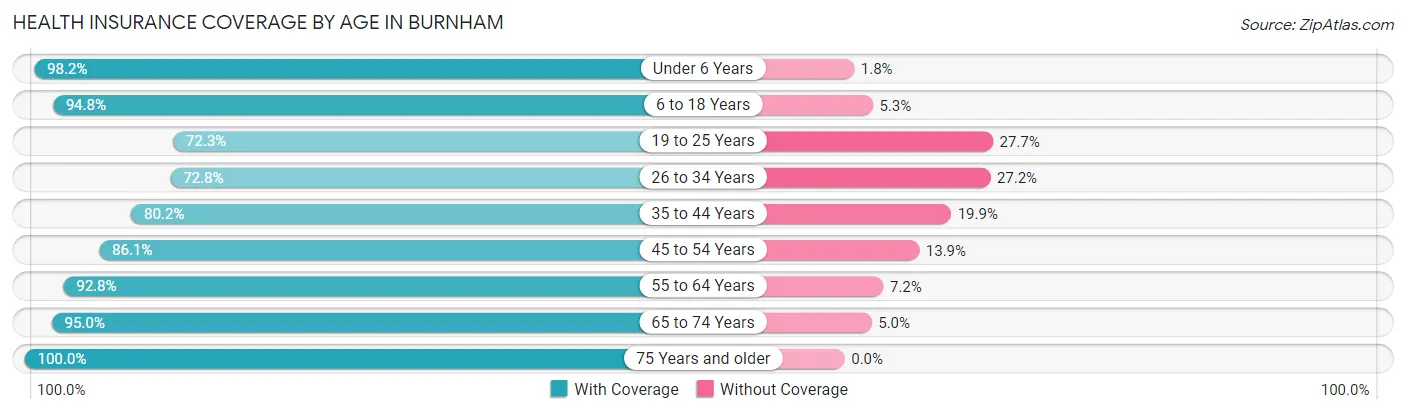
| Age Bracket | With Coverage | Without Coverage |
| Under 6 Years | 221 (98.2%) | 4 (1.8%) |
| 6 to 18 Years | 650 (94.8%) | 36 (5.2%) |
| 19 to 25 Years | 238 (72.3%) | 91 (27.7%) |
| 26 to 34 Years | 362 (72.8%) | 135 (27.2%) |
| 35 to 44 Years | 428 (80.1%) | 106 (19.9%) |
| 45 to 54 Years | 570 (86.1%) | 92 (13.9%) |
| 55 to 64 Years | 450 (92.8%) | 35 (7.2%) |
| 65 to 74 Years | 170 (95.0%) | 9 (5.0%) |
| 75 Years and older | 164 (100.0%) | 0 (0.0%) |
| Total | 3,253 (86.5%) | 508 (13.5%) |
Health Insurance Coverage by Citizenship Status in Burnham
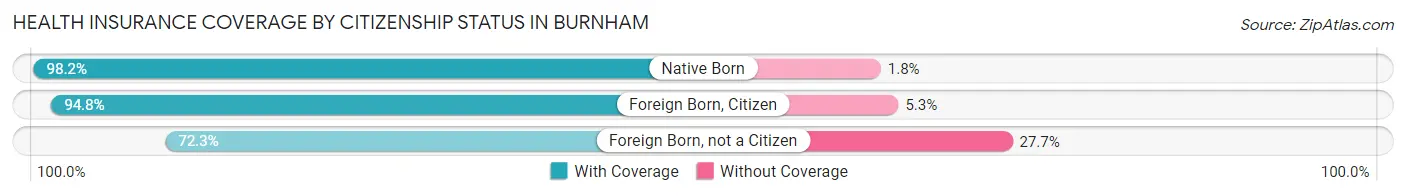
| Citizenship Status | With Coverage | Without Coverage |
| Native Born | 221 (98.2%) | 4 (1.8%) |
| Foreign Born, Citizen | 650 (94.8%) | 36 (5.2%) |
| Foreign Born, not a Citizen | 238 (72.3%) | 91 (27.7%) |
Health Insurance Coverage by Household Income in Burnham
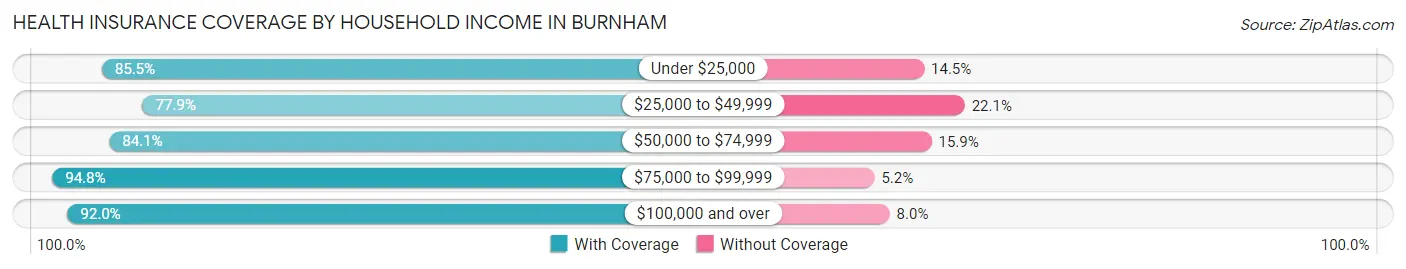
| Household Income | With Coverage | Without Coverage |
| Under $25,000 | 307 (85.5%) | 52 (14.5%) |
| $25,000 to $49,999 | 825 (77.9%) | 234 (22.1%) |
| $50,000 to $74,999 | 551 (84.1%) | 104 (15.9%) |
| $75,000 to $99,999 | 585 (94.8%) | 32 (5.2%) |
| $100,000 and over | 985 (92.0%) | 86 (8.0%) |
Public vs Private Health Insurance Coverage by Age in Burnham
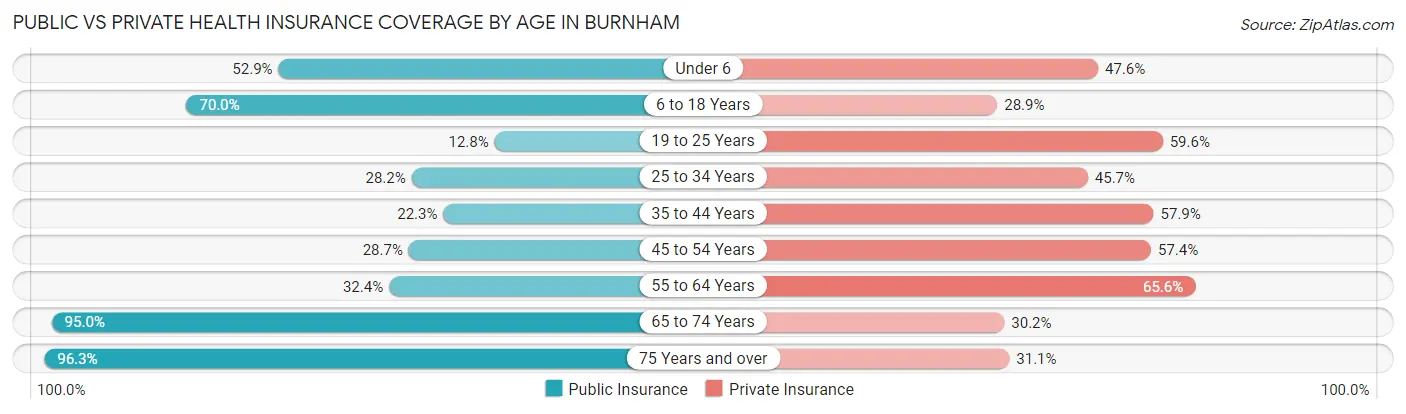
| Age Bracket | Public Insurance | Private Insurance |
| Under 6 | 119 (52.9%) | 107 (47.6%) |
| 6 to 18 Years | 480 (70.0%) | 198 (28.9%) |
| 19 to 25 Years | 42 (12.8%) | 196 (59.6%) |
| 25 to 34 Years | 140 (28.2%) | 227 (45.7%) |
| 35 to 44 Years | 119 (22.3%) | 309 (57.9%) |
| 45 to 54 Years | 190 (28.7%) | 380 (57.4%) |
| 55 to 64 Years | 157 (32.4%) | 318 (65.6%) |
| 65 to 74 Years | 170 (95.0%) | 54 (30.2%) |
| 75 Years and over | 158 (96.3%) | 51 (31.1%) |
| Total | 1,575 (41.9%) | 1,840 (48.9%) |
Disability Status by Sex by Age in Burnham
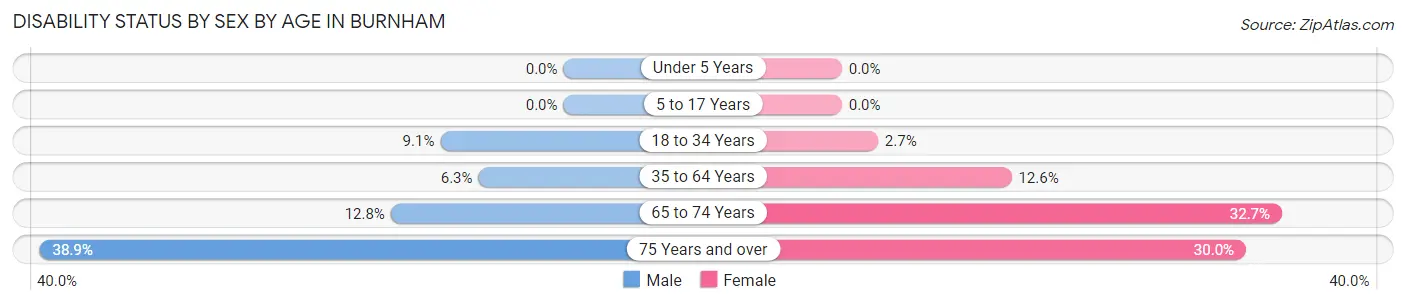
| Age Bracket | Male | Female |
| Under 5 Years | 0 (0.0%) | 0 (0.0%) |
| 5 to 17 Years | 0 (0.0%) | 0 (0.0%) |
| 18 to 34 Years | 35 (9.1%) | 12 (2.7%) |
| 35 to 64 Years | 43 (6.3%) | 126 (12.6%) |
| 65 to 74 Years | 10 (12.8%) | 33 (32.7%) |
| 75 Years and over | 21 (38.9%) | 33 (30.0%) |
Disability Class by Sex by Age in Burnham
Disability Class: Hearing Difficulty
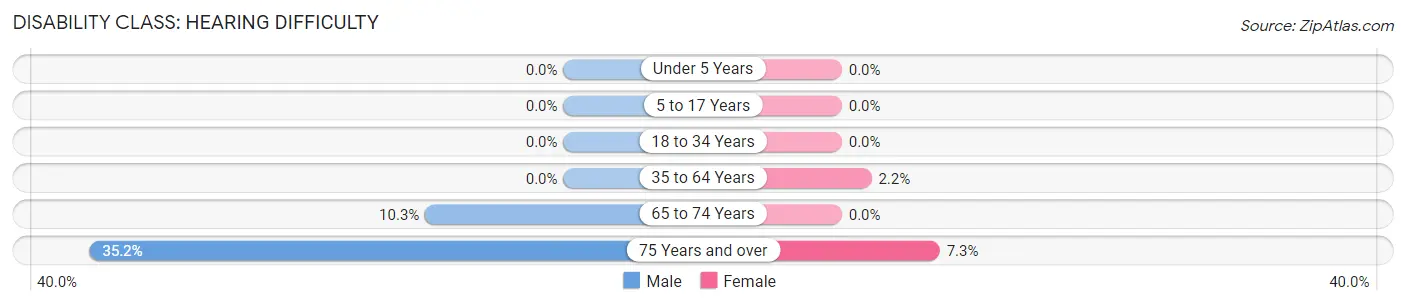
| Age Bracket | Male | Female |
| Under 5 Years | 0 (0.0%) | 0 (0.0%) |
| 5 to 17 Years | 0 (0.0%) | 0 (0.0%) |
| 18 to 34 Years | 0 (0.0%) | 0 (0.0%) |
| 35 to 64 Years | 0 (0.0%) | 22 (2.2%) |
| 65 to 74 Years | 8 (10.3%) | 0 (0.0%) |
| 75 Years and over | 19 (35.2%) | 8 (7.3%) |
Disability Class: Vision Difficulty
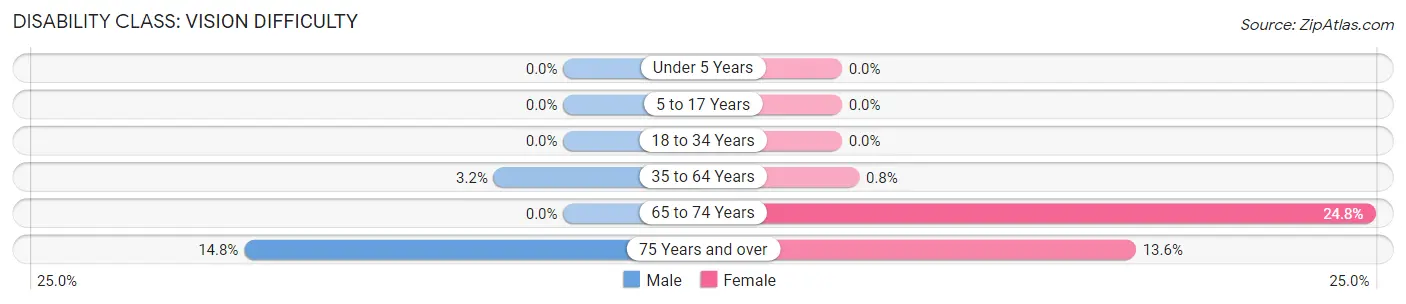
| Age Bracket | Male | Female |
| Under 5 Years | 0 (0.0%) | 0 (0.0%) |
| 5 to 17 Years | 0 (0.0%) | 0 (0.0%) |
| 18 to 34 Years | 0 (0.0%) | 0 (0.0%) |
| 35 to 64 Years | 22 (3.2%) | 8 (0.8%) |
| 65 to 74 Years | 0 (0.0%) | 25 (24.7%) |
| 75 Years and over | 8 (14.8%) | 15 (13.6%) |
Disability Class: Cognitive Difficulty
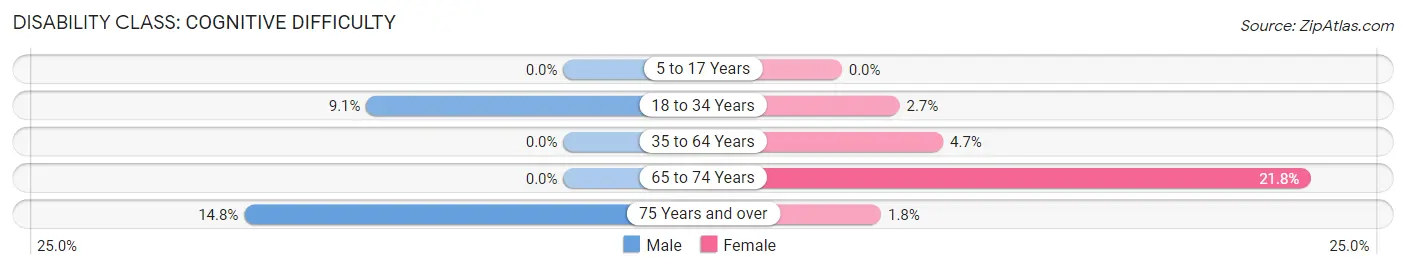
| Age Bracket | Male | Female |
| 5 to 17 Years | 0 (0.0%) | 0 (0.0%) |
| 18 to 34 Years | 35 (9.1%) | 12 (2.7%) |
| 35 to 64 Years | 0 (0.0%) | 47 (4.7%) |
| 65 to 74 Years | 0 (0.0%) | 22 (21.8%) |
| 75 Years and over | 8 (14.8%) | 2 (1.8%) |
Disability Class: Ambulatory Difficulty
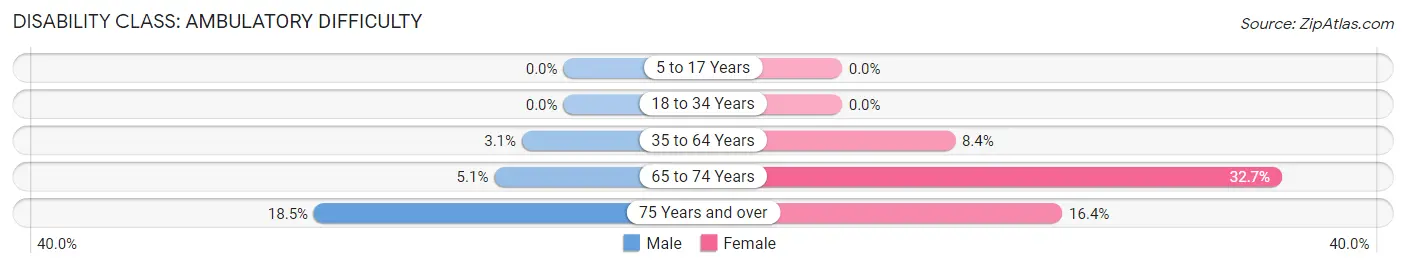
| Age Bracket | Male | Female |
| 5 to 17 Years | 0 (0.0%) | 0 (0.0%) |
| 18 to 34 Years | 0 (0.0%) | 0 (0.0%) |
| 35 to 64 Years | 21 (3.1%) | 84 (8.4%) |
| 65 to 74 Years | 4 (5.1%) | 33 (32.7%) |
| 75 Years and over | 10 (18.5%) | 18 (16.4%) |
Disability Class: Self-Care Difficulty
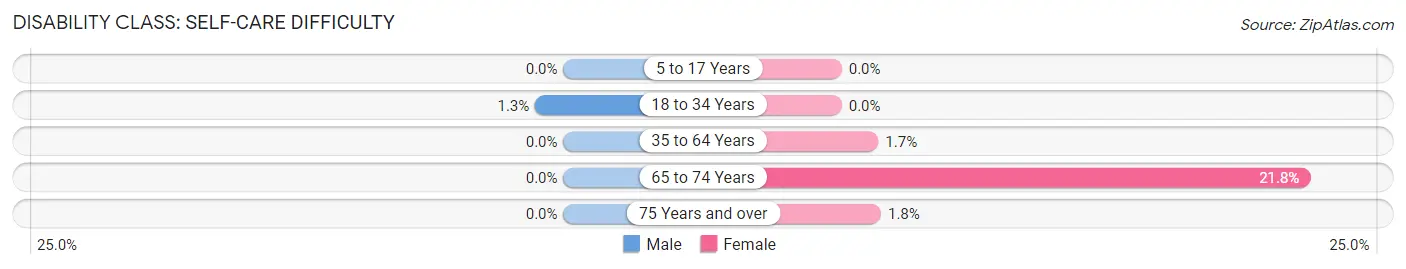
| Age Bracket | Male | Female |
| 5 to 17 Years | 0 (0.0%) | 0 (0.0%) |
| 18 to 34 Years | 5 (1.3%) | 0 (0.0%) |
| 35 to 64 Years | 0 (0.0%) | 17 (1.7%) |
| 65 to 74 Years | 0 (0.0%) | 22 (21.8%) |
| 75 Years and over | 0 (0.0%) | 2 (1.8%) |
Technology Access in Burnham
Computing Device Access in Burnham
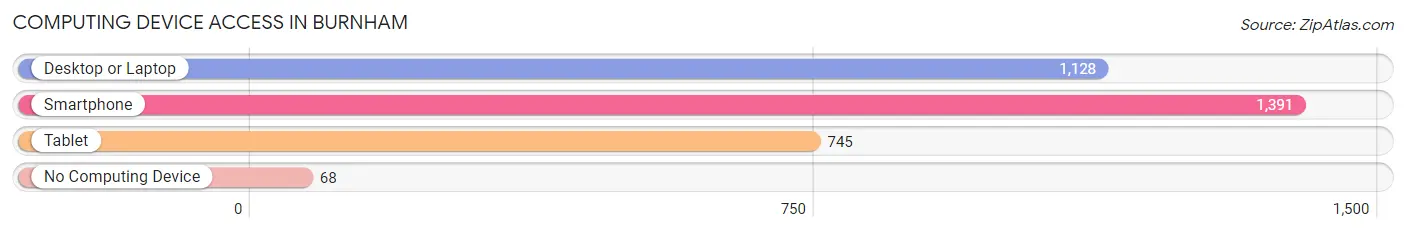
| Device Type | # Households | % Households |
| Desktop or Laptop | 1,128 | 74.1% |
| Smartphone | 1,391 | 91.4% |
| Tablet | 745 | 48.9% |
| No Computing Device | 68 | 4.5% |
| Total | 1,522 | 100.0% |
Internet Access in Burnham
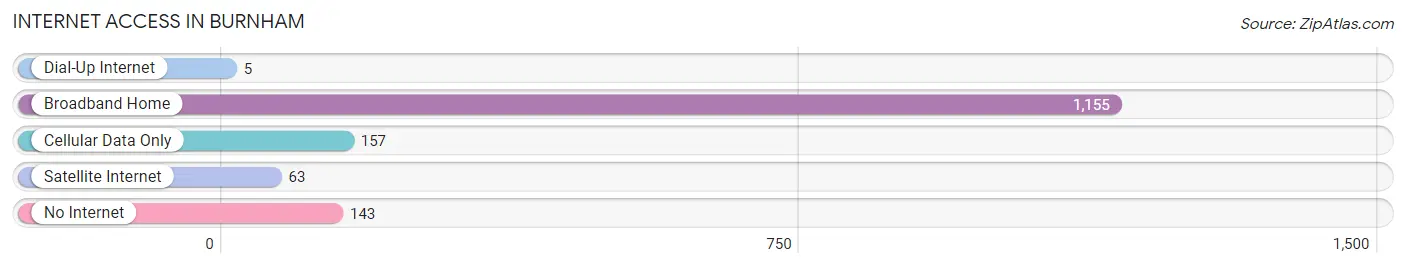
| Internet Type | # Households | % Households |
| Dial-Up Internet | 5 | 0.3% |
| Broadband Home | 1,155 | 75.9% |
| Cellular Data Only | 157 | 10.3% |
| Satellite Internet | 63 | 4.1% |
| No Internet | 143 | 9.4% |
| Total | 1,522 | 100.0% |
Burnham Summary
Burnham, Illinois is a small village located in Cook County, Illinois, United States. The village is located approximately 25 miles south of Chicago and is part of the Chicago metropolitan area. As of the 2010 census, the population of Burnham was 4,206.
History
Burnham was founded in 1891 by a group of investors led by John B. Drake. The village was named after Drake's son, Burnham Drake. The village was incorporated in 1895 and was initially a farming community. In the early 1900s, the village began to grow as a result of the construction of the Illinois Central Railroad. The railroad provided transportation for the village's residents and allowed them to access the larger cities of Chicago and Gary, Indiana.
In the 1920s, Burnham began to experience a period of growth and development. The village was annexed by the City of Chicago in 1923, and the population of the village increased significantly. The village was also home to a number of factories, including the Burnham Steel Company, which produced steel for the construction of the Chicago Skyway.
In the 1950s, the village experienced a period of decline as the factories closed and the population decreased. The village was annexed by the City of Chicago in 1959, and the population decreased further. In the 1970s, the village began to experience a period of revitalization as new businesses and industries moved into the area.
Geography
Burnham is located in Cook County, Illinois, approximately 25 miles south of Chicago. The village is situated on the Calumet River and is bordered by the City of Chicago to the north, the City of Hammond, Indiana to the east, and the City of Lansing to the south. The village covers an area of 1.7 square miles and has a population density of 2,521 people per square mile.
Economy
The economy of Burnham is largely based on manufacturing and retail. The village is home to a number of factories, including the Burnham Steel Company, which produces steel for the construction of the Chicago Skyway. The village is also home to a number of retail stores, including a Walmart Supercenter, a Target, and a Home Depot.
Demographics
As of the 2010 census, the population of Burnham was 4,206. The racial makeup of the village was 79.3% White, 14.2% African American, 0.3% Native American, 1.2% Asian, and 4.9% from other races. The median household income in the village was $45,945, and the median family income was $54,945. The per capita income in the village was $20,945.
Conclusion
Burnham, Illinois is a small village located in Cook County, Illinois, United States. The village is located approximately 25 miles south of Chicago and is part of the Chicago metropolitan area. The village was founded in 1891 and was initially a farming community. In the early 1900s, the village began to grow as a result of the construction of the Illinois Central Railroad. The village experienced a period of growth and development in the 1920s, and was annexed by the City of Chicago in 1923. The village experienced a period of decline in the 1950s, and was annexed by the City of Chicago in 1959. In the 1970s, the village began to experience a period of revitalization as new businesses and industries moved into the area. The economy of Burnham is largely based on manufacturing and retail. As of the 2010 census, the population of Burnham was 4,206. The racial makeup of the village was 79.3% White, 14.2% African American, 0.3% Native American, 1.2% Asian, and 4.9% from other races. The median household income in the village was $45,945, and the median family income was $54,945. The per capita income in the village was $20,945.
Common Questions
What is Per Capita Income in Burnham?
Per Capita income in Burnham is $26,881.
What is the Median Family Income in Burnham?
Median Family Income in Burnham is $53,301.
What is the Median Household income in Burnham?
Median Household Income in Burnham is $53,397.
What is Income or Wage Gap in Burnham?
Income or Wage Gap in Burnham is 30.3%.
Women in Burnham earn 69.7 cents for every dollar earned by a man.
What is Inequality or Gini Index in Burnham?
Inequality or Gini Index in Burnham is 0.38.
What is the Total Population of Burnham?
Total Population of Burnham is 4,028.
What is the Total Male Population of Burnham?
Total Male Population of Burnham is 1,751.
What is the Total Female Population of Burnham?
Total Female Population of Burnham is 2,277.
What is the Ratio of Males per 100 Females in Burnham?
There are 76.90 Males per 100 Females in Burnham.
What is the Ratio of Females per 100 Males in Burnham?
There are 130.04 Females per 100 Males in Burnham.
What is the Median Population Age in Burnham?
Median Population Age in Burnham is 36.7 Years.
What is the Average Family Size in Burnham
Average Family Size in Burnham is 3.6 People.
What is the Average Household Size in Burnham
Average Household Size in Burnham is 2.5 People.
How Large is the Labor Force in Burnham?
There are 2,140 People in the Labor Forcein in Burnham.
What is the Percentage of People in the Labor Force in Burnham?
65.1% of People are in the Labor Force in Burnham.
What is the Unemployment Rate in Burnham?
Unemployment Rate in Burnham is 12.3%.