Cobden, IL Map & Demographics
Cobden Map
Cobden Overview
$22,409
PER CAPITA INCOME
$49,327
AVG FAMILY INCOME
$38,929
AVG HOUSEHOLD INCOME
15.8%
WAGE / INCOME GAP [ % ]
84.2¢/ $1
WAGE / INCOME GAP [ $ ]
0.48
INEQUALITY / GINI INDEX
1,023
TOTAL POPULATION
542
MALE POPULATION
481
FEMALE POPULATION
112.68
MALES / 100 FEMALES
88.75
FEMALES / 100 MALES
46.8
MEDIAN AGE
3.1
AVG FAMILY SIZE
2.6
AVG HOUSEHOLD SIZE
391
LABOR FORCE [ PEOPLE ]
44.4%
PERCENT IN LABOR FORCE
6.1%
UNEMPLOYMENT RATE
Cobden Zip Codes
Cobden Area Codes
Income in Cobden
Income Overview in Cobden
Per Capita Income in Cobden is $22,409, while median incomes of families and households are $49,327 and $38,929 respectively.
| Characteristic | Number | Measure |
| Per Capita Income | 1,023 | $22,409 |
| Median Family Income | 243 | $49,327 |
| Mean Family Income | 243 | $71,355 |
| Median Household Income | 384 | $38,929 |
| Mean Household Income | 384 | $55,373 |
| Income Deficit | 243 | $0 |
| Wage / Income Gap (%) | 1,023 | 15.81% |
| Wage / Income Gap ($) | 1,023 | 84.19¢ per $1 |
| Gini / Inequality Index | 1,023 | 0.48 |
Earnings by Sex in Cobden
Average Earnings in Cobden are $27,330, $31,719 for men and $26,705 for women, a difference of 15.8%.
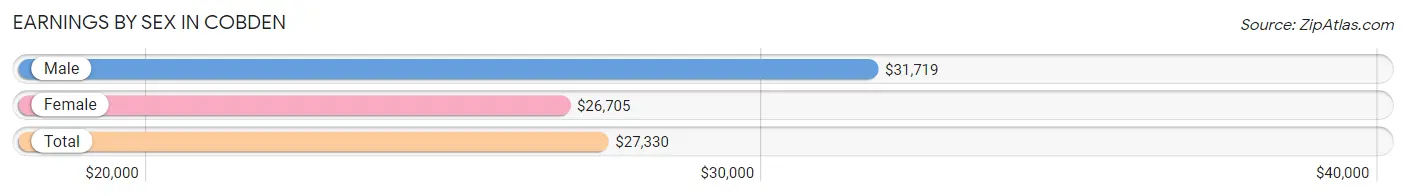
| Sex | Number | Average Earnings |
| Male | 157 (41.0%) | $31,719 |
| Female | 226 (59.0%) | $26,705 |
| Total | 383 (100.0%) | $27,330 |
Earnings by Sex by Income Bracket in Cobden
The most common earnings brackets in Cobden are $65,000 to $74,999 for men (39 | 24.8%) and $30,000 to $34,999 for women (30 | 13.3%).
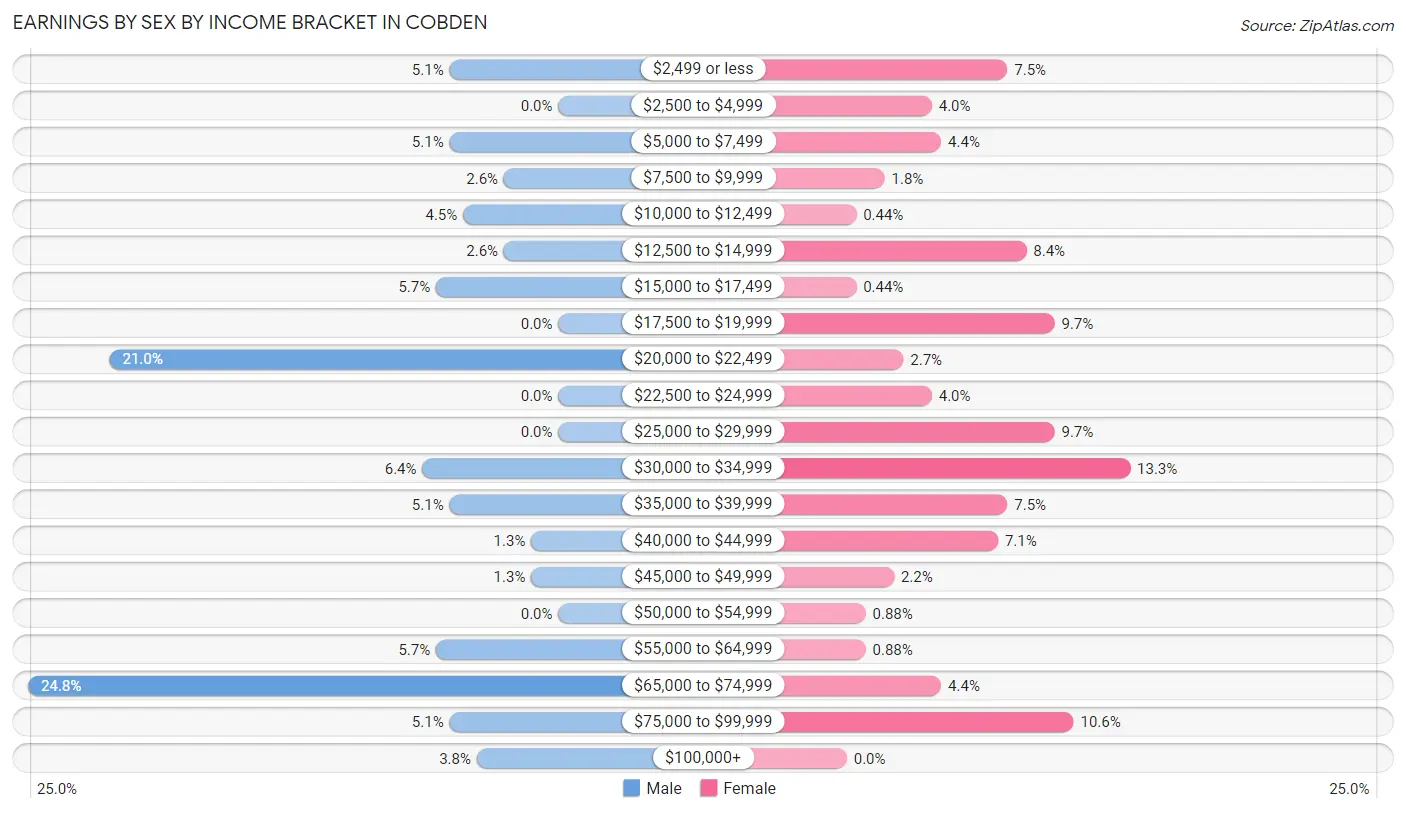
| Income | Male | Female |
| $2,499 or less | 8 (5.1%) | 17 (7.5%) |
| $2,500 to $4,999 | 0 (0.0%) | 9 (4.0%) |
| $5,000 to $7,499 | 8 (5.1%) | 10 (4.4%) |
| $7,500 to $9,999 | 4 (2.5%) | 4 (1.8%) |
| $10,000 to $12,499 | 7 (4.5%) | 1 (0.4%) |
| $12,500 to $14,999 | 4 (2.5%) | 19 (8.4%) |
| $15,000 to $17,499 | 9 (5.7%) | 1 (0.4%) |
| $17,500 to $19,999 | 0 (0.0%) | 22 (9.7%) |
| $20,000 to $22,499 | 33 (21.0%) | 6 (2.6%) |
| $22,500 to $24,999 | 0 (0.0%) | 9 (4.0%) |
| $25,000 to $29,999 | 0 (0.0%) | 22 (9.7%) |
| $30,000 to $34,999 | 10 (6.4%) | 30 (13.3%) |
| $35,000 to $39,999 | 8 (5.1%) | 17 (7.5%) |
| $40,000 to $44,999 | 2 (1.3%) | 16 (7.1%) |
| $45,000 to $49,999 | 2 (1.3%) | 5 (2.2%) |
| $50,000 to $54,999 | 0 (0.0%) | 2 (0.9%) |
| $55,000 to $64,999 | 9 (5.7%) | 2 (0.9%) |
| $65,000 to $74,999 | 39 (24.8%) | 10 (4.4%) |
| $75,000 to $99,999 | 8 (5.1%) | 24 (10.6%) |
| $100,000+ | 6 (3.8%) | 0 (0.0%) |
| Total | 157 (100.0%) | 226 (100.0%) |
Earnings by Sex by Educational Attainment in Cobden
Average earnings in Cobden are $39,375 for men and $33,009 for women, a difference of 16.2%. Men with an educational attainment of bachelor's degree enjoy the highest average annual earnings of $44,375, while those with bachelor's degree education earn the least with $44,375. Women with an educational attainment of bachelor's degree earn the most with the average annual earnings of $36,979, while those with high school diploma education have the smallest earnings of $23,333.
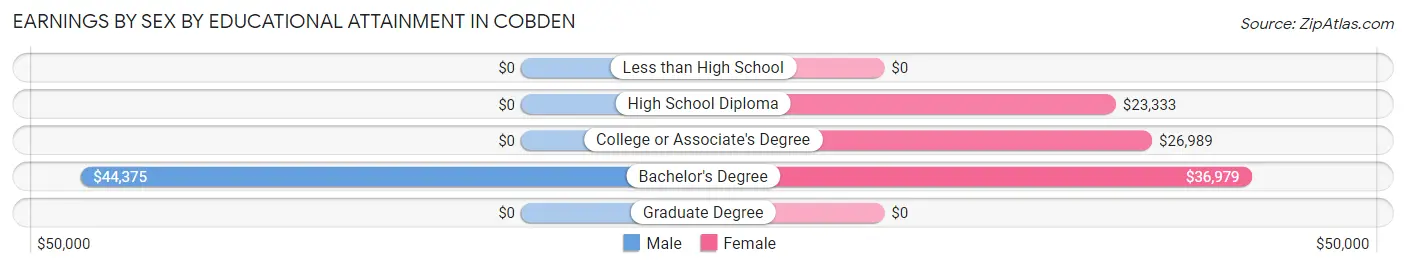
| Educational Attainment | Male Income | Female Income |
| Less than High School | - | - |
| High School Diploma | - | - |
| College or Associate's Degree | - | - |
| Bachelor's Degree | $44,375 | $36,979 |
| Graduate Degree | - | - |
| Total | $39,375 | $33,009 |
Family Income in Cobden
Family Income Brackets in Cobden
According to the Cobden family income data, there are 54 families falling into the $35,000 to $49,999 income range, which is the most common income bracket and makes up 22.2% of all families. Conversely, the $15,000 to $24,999 income bracket is the least frequent group with only 7 families (2.9%) belonging to this category.
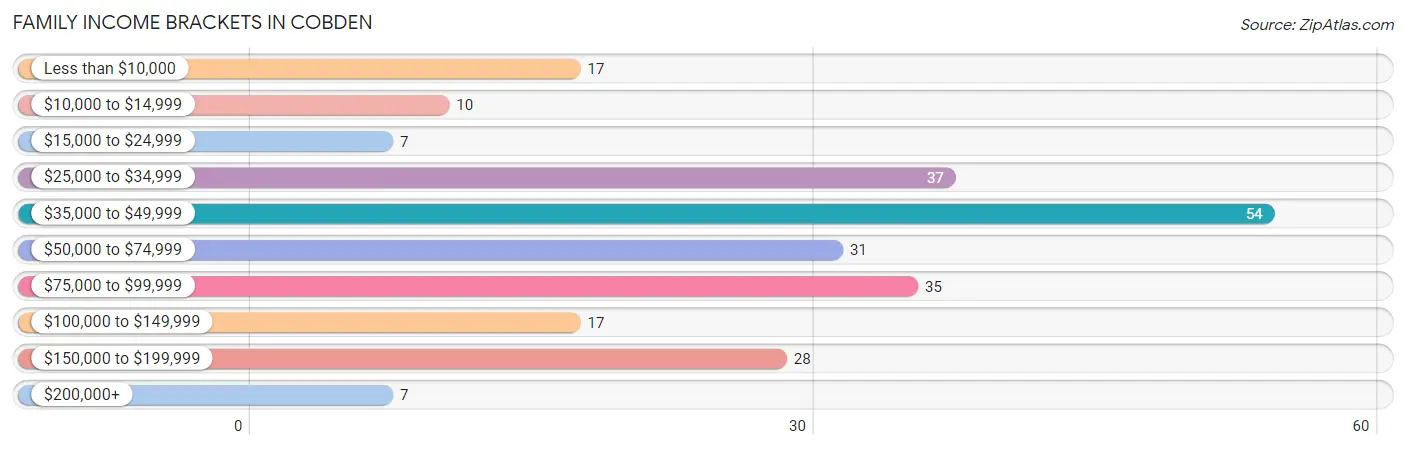
| Income Bracket | # Families | % Families |
| Less than $10,000 | 17 | 7.0% |
| $10,000 to $14,999 | 10 | 4.1% |
| $15,000 to $24,999 | 7 | 2.9% |
| $25,000 to $34,999 | 37 | 15.2% |
| $35,000 to $49,999 | 54 | 22.2% |
| $50,000 to $74,999 | 31 | 12.8% |
| $75,000 to $99,999 | 35 | 14.4% |
| $100,000 to $149,999 | 17 | 7.0% |
| $150,000 to $199,999 | 28 | 11.5% |
| $200,000+ | 7 | 2.9% |
Family Income by Famaliy Size in Cobden
2-person families (112 | 46.1%) account for the highest median family income in Cobden with $53,125 per family, while 2-person families (112 | 46.1%) have the highest median income of $26,562 per family member.
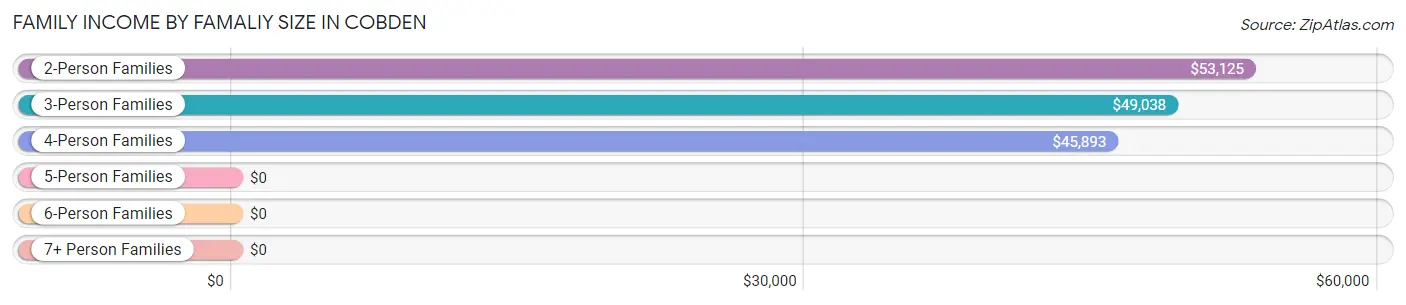
| Income Bracket | # Families | Median Income |
| 2-Person Families | 112 (46.1%) | $53,125 |
| 3-Person Families | 52 (21.4%) | $49,038 |
| 4-Person Families | 28 (11.5%) | $45,893 |
| 5-Person Families | 45 (18.5%) | $0 |
| 6-Person Families | 6 (2.5%) | $0 |
| 7+ Person Families | 0 (0.0%) | $0 |
| Total | 243 (100.0%) | $49,327 |
Family Income by Number of Earners in Cobden
The median family income in Cobden is $49,327, with families comprising 3+ earners (8) having the highest median family income of $142,500, while families with 1 earner (78) have the lowest median family income of $42,500, accounting for 3.3% and 32.1% of families, respectively.
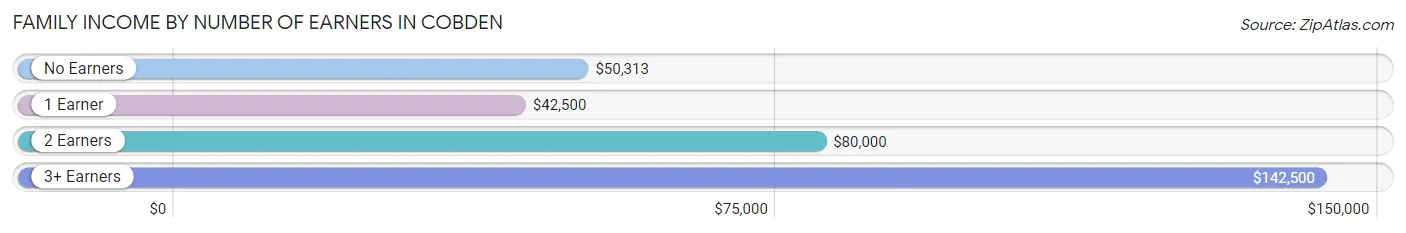
| Number of Earners | # Families | Median Income |
| No Earners | 85 (35.0%) | $50,313 |
| 1 Earner | 78 (32.1%) | $42,500 |
| 2 Earners | 72 (29.6%) | $80,000 |
| 3+ Earners | 8 (3.3%) | $142,500 |
| Total | 243 (100.0%) | $49,327 |
Household Income in Cobden
Household Income Brackets in Cobden
With 77 households falling in the category, the $35,000 to $49,999 income range is the most frequent in Cobden, accounting for 20.1% of all households. In contrast, only 7 households (1.8%) fall into the $200,000+ income bracket, making it the least populous group.
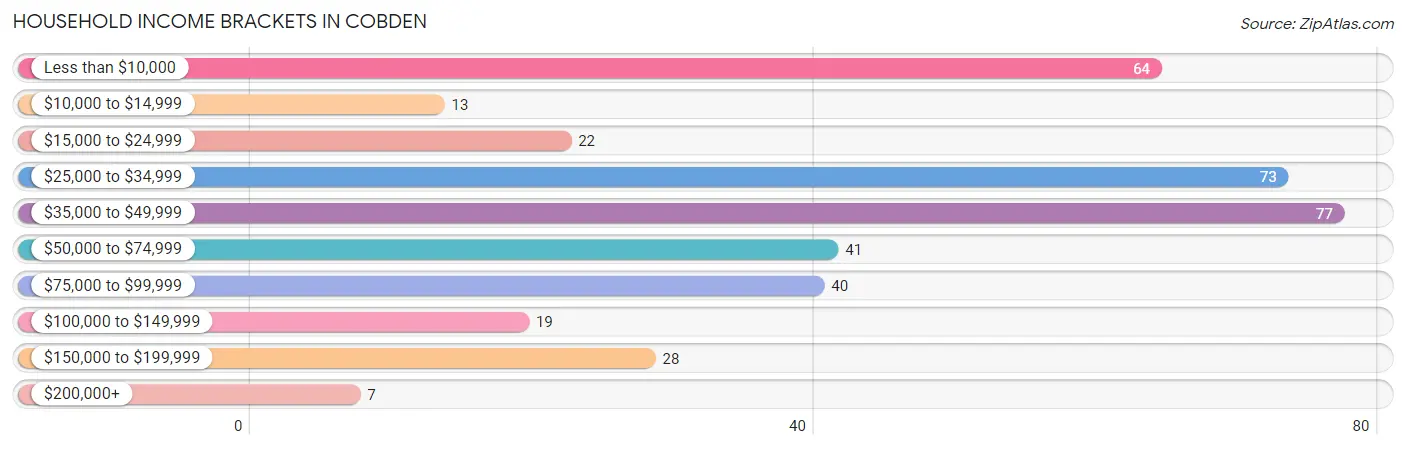
| Income Bracket | # Households | % Households |
| Less than $10,000 | 64 | 16.7% |
| $10,000 to $14,999 | 13 | 3.4% |
| $15,000 to $24,999 | 22 | 5.7% |
| $25,000 to $34,999 | 73 | 19.0% |
| $35,000 to $49,999 | 77 | 20.1% |
| $50,000 to $74,999 | 41 | 10.7% |
| $75,000 to $99,999 | 40 | 10.4% |
| $100,000 to $149,999 | 19 | 4.9% |
| $150,000 to $199,999 | 28 | 7.3% |
| $200,000+ | 7 | 1.8% |
Household Income by Householder Age in Cobden
The median household income in Cobden is $38,929, with the highest median household income of $45,357 found in the 25 to 44 years age bracket for the primary householder. A total of 62 households (16.2%) fall into this category. Meanwhile, the 15 to 24 years age bracket for the primary householder has the lowest median household income of $30,781, with 15 households (3.9%) in this group.
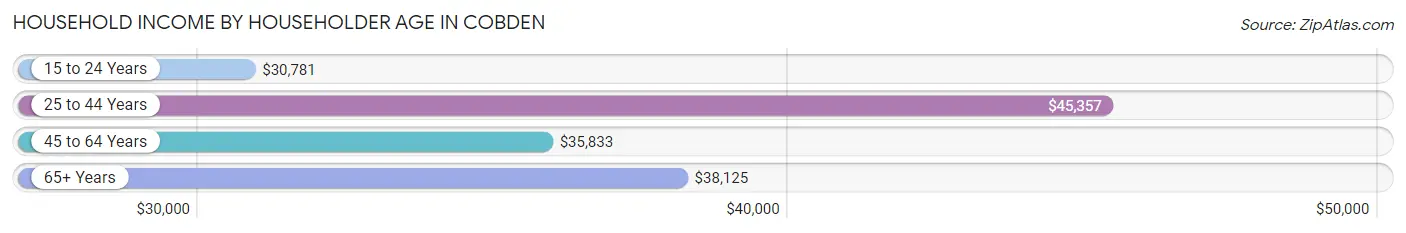
| Income Bracket | # Households | Median Income |
| 15 to 24 Years | 15 (3.9%) | $30,781 |
| 25 to 44 Years | 62 (16.2%) | $45,357 |
| 45 to 64 Years | 184 (47.9%) | $35,833 |
| 65+ Years | 123 (32.0%) | $38,125 |
| Total | 384 (100.0%) | $38,929 |
Poverty in Cobden
Income Below Poverty by Sex and Age in Cobden
With 34.7% poverty level for males and 23.8% for females among the residents of Cobden, 25 to 34 year old males and 6 to 11 year old females are the most vulnerable to poverty, with 2 males (100.0%) and 14 females (70.0%) in their respective age groups living below the poverty level.
| Age Bracket | Male | Female |
| Under 5 Years | 0 (0.0%) | 10 (66.7%) |
| 5 Years | 0 (0.0%) | 0 (0.0%) |
| 6 to 11 Years | 0 (0.0%) | 14 (70.0%) |
| 12 to 14 Years | 0 (0.0%) | 0 (0.0%) |
| 15 Years | 12 (66.7%) | 0 (0.0%) |
| 16 and 17 Years | 0 (0.0%) | 0 (0.0%) |
| 18 to 24 Years | 43 (62.3%) | 21 (36.2%) |
| 25 to 34 Years | 2 (100.0%) | 11 (37.9%) |
| 35 to 44 Years | 32 (34.0%) | 8 (9.9%) |
| 45 to 54 Years | 65 (47.8%) | 20 (26.7%) |
| 55 to 64 Years | 29 (56.9%) | 16 (32.7%) |
| 65 to 74 Years | 5 (7.7%) | 1 (1.7%) |
| 75 Years and over | 0 (0.0%) | 9 (28.1%) |
| Total | 188 (34.7%) | 110 (23.8%) |
Income Above Poverty by Sex and Age in Cobden
According to the poverty statistics in Cobden, males aged under 5 years and females aged 5 years are the age groups that are most secure financially, with 100.0% of males and 100.0% of females in these age groups living above the poverty line.
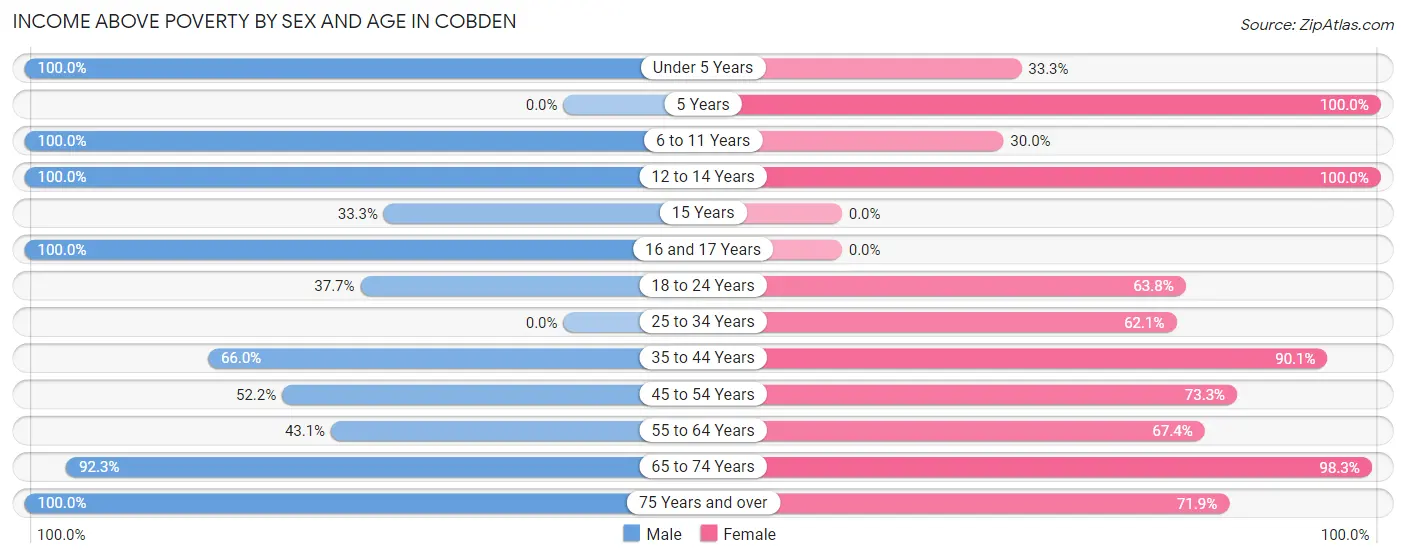
| Age Bracket | Male | Female |
| Under 5 Years | 7 (100.0%) | 5 (33.3%) |
| 5 Years | 0 (0.0%) | 14 (100.0%) |
| 6 to 11 Years | 13 (100.0%) | 6 (30.0%) |
| 12 to 14 Years | 19 (100.0%) | 29 (100.0%) |
| 15 Years | 6 (33.3%) | 0 (0.0%) |
| 16 and 17 Years | 16 (100.0%) | 0 (0.0%) |
| 18 to 24 Years | 26 (37.7%) | 37 (63.8%) |
| 25 to 34 Years | 0 (0.0%) | 18 (62.1%) |
| 35 to 44 Years | 62 (66.0%) | 73 (90.1%) |
| 45 to 54 Years | 71 (52.2%) | 55 (73.3%) |
| 55 to 64 Years | 22 (43.1%) | 33 (67.3%) |
| 65 to 74 Years | 60 (92.3%) | 59 (98.3%) |
| 75 Years and over | 52 (100.0%) | 23 (71.9%) |
| Total | 354 (65.3%) | 352 (76.2%) |
Income Below Poverty Among Married-Couple Families in Cobden
The poverty statistics for married-couple families in Cobden show that 14.4% or 22 of the total 153 families live below the poverty line. Families with 1 or 2 children have the highest poverty rate of 27.9%, comprising of 22 families. On the other hand, families with no children have the lowest poverty rate of 0.0%, which includes 0 families.
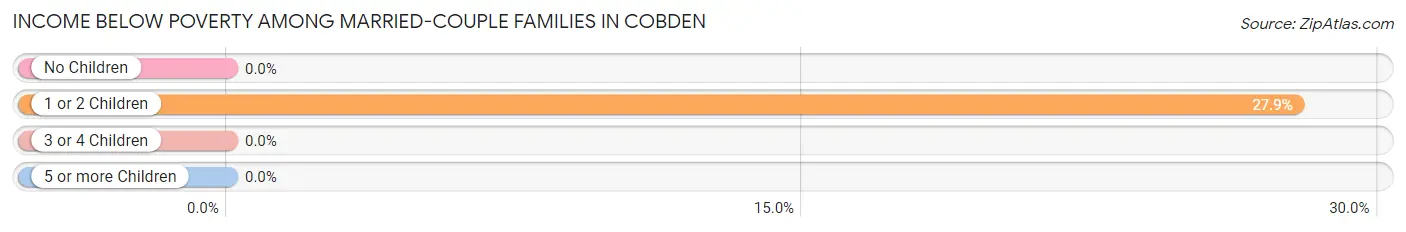
| Children | Above Poverty | Below Poverty |
| No Children | 72 (100.0%) | 0 (0.0%) |
| 1 or 2 Children | 57 (72.2%) | 22 (27.9%) |
| 3 or 4 Children | 2 (100.0%) | 0 (0.0%) |
| 5 or more Children | 0 (0.0%) | 0 (0.0%) |
| Total | 131 (85.6%) | 22 (14.4%) |
Income Below Poverty Among Single-Parent Households in Cobden
According to the poverty data in Cobden, 37.5% or 15 single-father households and 28.0% or 14 single-mother households are living below the poverty line. Among single-father households, those with no children have the highest poverty rate, with 15 households (46.9%) experiencing poverty. Likewise, among single-mother households, those with 1 or 2 children have the highest poverty rate, with 14 households (46.7%) falling below the poverty line.
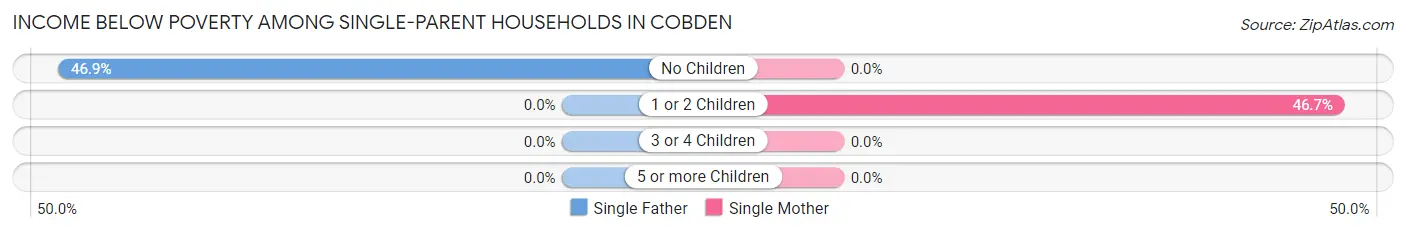
| Children | Single Father | Single Mother |
| No Children | 15 (46.9%) | 0 (0.0%) |
| 1 or 2 Children | 0 (0.0%) | 14 (46.7%) |
| 3 or 4 Children | 0 (0.0%) | 0 (0.0%) |
| 5 or more Children | 0 (0.0%) | 0 (0.0%) |
| Total | 15 (37.5%) | 14 (28.0%) |
Income Below Poverty Among Married-Couple vs Single-Parent Households in Cobden
The poverty data for Cobden shows that 22 of the married-couple family households (14.4%) and 29 of the single-parent households (32.2%) are living below the poverty level. Within the married-couple family households, those with 1 or 2 children have the highest poverty rate, with 22 households (27.9%) falling below the poverty line. Among the single-parent households, those with 1 or 2 children have the highest poverty rate, with 14 household (36.8%) living below poverty.
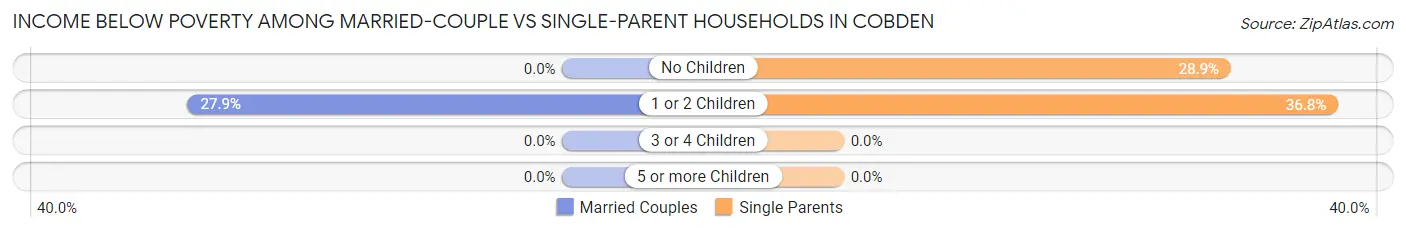
| Children | Married-Couple Families | Single-Parent Households |
| No Children | 0 (0.0%) | 15 (28.8%) |
| 1 or 2 Children | 22 (27.9%) | 14 (36.8%) |
| 3 or 4 Children | 0 (0.0%) | 0 (0.0%) |
| 5 or more Children | 0 (0.0%) | 0 (0.0%) |
| Total | 22 (14.4%) | 29 (32.2%) |
Race in Cobden
The most populous races in Cobden are White / Caucasian (659 | 64.4%), Hispanic or Latino (337 | 32.9%), and Two or more Races (309 | 30.2%).
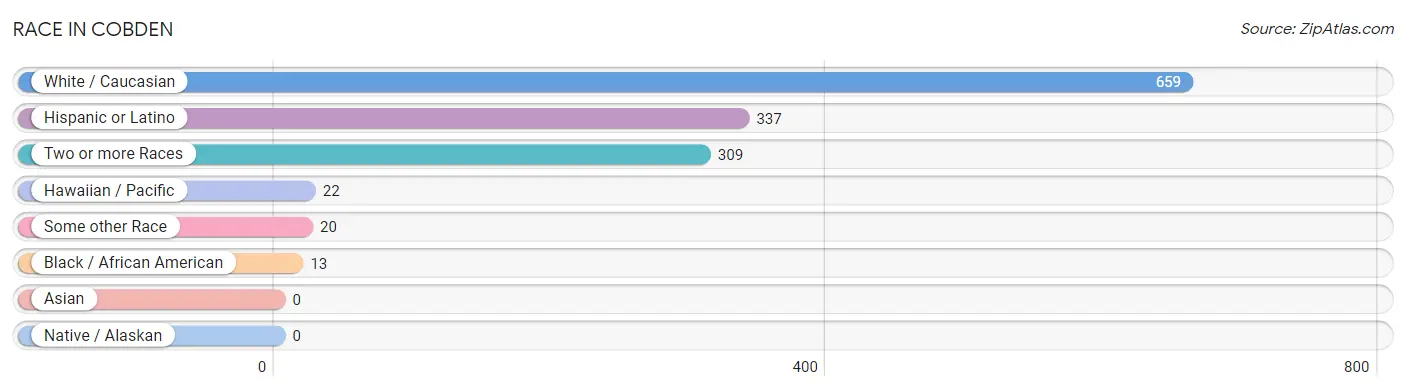
| Race | # Population | % Population |
| Asian | 0 | 0.0% |
| Black / African American | 13 | 1.3% |
| Hawaiian / Pacific | 22 | 2.1% |
| Hispanic or Latino | 337 | 32.9% |
| Native / Alaskan | 0 | 0.0% |
| White / Caucasian | 659 | 64.4% |
| Two or more Races | 309 | 30.2% |
| Some other Race | 20 | 2.0% |
| Total | 1,023 | 100.0% |
Ancestry in Cobden
The most populous ancestries reported in Cobden are Mexican (332 | 32.5%), German (190 | 18.6%), English (81 | 7.9%), Irish (75 | 7.3%), and Italian (35 | 3.4%), together accounting for 69.7% of all Cobden residents.
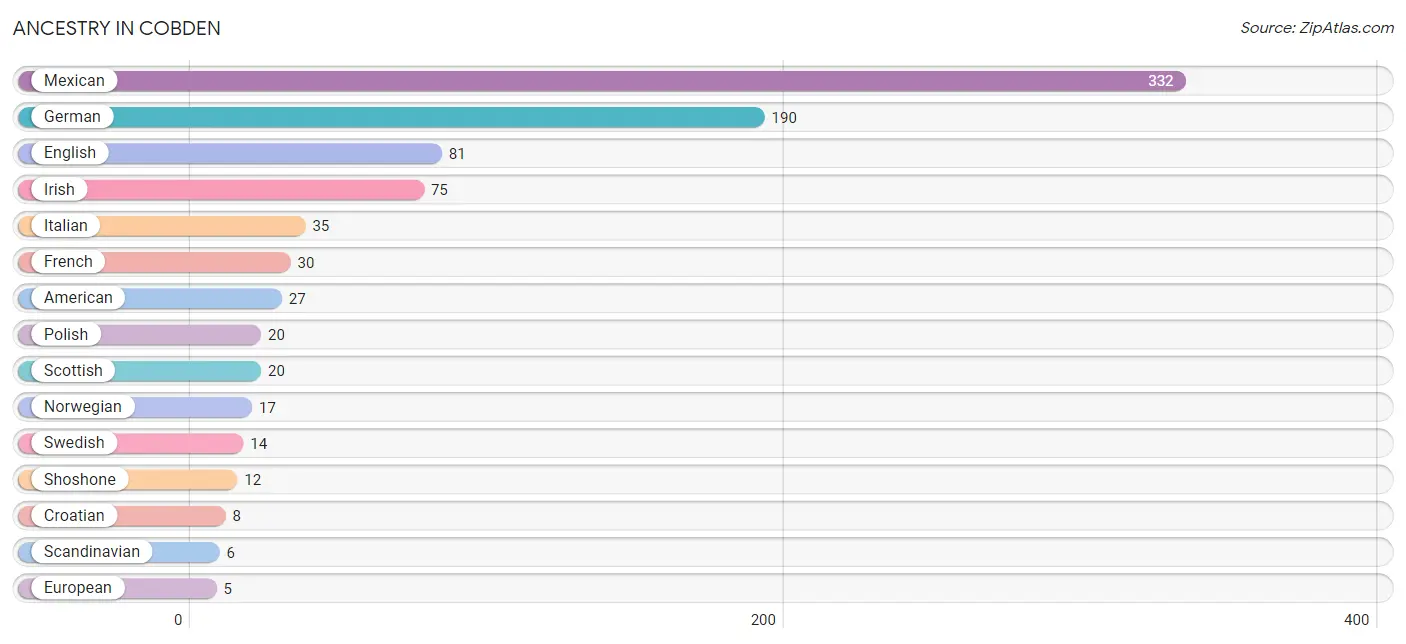
| Ancestry | # Population | % Population |
| American | 27 | 2.6% |
| British | 3 | 0.3% |
| Croatian | 8 | 0.8% |
| Eastern European | 3 | 0.3% |
| English | 81 | 7.9% |
| European | 5 | 0.5% |
| French | 30 | 2.9% |
| German | 190 | 18.6% |
| Greek | 2 | 0.2% |
| Indian (Asian) | 4 | 0.4% |
| Irish | 75 | 7.3% |
| Italian | 35 | 3.4% |
| Lithuanian | 5 | 0.5% |
| Mexican | 332 | 32.5% |
| Norwegian | 17 | 1.7% |
| Polish | 20 | 2.0% |
| Russian | 4 | 0.4% |
| Scandinavian | 6 | 0.6% |
| Scottish | 20 | 2.0% |
| Shoshone | 12 | 1.2% |
| Spanish | 5 | 0.5% |
| Swedish | 14 | 1.4% |
| Swiss | 3 | 0.3% | View All 23 Rows |
Immigrants in Cobden
The most numerous immigrant groups reported in Cobden came from Central America (179 | 17.5%), Latin America (179 | 17.5%), Mexico (179 | 17.5%), Europe (6 | 0.6%), and Germany (6 | 0.6%), together accounting for 53.7% of all Cobden residents.
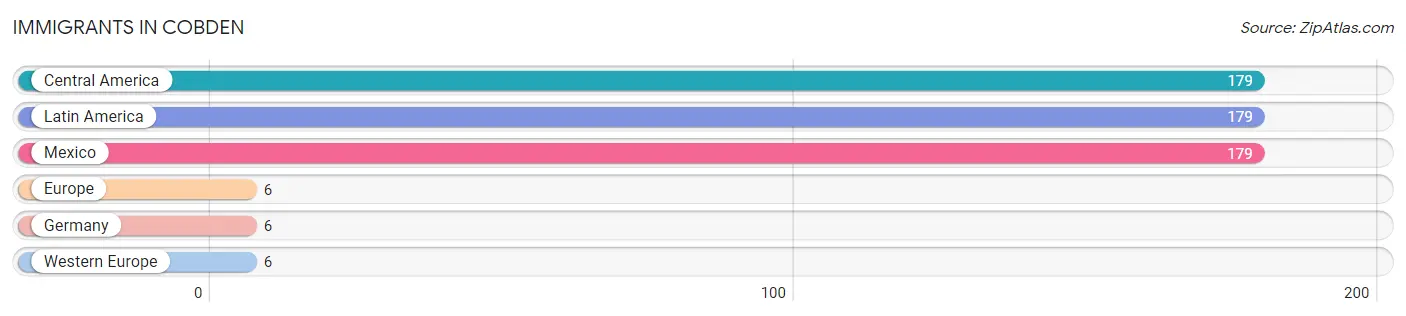
| Immigration Origin | # Population | % Population |
| Central America | 179 | 17.5% |
| Europe | 6 | 0.6% |
| Germany | 6 | 0.6% |
| Latin America | 179 | 17.5% |
| Mexico | 179 | 17.5% |
| Western Europe | 6 | 0.6% | View All 6 Rows |
Sex and Age in Cobden
Sex and Age in Cobden
The most populous age groups in Cobden are 50 to 54 Years (111 | 20.5%) for men and 70 to 74 Years (48 | 10.0%) for women.
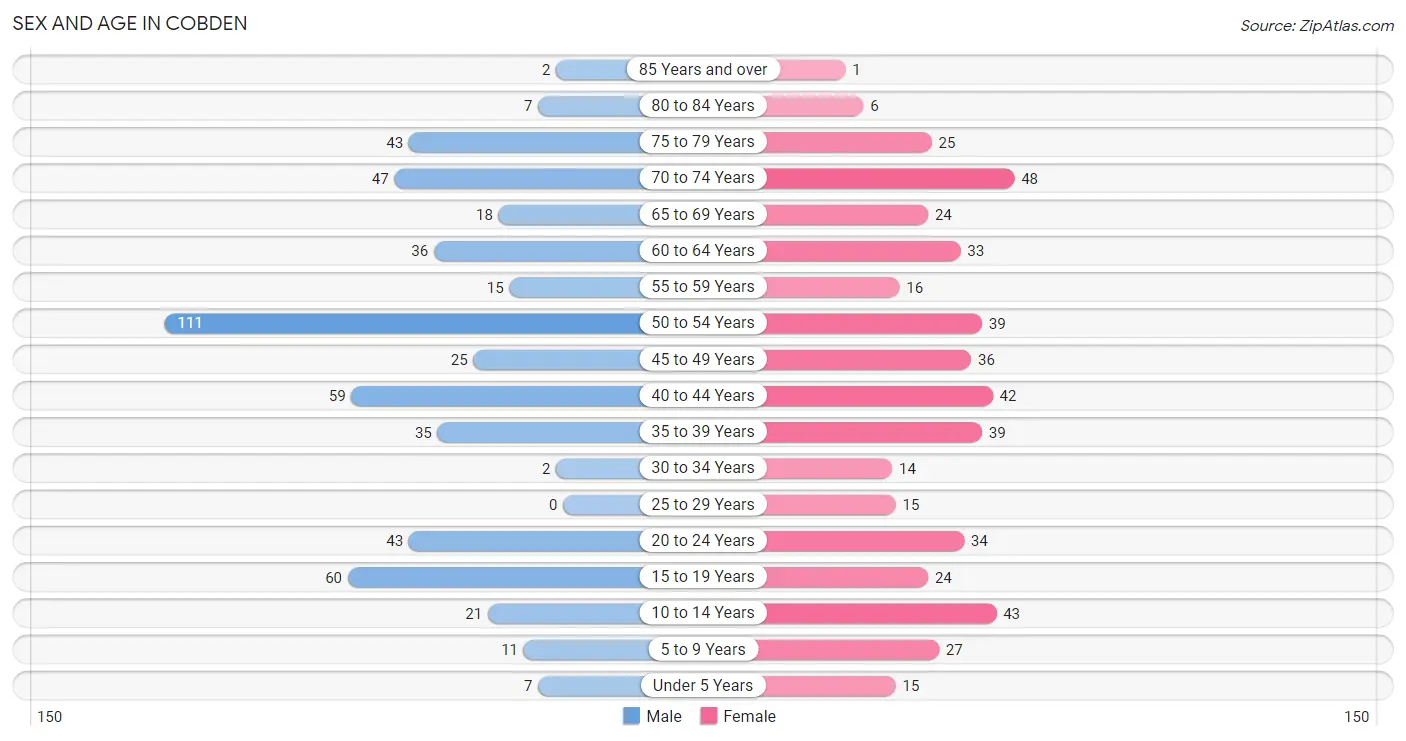
| Age Bracket | Male | Female |
| Under 5 Years | 7 (1.3%) | 15 (3.1%) |
| 5 to 9 Years | 11 (2.0%) | 27 (5.6%) |
| 10 to 14 Years | 21 (3.9%) | 43 (8.9%) |
| 15 to 19 Years | 60 (11.1%) | 24 (5.0%) |
| 20 to 24 Years | 43 (7.9%) | 34 (7.1%) |
| 25 to 29 Years | 0 (0.0%) | 15 (3.1%) |
| 30 to 34 Years | 2 (0.4%) | 14 (2.9%) |
| 35 to 39 Years | 35 (6.5%) | 39 (8.1%) |
| 40 to 44 Years | 59 (10.9%) | 42 (8.7%) |
| 45 to 49 Years | 25 (4.6%) | 36 (7.5%) |
| 50 to 54 Years | 111 (20.5%) | 39 (8.1%) |
| 55 to 59 Years | 15 (2.8%) | 16 (3.3%) |
| 60 to 64 Years | 36 (6.6%) | 33 (6.9%) |
| 65 to 69 Years | 18 (3.3%) | 24 (5.0%) |
| 70 to 74 Years | 47 (8.7%) | 48 (10.0%) |
| 75 to 79 Years | 43 (7.9%) | 25 (5.2%) |
| 80 to 84 Years | 7 (1.3%) | 6 (1.3%) |
| 85 Years and over | 2 (0.4%) | 1 (0.2%) |
| Total | 542 (100.0%) | 481 (100.0%) |
Families and Households in Cobden
Median Family Size in Cobden
The median family size in Cobden is 3.12 persons per family, with married-couple families (153 | 63.0%) accounting for the largest median family size of 3.24 persons per family. On the other hand, single male/father families (40 | 16.5%) represent the smallest median family size with 2.90 persons per family.
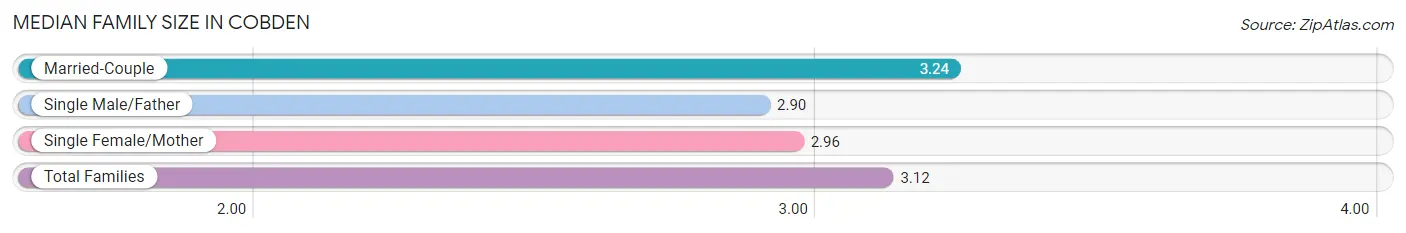
| Family Type | # Families | Family Size |
| Married-Couple | 153 (63.0%) | 3.24 |
| Single Male/Father | 40 (16.5%) | 2.90 |
| Single Female/Mother | 50 (20.6%) | 2.96 |
| Total Families | 243 (100.0%) | 3.12 |
Median Household Size in Cobden
The median household size in Cobden is 2.56 persons per household, with single female/mother households (50 | 13.0%) accounting for the largest median household size of 3.28 persons per household. non-family households (141 | 36.7%) represent the smallest median household size with 1.41 persons per household.
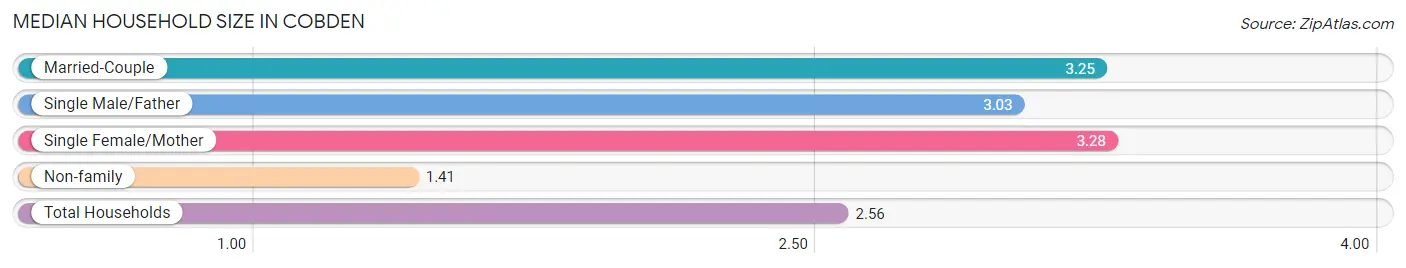
| Household Type | # Households | Household Size |
| Married-Couple | 153 (39.8%) | 3.25 |
| Single Male/Father | 40 (10.4%) | 3.03 |
| Single Female/Mother | 50 (13.0%) | 3.28 |
| Non-family | 141 (36.7%) | 1.41 |
| Total Households | 384 (100.0%) | 2.56 |
Household Size by Marriage Status in Cobden
Out of a total of 384 households in Cobden, 243 (63.3%) are family households, while 141 (36.7%) are nonfamily households. The most numerous type of family households are 2-person households, comprising 99, and the most common type of nonfamily households are 1-person households, comprising 112.
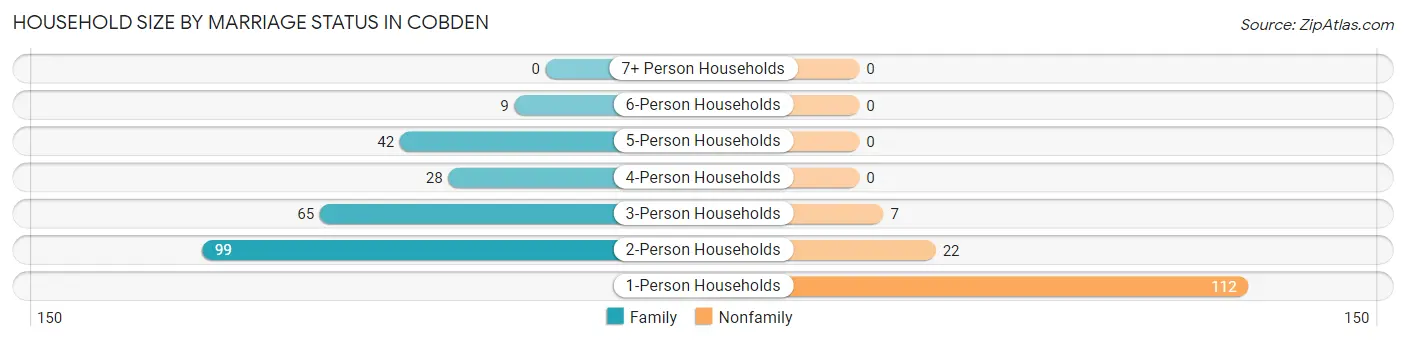
| Household Size | Family Households | Nonfamily Households |
| 1-Person Households | - | 112 (29.2%) |
| 2-Person Households | 99 (25.8%) | 22 (5.7%) |
| 3-Person Households | 65 (16.9%) | 7 (1.8%) |
| 4-Person Households | 28 (7.3%) | 0 (0.0%) |
| 5-Person Households | 42 (10.9%) | 0 (0.0%) |
| 6-Person Households | 9 (2.3%) | 0 (0.0%) |
| 7+ Person Households | 0 (0.0%) | 0 (0.0%) |
| Total | 243 (63.3%) | 141 (36.7%) |
Female Fertility in Cobden
Fertility by Age in Cobden
Average fertility rate in Cobden is 31.0 births per 1,000 women. Women in the age bracket of 20 to 34 years have the highest fertility rate with 111.0 births per 1,000 women. Women in the age bracket of 20 to 34 years acount for 100.0% of all women with births.
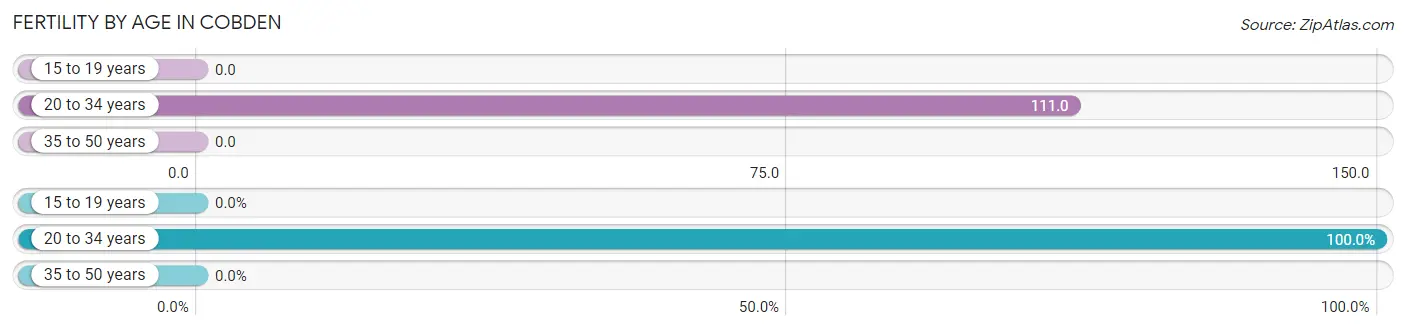
| Age Bracket | Women with Births | Births / 1,000 Women |
| 15 to 19 years | 0 (0.0%) | 0.0 |
| 20 to 34 years | 7 (100.0%) | 111.0 |
| 35 to 50 years | 0 (0.0%) | 0.0 |
| Total | 7 (100.0%) | 31.0 |
Fertility by Age by Marriage Status in Cobden
28.6% of women with births (7) in Cobden are married. The highest percentage of unmarried women with births falls into 20 to 34 years age bracket with 71.4% of them unmarried at the time of birth, while the lowest percentage of unmarried women with births belong to 20 to 34 years age bracket with 71.4% of them unmarried.
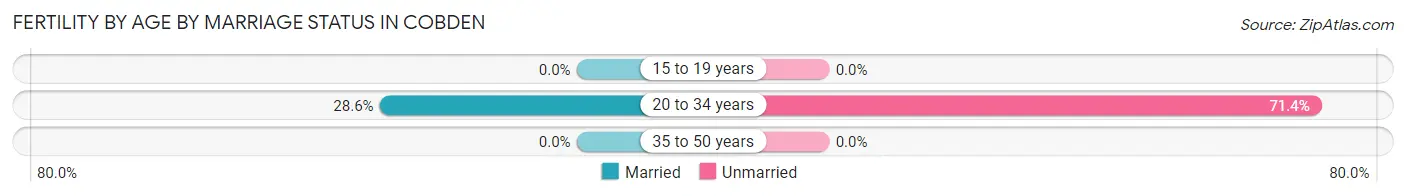
| Age Bracket | Married | Unmarried |
| 15 to 19 years | 0 (0.0%) | 0 (0.0%) |
| 20 to 34 years | 2 (28.6%) | 5 (71.4%) |
| 35 to 50 years | 0 (0.0%) | 0 (0.0%) |
| Total | 2 (28.6%) | 5 (71.4%) |
Fertility by Education in Cobden
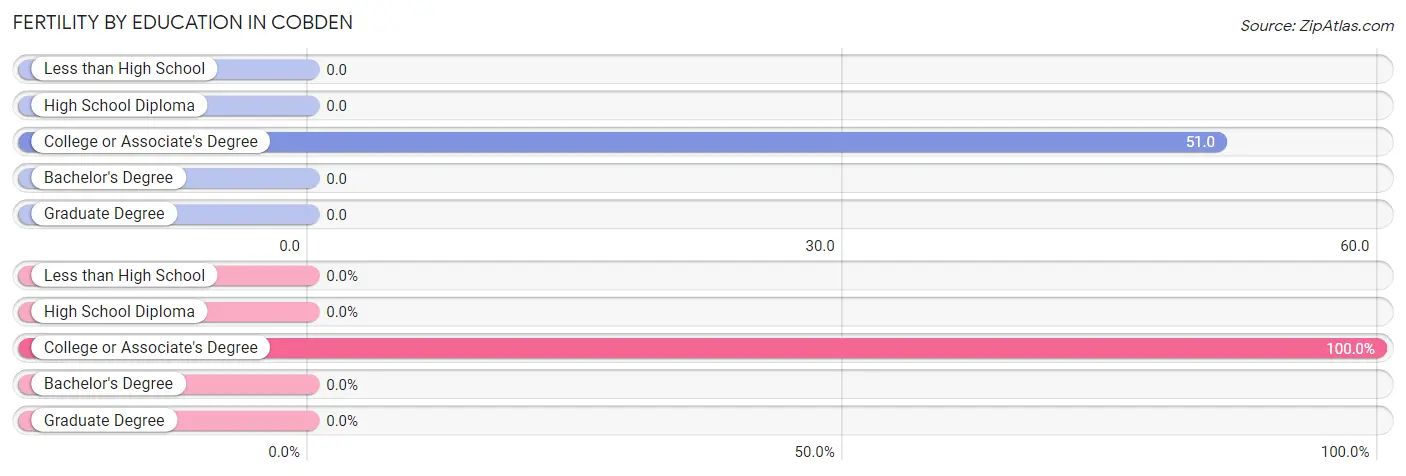
| Educational Attainment | Women with Births | Births / 1,000 Women |
| Less than High School | 0 (0.0%) | 0.0 |
| High School Diploma | 0 (0.0%) | 0.0 |
| College or Associate's Degree | 7 (100.0%) | 51.0 |
| Bachelor's Degree | 0 (0.0%) | 0.0 |
| Graduate Degree | 0 (0.0%) | 0.0 |
| Total | 7 (100.0%) | 31.0 |
Fertility by Education by Marriage Status in Cobden
71.4% of women with births in Cobden are unmarried. Women with the educational attainment of college or associate's degree are most likely to be married with 28.6% of them married at childbirth, while women with the educational attainment of college or associate's degree are least likely to be married with 71.4% of them unmarried at childbirth.
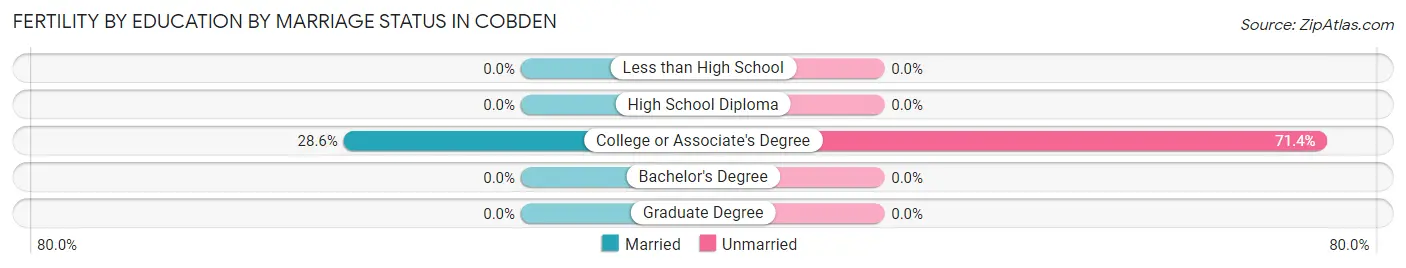
| Educational Attainment | Married | Unmarried |
| Less than High School | 0 (0.0%) | 0 (0.0%) |
| High School Diploma | 0 (0.0%) | 0 (0.0%) |
| College or Associate's Degree | 2 (28.6%) | 5 (71.4%) |
| Bachelor's Degree | 0 (0.0%) | 0 (0.0%) |
| Graduate Degree | 0 (0.0%) | 0 (0.0%) |
| Total | 2 (28.6%) | 5 (71.4%) |
Employment Characteristics in Cobden
Employment by Class of Employer in Cobden
Among the 367 employed individuals in Cobden, private company employees (200 | 54.5%), local government employees (68 | 18.5%), and not-for-profit organizations (36 | 9.8%) make up the most common classes of employment.
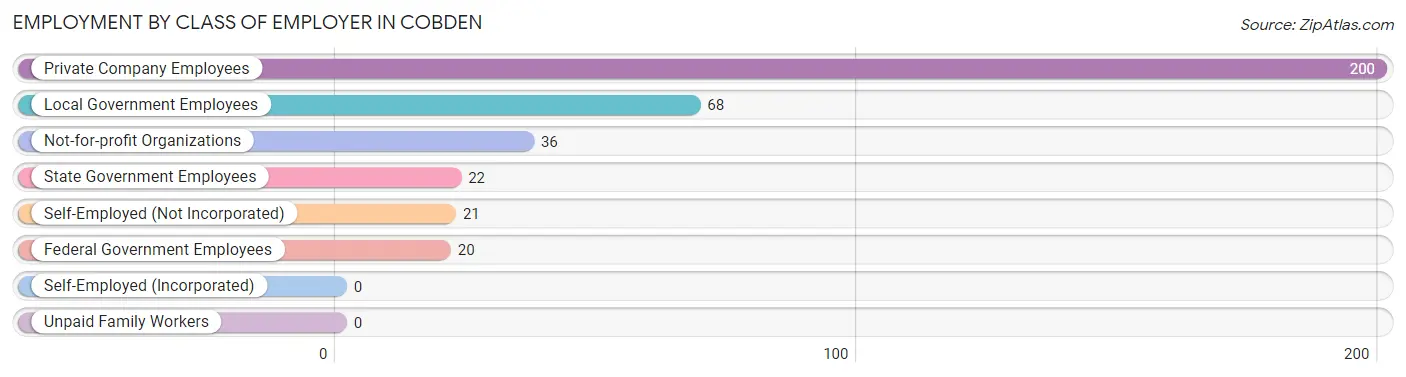
| Employer Class | # Employees | % Employees |
| Private Company Employees | 200 | 54.5% |
| Self-Employed (Incorporated) | 0 | 0.0% |
| Self-Employed (Not Incorporated) | 21 | 5.7% |
| Not-for-profit Organizations | 36 | 9.8% |
| Local Government Employees | 68 | 18.5% |
| State Government Employees | 22 | 6.0% |
| Federal Government Employees | 20 | 5.4% |
| Unpaid Family Workers | 0 | 0.0% |
| Total | 367 | 100.0% |
Employment Status by Age in Cobden
According to the labor force statistics for Cobden, out of the total population over 16 years of age (881), 44.4% or 391 individuals are in the labor force, with 6.1% or 24 of them unemployed. The age group with the highest labor force participation rate is 35 to 44 years, with 74.9% or 131 individuals in the labor force. Within the labor force, the 60 to 64 years age range has the highest percentage of unemployed individuals, with 63.2% or 24 of them being unemployed.
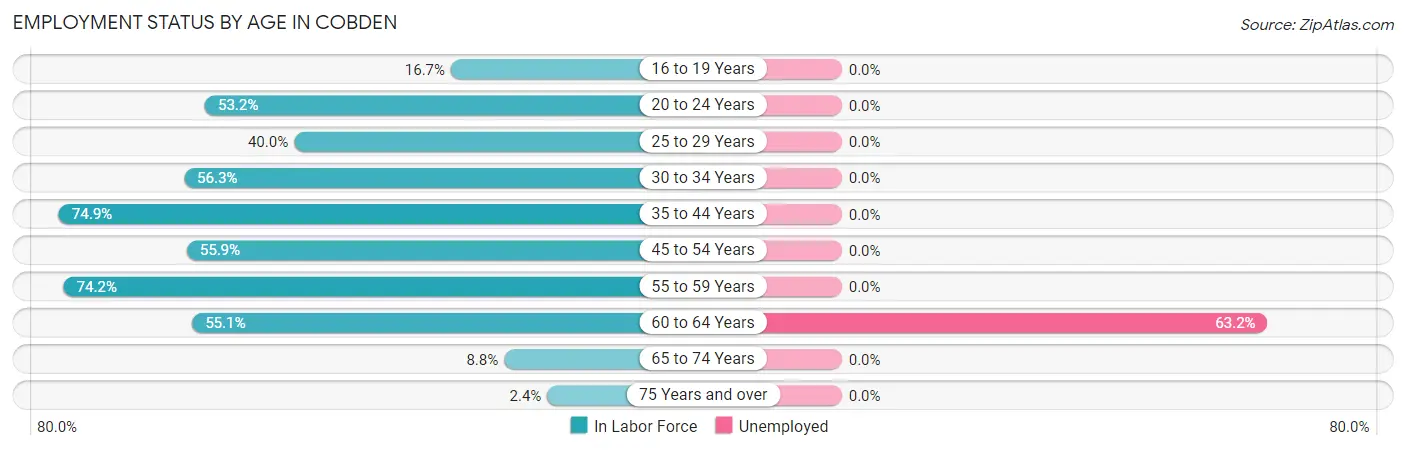
| Age Bracket | In Labor Force | Unemployed |
| 16 to 19 Years | 11 (16.7%) | 0 (0.0%) |
| 20 to 24 Years | 41 (53.2%) | 0 (0.0%) |
| 25 to 29 Years | 6 (40.0%) | 0 (0.0%) |
| 30 to 34 Years | 9 (56.3%) | 0 (0.0%) |
| 35 to 44 Years | 131 (74.9%) | 0 (0.0%) |
| 45 to 54 Years | 118 (55.9%) | 0 (0.0%) |
| 55 to 59 Years | 23 (74.2%) | 0 (0.0%) |
| 60 to 64 Years | 38 (55.1%) | 24 (63.2%) |
| 65 to 74 Years | 12 (8.8%) | 0 (0.0%) |
| 75 Years and over | 2 (2.4%) | 0 (0.0%) |
| Total | 391 (44.4%) | 24 (6.1%) |
Employment Status by Educational Attainment in Cobden
According to labor force statistics for Cobden, 62.9% of individuals (325) out of the total population between 25 and 64 years of age (517) are in the labor force, with 7.4% or 24 of them being unemployed. The group with the highest labor force participation rate are those with the educational attainment of college / associate degree, with 79.8% or 197 individuals in the labor force. Within the labor force, individuals with less than high school education have the highest percentage of unemployment, with 41.4% or 24 of them being unemployed.
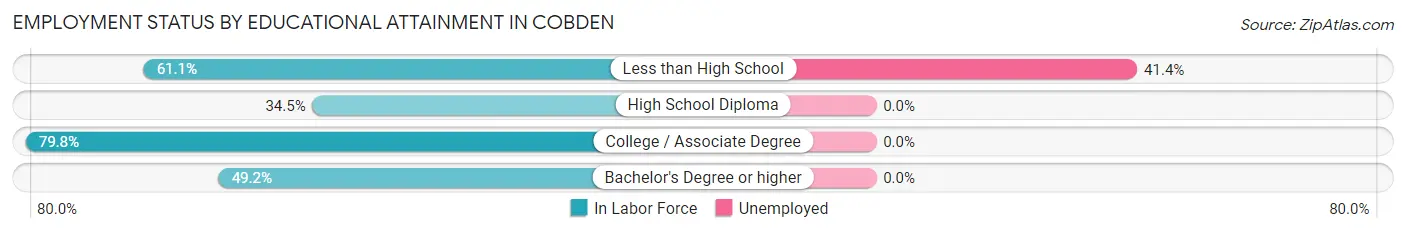
| Educational Attainment | In Labor Force | Unemployed |
| Less than High School | 58 (61.1%) | 39 (41.4%) |
| High School Diploma | 38 (34.5%) | 0 (0.0%) |
| College / Associate Degree | 197 (79.8%) | 0 (0.0%) |
| Bachelor's Degree or higher | 32 (49.2%) | 0 (0.0%) |
| Total | 325 (62.9%) | 38 (7.4%) |
Employment Occupations by Sex in Cobden
Management, Business, Science and Arts Occupations
The most common Management, Business, Science and Arts occupations in Cobden are Community & Social Service (47 | 12.8%), Education Instruction & Library (35 | 9.5%), Health Diagnosing & Treating (18 | 4.9%), Arts, Media & Entertainment (12 | 3.3%), and Management (5 | 1.4%).
Management, Business, Science and Arts Occupations by Sex
Within the Management, Business, Science and Arts occupations in Cobden, the most male-oriented occupations are Computers, Engineering & Science (100.0%), Architecture & Engineering (100.0%), and Life, Physical & Social Science (100.0%), while the most female-oriented occupations are Business & Financial (100.0%), Arts, Media & Entertainment (100.0%), and Health Technologists (100.0%).
| Occupation | Male | Female |
| Management | 3 (60.0%) | 2 (40.0%) |
| Business & Financial | 0 (0.0%) | 5 (100.0%) |
| Computers, Engineering & Science | 4 (100.0%) | 0 (0.0%) |
| Computers & Mathematics | 0 (0.0%) | 0 (0.0%) |
| Architecture & Engineering | 2 (100.0%) | 0 (0.0%) |
| Life, Physical & Social Science | 2 (100.0%) | 0 (0.0%) |
| Community & Social Service | 4 (8.5%) | 43 (91.5%) |
| Education, Arts & Media | 0 (0.0%) | 0 (0.0%) |
| Legal Services & Support | 0 (0.0%) | 0 (0.0%) |
| Education Instruction & Library | 4 (11.4%) | 31 (88.6%) |
| Arts, Media & Entertainment | 0 (0.0%) | 12 (100.0%) |
| Health Diagnosing & Treating | 4 (22.2%) | 14 (77.8%) |
| Health Technologists | 0 (0.0%) | 2 (100.0%) |
| Total (Category) | 15 (19.0%) | 64 (81.0%) |
| Total (Overall) | 144 (39.2%) | 223 (60.8%) |
Services Occupations
The most common Services occupations in Cobden are Cleaning & Maintenance (47 | 12.8%), Healthcare Support (34 | 9.3%), Food Preparation & Serving (26 | 7.1%), Security & Protection (17 | 4.6%), and Personal Care & Service (14 | 3.8%).
Services Occupations by Sex
Within the Services occupations in Cobden, the most male-oriented occupations are Law Enforcement (100.0%), Security & Protection (82.4%), and Firefighting & Prevention (76.9%), while the most female-oriented occupations are Healthcare Support (76.5%), Food Preparation & Serving (73.1%), and Personal Care & Service (64.3%).
| Occupation | Male | Female |
| Healthcare Support | 8 (23.5%) | 26 (76.5%) |
| Security & Protection | 14 (82.4%) | 3 (17.6%) |
| Firefighting & Prevention | 10 (76.9%) | 3 (23.1%) |
| Law Enforcement | 4 (100.0%) | 0 (0.0%) |
| Food Preparation & Serving | 7 (26.9%) | 19 (73.1%) |
| Cleaning & Maintenance | 17 (36.2%) | 30 (63.8%) |
| Personal Care & Service | 5 (35.7%) | 9 (64.3%) |
| Total (Category) | 51 (37.0%) | 87 (63.0%) |
| Total (Overall) | 144 (39.2%) | 223 (60.8%) |
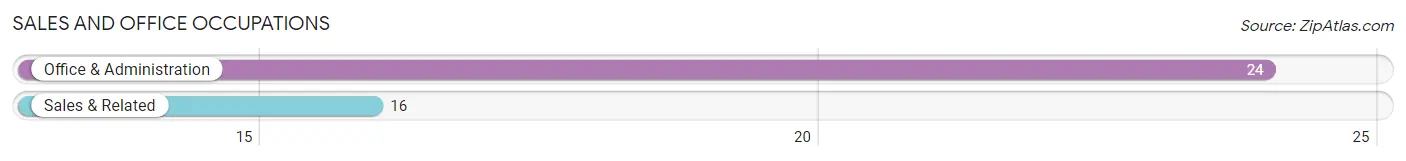
Sales and Office Occupations
The most common Sales and Office occupations in Cobden are Office & Administration (24 | 6.5%), and Sales & Related (16 | 4.4%).
Sales and Office Occupations by Sex
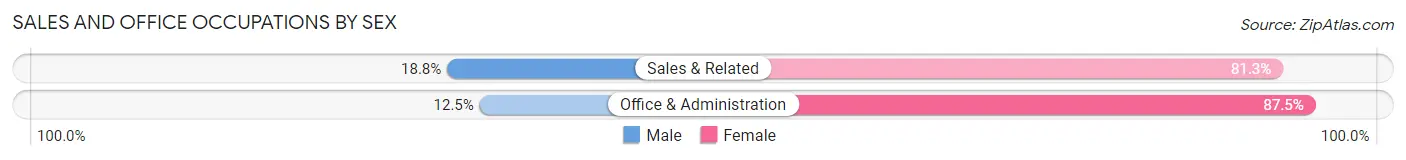
| Occupation | Male | Female |
| Sales & Related | 3 (18.8%) | 13 (81.2%) |
| Office & Administration | 3 (12.5%) | 21 (87.5%) |
| Total (Category) | 6 (15.0%) | 34 (85.0%) |
| Total (Overall) | 144 (39.2%) | 223 (60.8%) |
Natural Resources, Construction and Maintenance Occupations
The most common Natural Resources, Construction and Maintenance occupations in Cobden are , and Construction & Extraction (18 | 4.9%).
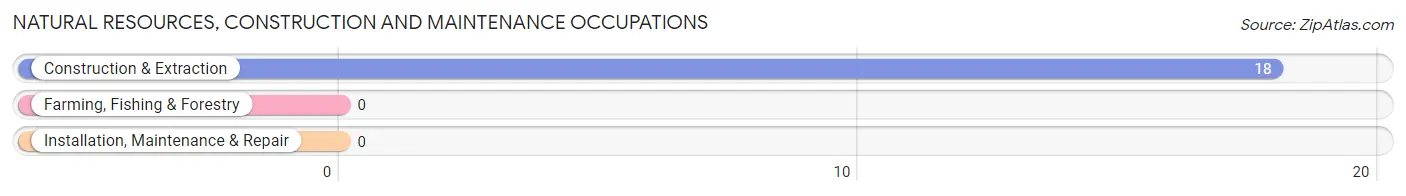
Natural Resources, Construction and Maintenance Occupations by Sex
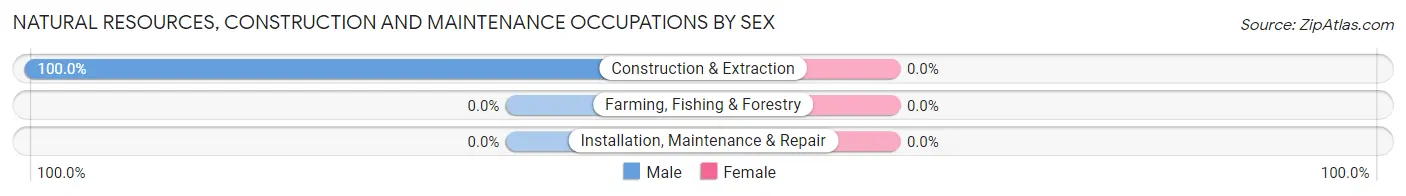
| Occupation | Male | Female |
| Farming, Fishing & Forestry | 0 (0.0%) | 0 (0.0%) |
| Construction & Extraction | 18 (100.0%) | 0 (0.0%) |
| Installation, Maintenance & Repair | 0 (0.0%) | 0 (0.0%) |
| Total (Category) | 18 (100.0%) | 0 (0.0%) |
| Total (Overall) | 144 (39.2%) | 223 (60.8%) |
Production, Transportation and Moving Occupations
The most common Production, Transportation and Moving occupations in Cobden are Material Moving (40 | 10.9%), Transportation (27 | 7.4%), and Production (25 | 6.8%).
Production, Transportation and Moving Occupations by Sex
| Occupation | Male | Female |
| Production | 0 (0.0%) | 25 (100.0%) |
| Transportation | 19 (70.4%) | 8 (29.6%) |
| Material Moving | 35 (87.5%) | 5 (12.5%) |
| Total (Category) | 54 (58.7%) | 38 (41.3%) |
| Total (Overall) | 144 (39.2%) | 223 (60.8%) |
Employment Industries by Sex in Cobden
Employment Industries in Cobden
The major employment industries in Cobden include Health Care & Social Assistance (77 | 21.0%), Educational Services (55 | 15.0%), Retail Trade (46 | 12.5%), Accommodation & Food Services (46 | 12.5%), and Construction (24 | 6.5%).
Employment Industries by Sex in Cobden
The Cobden industries that see more men than women are Construction (100.0%), Manufacturing (100.0%), and Public Administration (91.3%), whereas the industries that tend to have a higher number of women are Finance & Insurance (100.0%), Administrative & Support (100.0%), and Educational Services (89.1%).
| Industry | Male | Female |
| Agriculture, Fishing & Hunting | 0 (0.0%) | 0 (0.0%) |
| Mining, Quarrying, & Extraction | 0 (0.0%) | 0 (0.0%) |
| Construction | 24 (100.0%) | 0 (0.0%) |
| Manufacturing | 19 (100.0%) | 0 (0.0%) |
| Wholesale Trade | 0 (0.0%) | 0 (0.0%) |
| Retail Trade | 10 (21.7%) | 36 (78.3%) |
| Transportation & Warehousing | 16 (80.0%) | 4 (20.0%) |
| Utilities | 0 (0.0%) | 0 (0.0%) |
| Information | 0 (0.0%) | 0 (0.0%) |
| Finance & Insurance | 0 (0.0%) | 12 (100.0%) |
| Real Estate, Rental & Leasing | 0 (0.0%) | 0 (0.0%) |
| Professional & Scientific | 0 (0.0%) | 0 (0.0%) |
| Enterprise Management | 0 (0.0%) | 0 (0.0%) |
| Administrative & Support | 0 (0.0%) | 1 (100.0%) |
| Educational Services | 6 (10.9%) | 49 (89.1%) |
| Health Care & Social Assistance | 17 (22.1%) | 60 (77.9%) |
| Arts, Entertainment & Recreation | 0 (0.0%) | 0 (0.0%) |
| Accommodation & Food Services | 16 (34.8%) | 30 (65.2%) |
| Public Administration | 21 (91.3%) | 2 (8.7%) |
| Total | 144 (39.2%) | 223 (60.8%) |
Education in Cobden
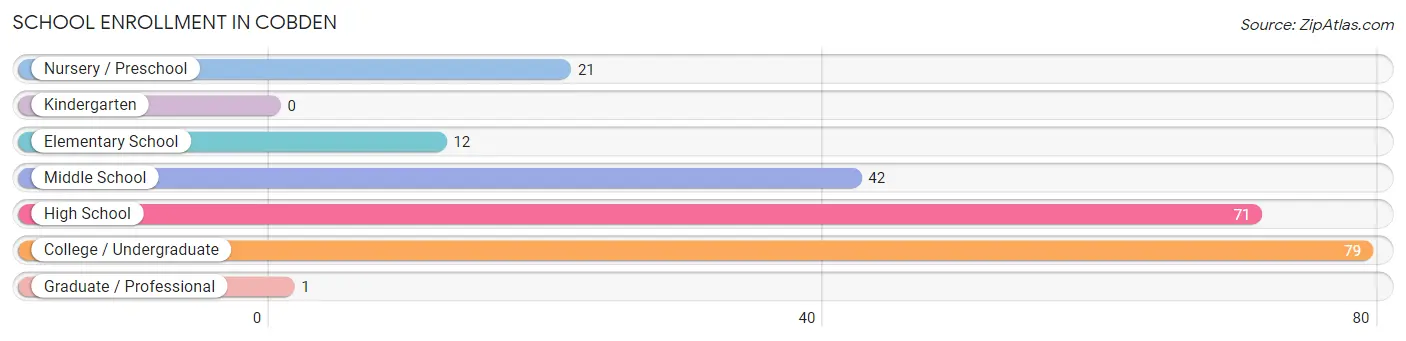
School Enrollment in Cobden
The most common levels of schooling among the 226 students in Cobden are college / undergraduate (79 | 35.0%), high school (71 | 31.4%), and middle school (42 | 18.6%).
| School Level | # Students | % Students |
| Nursery / Preschool | 21 | 9.3% |
| Kindergarten | 0 | 0.0% |
| Elementary School | 12 | 5.3% |
| Middle School | 42 | 18.6% |
| High School | 71 | 31.4% |
| College / Undergraduate | 79 | 35.0% |
| Graduate / Professional | 1 | 0.4% |
| Total | 226 | 100.0% |
School Enrollment by Age by Funding Source in Cobden
Out of a total of 226 students who are enrolled in schools in Cobden, 10 (4.4%) attend a private institution, while the remaining 216 (95.6%) are enrolled in public schools. The age group of 5 to 9 year old has the highest likelihood of being enrolled in private schools, with 3 (11.5% in the age bracket) enrolled. Conversely, the age group of 3 to 4 year olds has the lowest likelihood of being enrolled in a private school, with 7 (100.0% in the age bracket) attending a public institution.
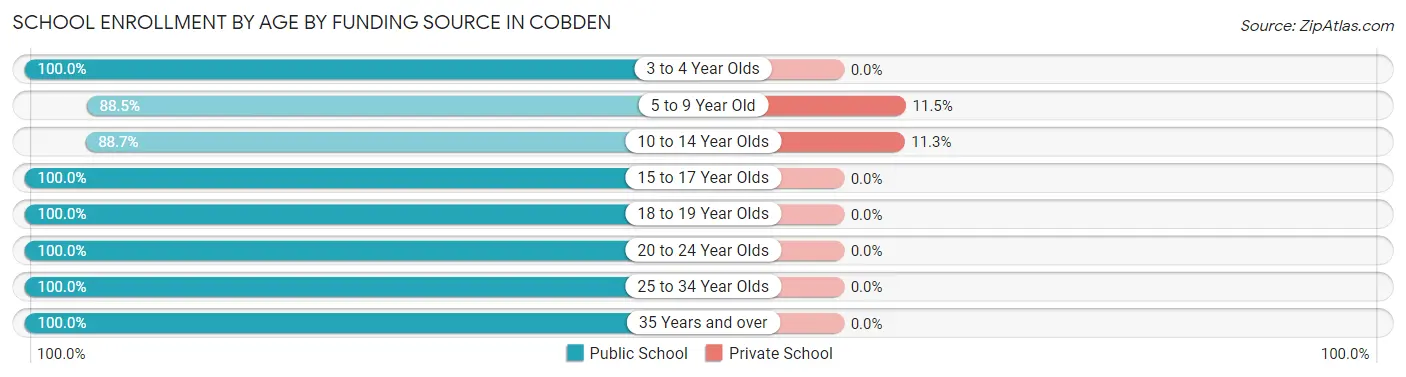
| Age Bracket | Public School | Private School |
| 3 to 4 Year Olds | 7 (100.0%) | 0 (0.0%) |
| 5 to 9 Year Old | 23 (88.5%) | 3 (11.5%) |
| 10 to 14 Year Olds | 55 (88.7%) | 7 (11.3%) |
| 15 to 17 Year Olds | 34 (100.0%) | 0 (0.0%) |
| 18 to 19 Year Olds | 41 (100.0%) | 0 (0.0%) |
| 20 to 24 Year Olds | 49 (100.0%) | 0 (0.0%) |
| 25 to 34 Year Olds | 4 (100.0%) | 0 (0.0%) |
| 35 Years and over | 3 (100.0%) | 0 (0.0%) |
| Total | 216 (95.6%) | 10 (4.4%) |
Educational Attainment by Field of Study in Cobden
Engineering (33 | 20.3%), business (33 | 20.3%), education (24 | 14.7%), visual & performing arts (20 | 12.3%), and liberal arts & history (14 | 8.6%) are the most common fields of study among 163 individuals in Cobden who have obtained a bachelor's degree or higher.
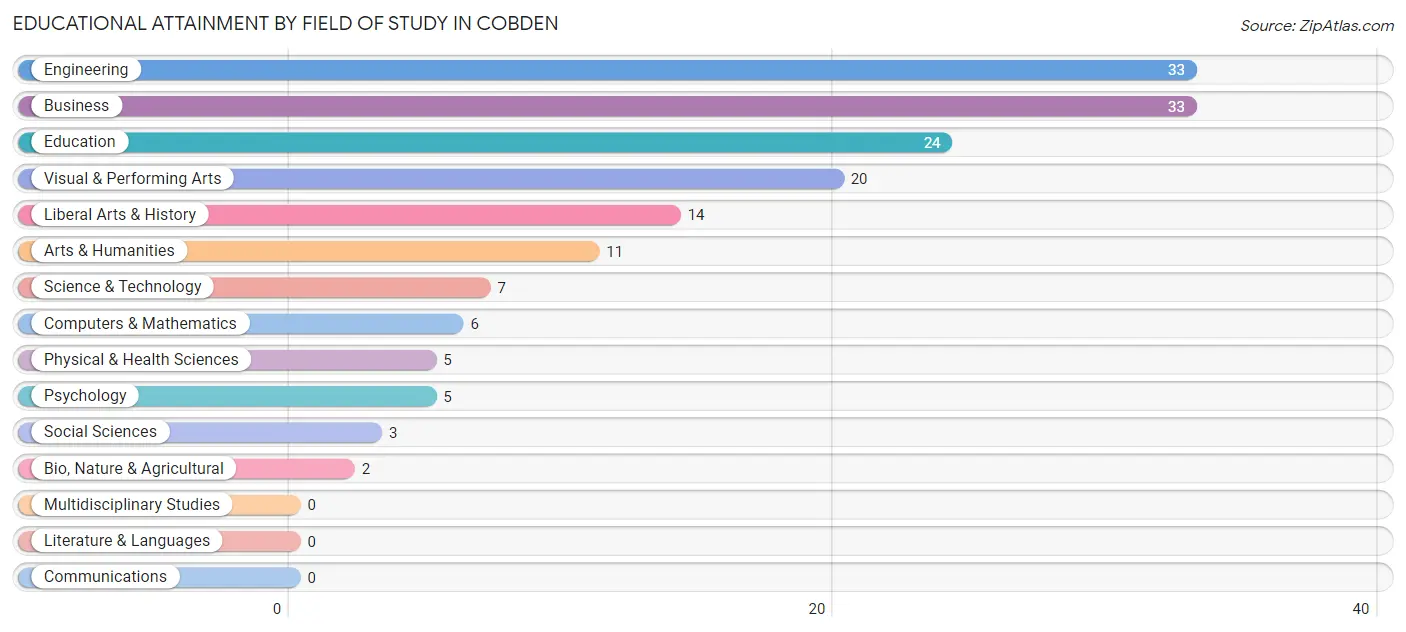
| Field of Study | # Graduates | % Graduates |
| Computers & Mathematics | 6 | 3.7% |
| Bio, Nature & Agricultural | 2 | 1.2% |
| Physical & Health Sciences | 5 | 3.1% |
| Psychology | 5 | 3.1% |
| Social Sciences | 3 | 1.8% |
| Engineering | 33 | 20.3% |
| Multidisciplinary Studies | 0 | 0.0% |
| Science & Technology | 7 | 4.3% |
| Business | 33 | 20.3% |
| Education | 24 | 14.7% |
| Literature & Languages | 0 | 0.0% |
| Liberal Arts & History | 14 | 8.6% |
| Visual & Performing Arts | 20 | 12.3% |
| Communications | 0 | 0.0% |
| Arts & Humanities | 11 | 6.8% |
| Total | 163 | 100.0% |
Transportation & Commute in Cobden
Vehicle Availability by Sex in Cobden
The most prevalent vehicle ownership categories in Cobden are males with 2 vehicles (43, accounting for 30.1%) and females with 2 vehicles (92, making up 19.6%).
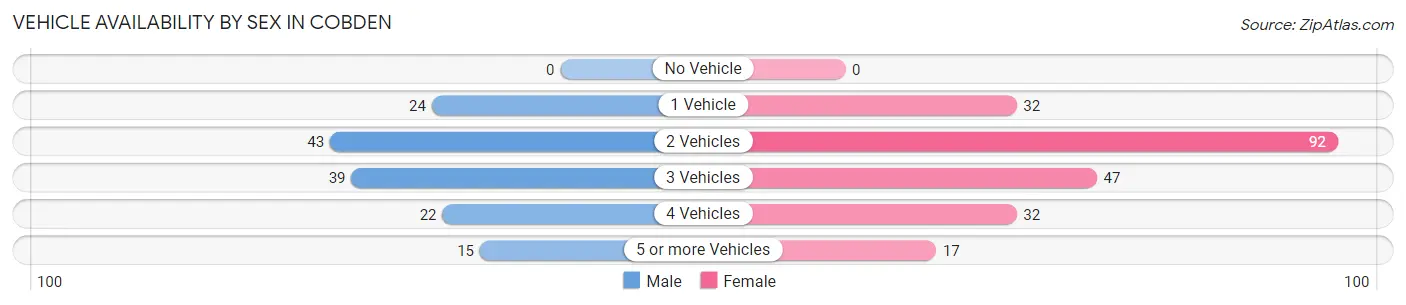
| Vehicles Available | Male | Female |
| No Vehicle | 0 (0.0%) | 0 (0.0%) |
| 1 Vehicle | 24 (16.8%) | 32 (14.5%) |
| 2 Vehicles | 43 (30.1%) | 92 (41.8%) |
| 3 Vehicles | 39 (27.3%) | 47 (21.4%) |
| 4 Vehicles | 22 (15.4%) | 32 (14.5%) |
| 5 or more Vehicles | 15 (10.5%) | 17 (7.7%) |
| Total | 143 (100.0%) | 220 (100.0%) |
Commute Time in Cobden
The most frequently occuring commute durations in Cobden are 30 to 34 minutes (128 commuters, 36.4%), 10 to 14 minutes (75 commuters, 21.3%), and 5 to 9 minutes (48 commuters, 13.6%).
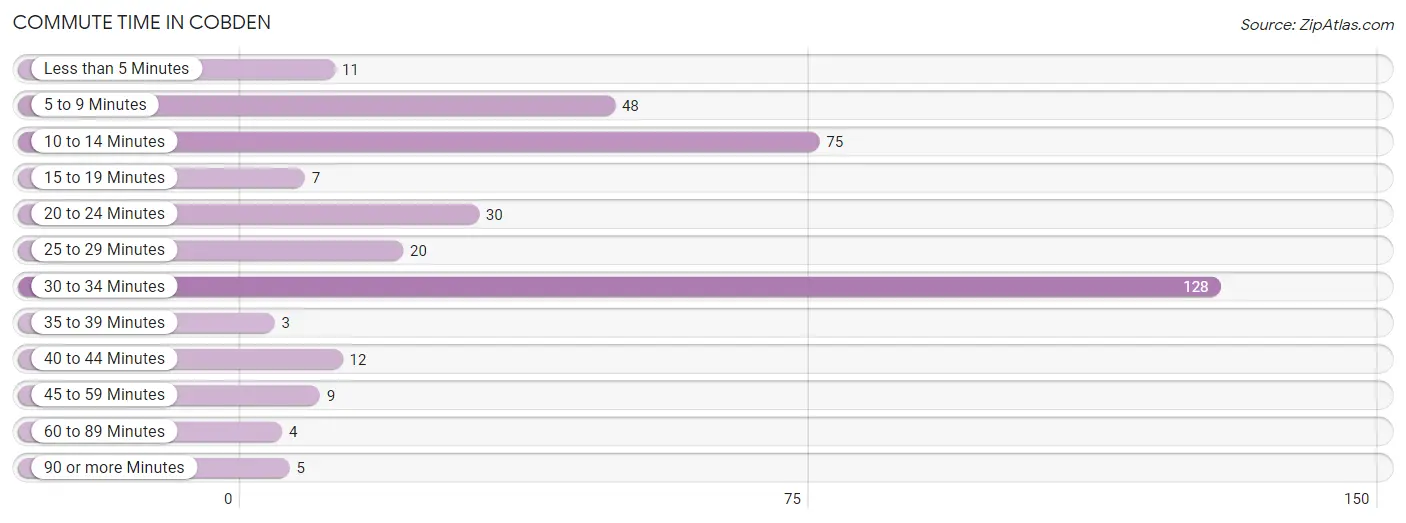
| Commute Time | # Commuters | % Commuters |
| Less than 5 Minutes | 11 | 3.1% |
| 5 to 9 Minutes | 48 | 13.6% |
| 10 to 14 Minutes | 75 | 21.3% |
| 15 to 19 Minutes | 7 | 2.0% |
| 20 to 24 Minutes | 30 | 8.5% |
| 25 to 29 Minutes | 20 | 5.7% |
| 30 to 34 Minutes | 128 | 36.4% |
| 35 to 39 Minutes | 3 | 0.9% |
| 40 to 44 Minutes | 12 | 3.4% |
| 45 to 59 Minutes | 9 | 2.6% |
| 60 to 89 Minutes | 4 | 1.1% |
| 90 or more Minutes | 5 | 1.4% |
Commute Time by Sex in Cobden
The most common commute times in Cobden are 30 to 34 minutes (65 commuters, 45.8%) for males and 30 to 34 minutes (63 commuters, 30.0%) for females.
| Commute Time | Male | Female |
| Less than 5 Minutes | 5 (3.5%) | 6 (2.9%) |
| 5 to 9 Minutes | 18 (12.7%) | 30 (14.3%) |
| 10 to 14 Minutes | 13 (9.1%) | 62 (29.5%) |
| 15 to 19 Minutes | 4 (2.8%) | 3 (1.4%) |
| 20 to 24 Minutes | 14 (9.9%) | 16 (7.6%) |
| 25 to 29 Minutes | 8 (5.6%) | 12 (5.7%) |
| 30 to 34 Minutes | 65 (45.8%) | 63 (30.0%) |
| 35 to 39 Minutes | 3 (2.1%) | 0 (0.0%) |
| 40 to 44 Minutes | 0 (0.0%) | 12 (5.7%) |
| 45 to 59 Minutes | 3 (2.1%) | 6 (2.9%) |
| 60 to 89 Minutes | 4 (2.8%) | 0 (0.0%) |
| 90 or more Minutes | 5 (3.5%) | 0 (0.0%) |
Time of Departure to Work by Sex in Cobden
The most frequent times of departure to work in Cobden are 7:30 AM to 7:59 AM (42, 29.6%) for males and 7:30 AM to 7:59 AM (41, 19.5%) for females.
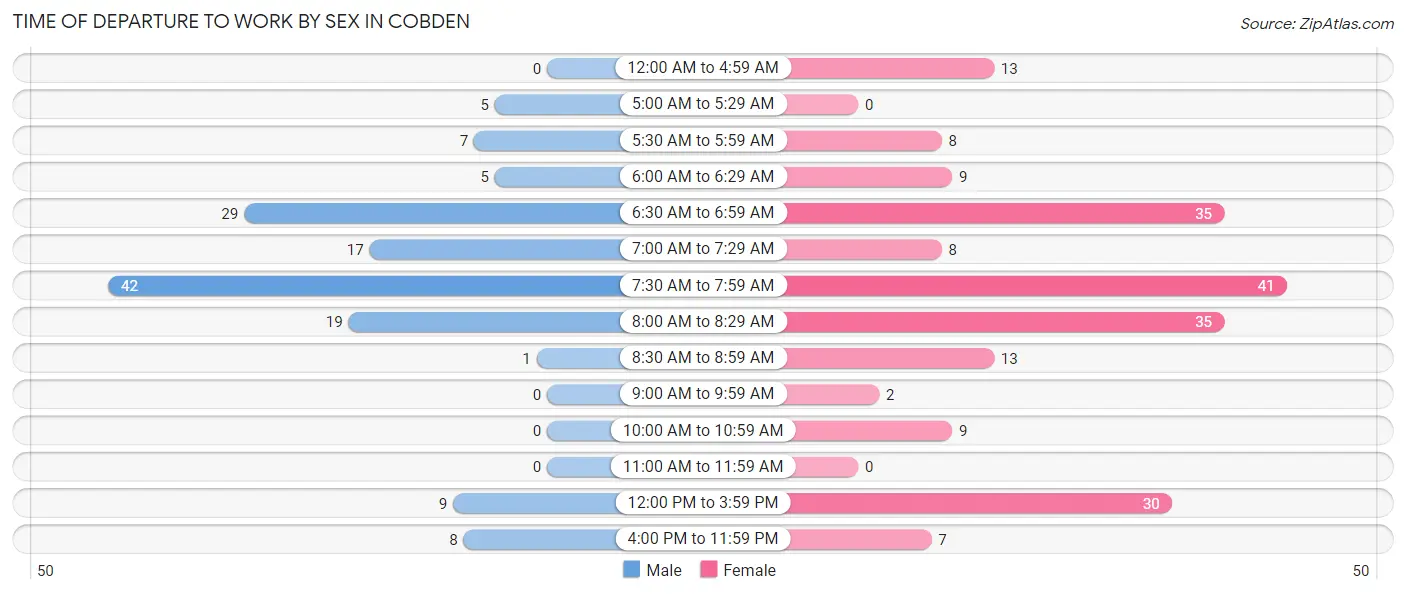
| Time of Departure | Male | Female |
| 12:00 AM to 4:59 AM | 0 (0.0%) | 13 (6.2%) |
| 5:00 AM to 5:29 AM | 5 (3.5%) | 0 (0.0%) |
| 5:30 AM to 5:59 AM | 7 (4.9%) | 8 (3.8%) |
| 6:00 AM to 6:29 AM | 5 (3.5%) | 9 (4.3%) |
| 6:30 AM to 6:59 AM | 29 (20.4%) | 35 (16.7%) |
| 7:00 AM to 7:29 AM | 17 (12.0%) | 8 (3.8%) |
| 7:30 AM to 7:59 AM | 42 (29.6%) | 41 (19.5%) |
| 8:00 AM to 8:29 AM | 19 (13.4%) | 35 (16.7%) |
| 8:30 AM to 8:59 AM | 1 (0.7%) | 13 (6.2%) |
| 9:00 AM to 9:59 AM | 0 (0.0%) | 2 (0.9%) |
| 10:00 AM to 10:59 AM | 0 (0.0%) | 9 (4.3%) |
| 11:00 AM to 11:59 AM | 0 (0.0%) | 0 (0.0%) |
| 12:00 PM to 3:59 PM | 9 (6.3%) | 30 (14.3%) |
| 4:00 PM to 11:59 PM | 8 (5.6%) | 7 (3.3%) |
| Total | 142 (100.0%) | 210 (100.0%) |
Housing Occupancy in Cobden
Occupancy by Ownership in Cobden
Of the total 384 dwellings in Cobden, owner-occupied units account for 288 (75.0%), while renter-occupied units make up 96 (25.0%).
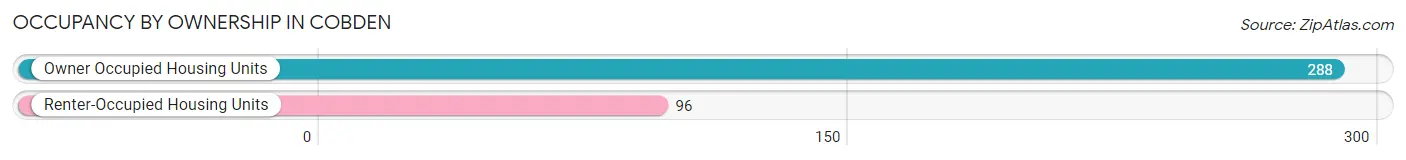
| Occupancy | # Housing Units | % Housing Units |
| Owner Occupied Housing Units | 288 | 75.0% |
| Renter-Occupied Housing Units | 96 | 25.0% |
| Total Occupied Housing Units | 384 | 100.0% |
Occupancy by Household Size in Cobden
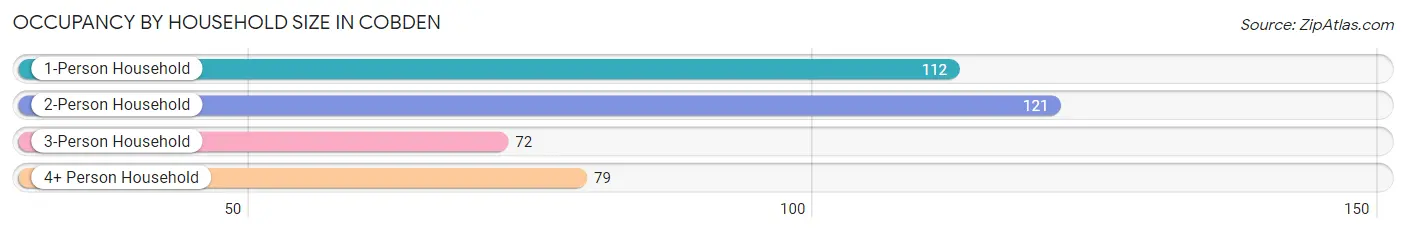
| Household Size | # Housing Units | % Housing Units |
| 1-Person Household | 112 | 29.2% |
| 2-Person Household | 121 | 31.5% |
| 3-Person Household | 72 | 18.8% |
| 4+ Person Household | 79 | 20.6% |
| Total Housing Units | 384 | 100.0% |
Occupancy by Ownership by Household Size in Cobden
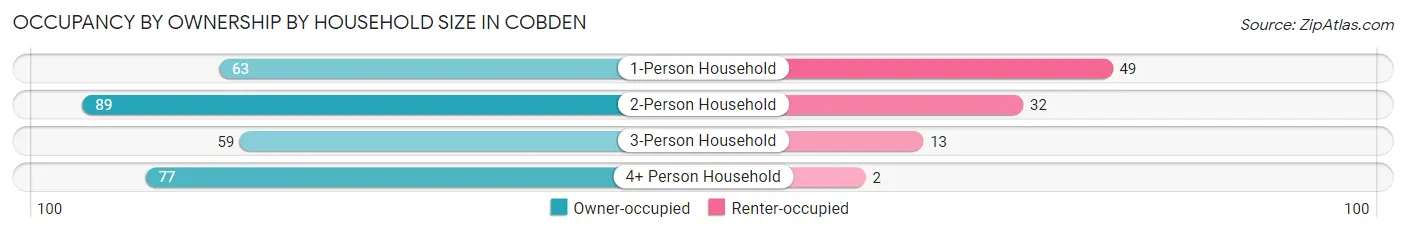
| Household Size | Owner-occupied | Renter-occupied |
| 1-Person Household | 63 (56.2%) | 49 (43.8%) |
| 2-Person Household | 89 (73.6%) | 32 (26.5%) |
| 3-Person Household | 59 (81.9%) | 13 (18.1%) |
| 4+ Person Household | 77 (97.5%) | 2 (2.5%) |
| Total Housing Units | 288 (75.0%) | 96 (25.0%) |
Occupancy by Educational Attainment in Cobden
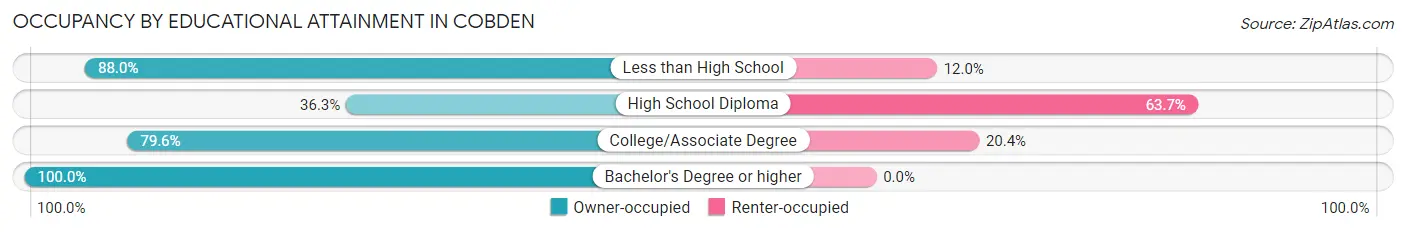
| Household Size | Owner-occupied | Renter-occupied |
| Less than High School | 44 (88.0%) | 6 (12.0%) |
| High School Diploma | 33 (36.3%) | 58 (63.7%) |
| College/Associate Degree | 125 (79.6%) | 32 (20.4%) |
| Bachelor's Degree or higher | 86 (100.0%) | 0 (0.0%) |
Occupancy by Age of Householder in Cobden
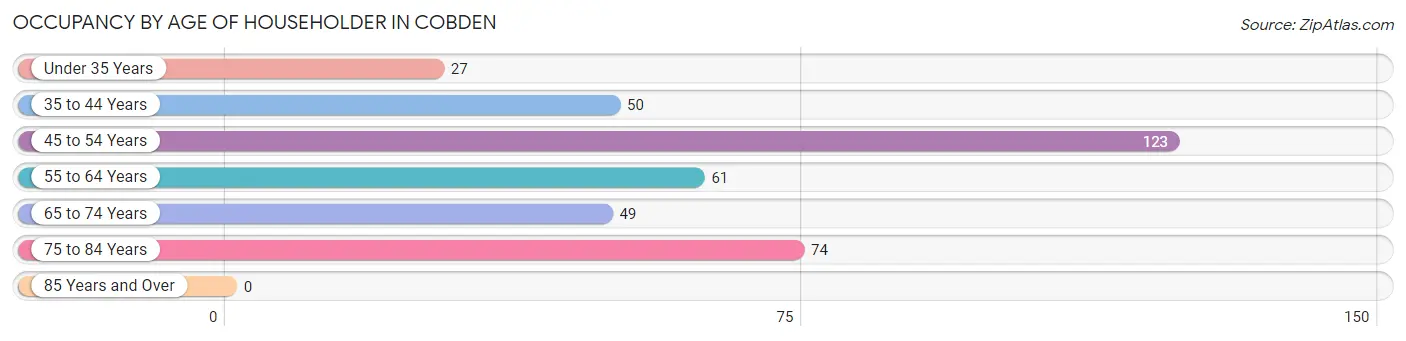
| Age Bracket | # Households | % Households |
| Under 35 Years | 27 | 7.0% |
| 35 to 44 Years | 50 | 13.0% |
| 45 to 54 Years | 123 | 32.0% |
| 55 to 64 Years | 61 | 15.9% |
| 65 to 74 Years | 49 | 12.8% |
| 75 to 84 Years | 74 | 19.3% |
| 85 Years and Over | 0 | 0.0% |
| Total | 384 | 100.0% |
Housing Finances in Cobden
Median Income by Occupancy in Cobden
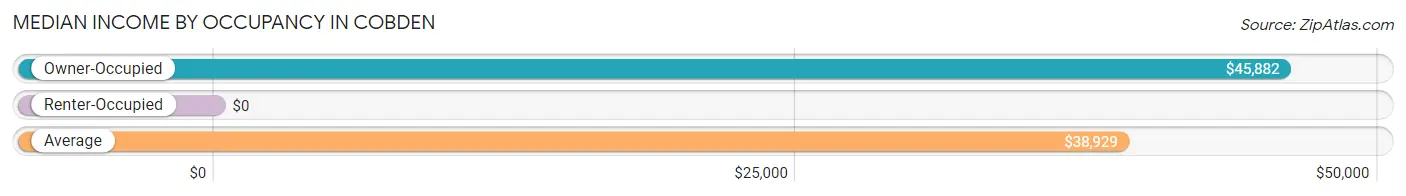
| Occupancy Type | # Households | Median Income |
| Owner-Occupied | 288 (75.0%) | $45,882 |
| Renter-Occupied | 96 (25.0%) | $0 |
| Average | 384 (100.0%) | $38,929 |
Occupancy by Householder Income Bracket in Cobden
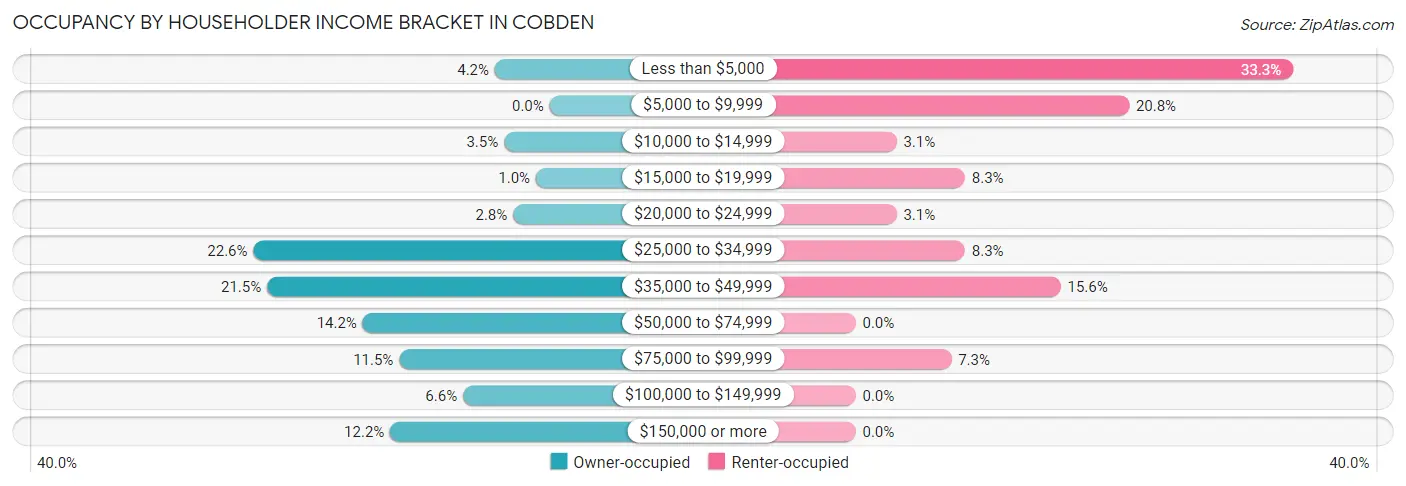
| Income Bracket | Owner-occupied | Renter-occupied |
| Less than $5,000 | 12 (4.2%) | 32 (33.3%) |
| $5,000 to $9,999 | 0 (0.0%) | 20 (20.8%) |
| $10,000 to $14,999 | 10 (3.5%) | 3 (3.1%) |
| $15,000 to $19,999 | 3 (1.0%) | 8 (8.3%) |
| $20,000 to $24,999 | 8 (2.8%) | 3 (3.1%) |
| $25,000 to $34,999 | 65 (22.6%) | 8 (8.3%) |
| $35,000 to $49,999 | 62 (21.5%) | 15 (15.6%) |
| $50,000 to $74,999 | 41 (14.2%) | 0 (0.0%) |
| $75,000 to $99,999 | 33 (11.5%) | 7 (7.3%) |
| $100,000 to $149,999 | 19 (6.6%) | 0 (0.0%) |
| $150,000 or more | 35 (12.1%) | 0 (0.0%) |
| Total | 288 (100.0%) | 96 (100.0%) |
Monthly Housing Cost Tiers in Cobden
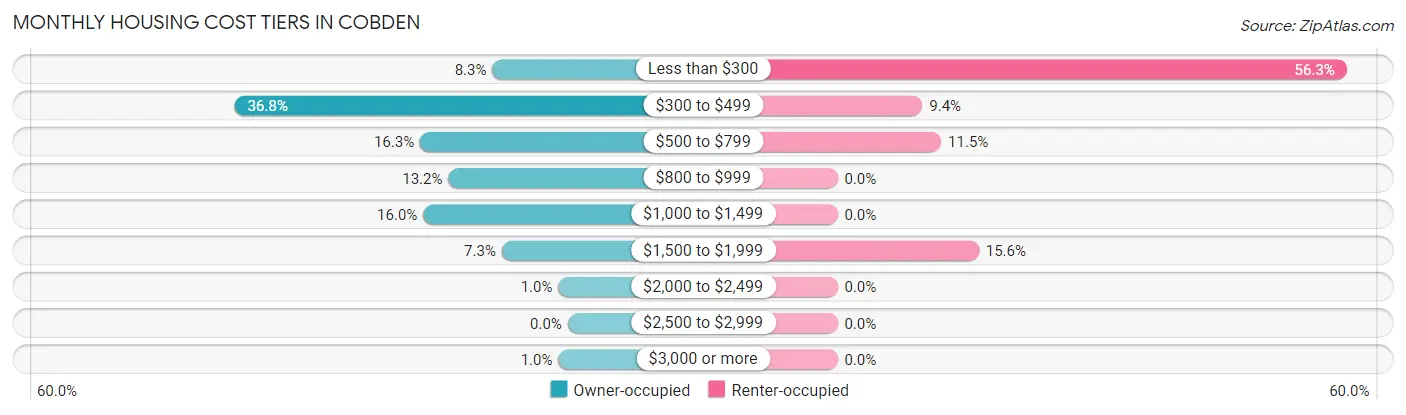
| Monthly Cost | Owner-occupied | Renter-occupied |
| Less than $300 | 24 (8.3%) | 54 (56.2%) |
| $300 to $499 | 106 (36.8%) | 9 (9.4%) |
| $500 to $799 | 47 (16.3%) | 11 (11.5%) |
| $800 to $999 | 38 (13.2%) | 0 (0.0%) |
| $1,000 to $1,499 | 46 (16.0%) | 0 (0.0%) |
| $1,500 to $1,999 | 21 (7.3%) | 15 (15.6%) |
| $2,000 to $2,499 | 3 (1.0%) | 0 (0.0%) |
| $2,500 to $2,999 | 0 (0.0%) | 0 (0.0%) |
| $3,000 or more | 3 (1.0%) | 0 (0.0%) |
| Total | 288 (100.0%) | 96 (100.0%) |
Physical Housing Characteristics in Cobden
Housing Structures in Cobden
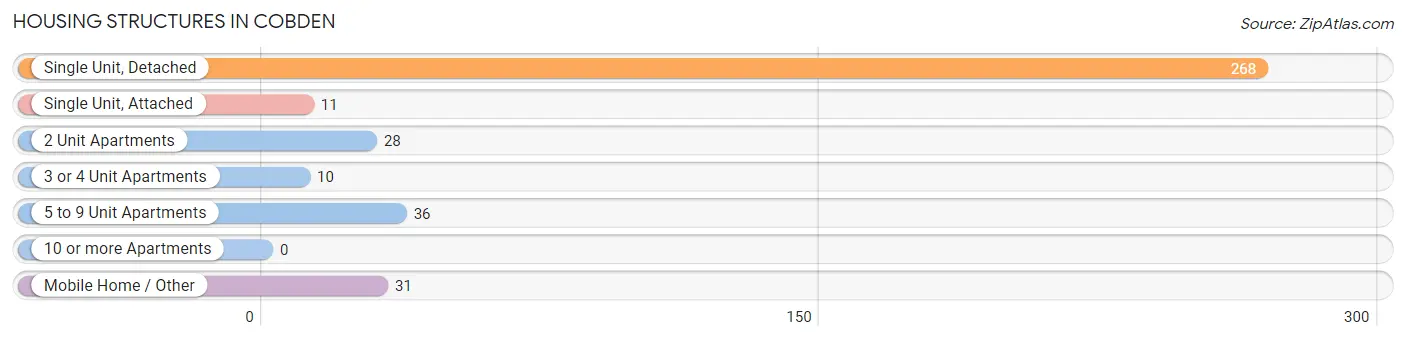
| Structure Type | # Housing Units | % Housing Units |
| Single Unit, Detached | 268 | 69.8% |
| Single Unit, Attached | 11 | 2.9% |
| 2 Unit Apartments | 28 | 7.3% |
| 3 or 4 Unit Apartments | 10 | 2.6% |
| 5 to 9 Unit Apartments | 36 | 9.4% |
| 10 or more Apartments | 0 | 0.0% |
| Mobile Home / Other | 31 | 8.1% |
| Total | 384 | 100.0% |
Housing Structures by Occupancy in Cobden
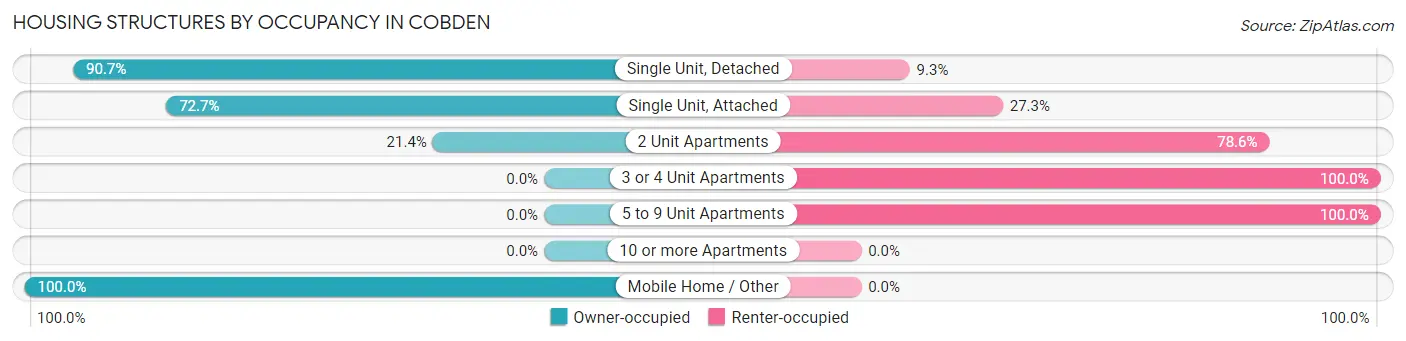
| Structure Type | Owner-occupied | Renter-occupied |
| Single Unit, Detached | 243 (90.7%) | 25 (9.3%) |
| Single Unit, Attached | 8 (72.7%) | 3 (27.3%) |
| 2 Unit Apartments | 6 (21.4%) | 22 (78.6%) |
| 3 or 4 Unit Apartments | 0 (0.0%) | 10 (100.0%) |
| 5 to 9 Unit Apartments | 0 (0.0%) | 36 (100.0%) |
| 10 or more Apartments | 0 (0.0%) | 0 (0.0%) |
| Mobile Home / Other | 31 (100.0%) | 0 (0.0%) |
| Total | 288 (75.0%) | 96 (25.0%) |
Housing Structures by Number of Rooms in Cobden
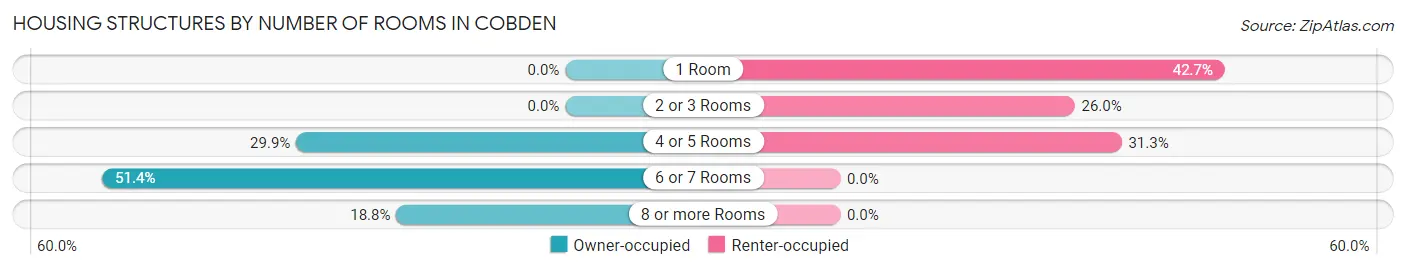
| Number of Rooms | Owner-occupied | Renter-occupied |
| 1 Room | 0 (0.0%) | 41 (42.7%) |
| 2 or 3 Rooms | 0 (0.0%) | 25 (26.0%) |
| 4 or 5 Rooms | 86 (29.9%) | 30 (31.2%) |
| 6 or 7 Rooms | 148 (51.4%) | 0 (0.0%) |
| 8 or more Rooms | 54 (18.8%) | 0 (0.0%) |
| Total | 288 (100.0%) | 96 (100.0%) |
Housing Structure by Heating Type in Cobden
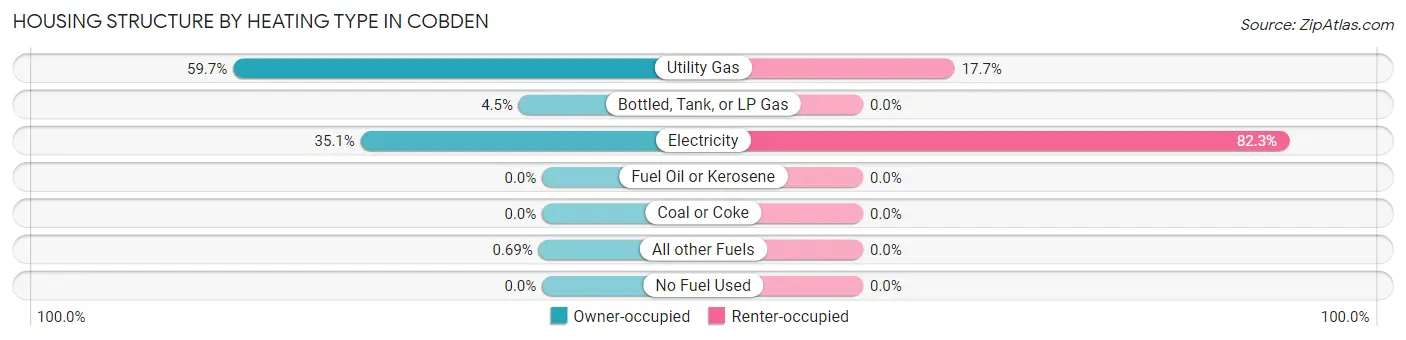
| Heating Type | Owner-occupied | Renter-occupied |
| Utility Gas | 172 (59.7%) | 17 (17.7%) |
| Bottled, Tank, or LP Gas | 13 (4.5%) | 0 (0.0%) |
| Electricity | 101 (35.1%) | 79 (82.3%) |
| Fuel Oil or Kerosene | 0 (0.0%) | 0 (0.0%) |
| Coal or Coke | 0 (0.0%) | 0 (0.0%) |
| All other Fuels | 2 (0.7%) | 0 (0.0%) |
| No Fuel Used | 0 (0.0%) | 0 (0.0%) |
| Total | 288 (100.0%) | 96 (100.0%) |
Household Vehicle Usage in Cobden
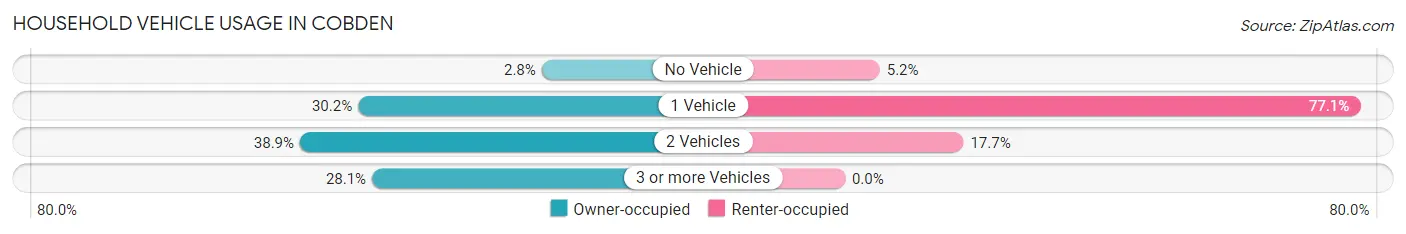
| Vehicles per Household | Owner-occupied | Renter-occupied |
| No Vehicle | 8 (2.8%) | 5 (5.2%) |
| 1 Vehicle | 87 (30.2%) | 74 (77.1%) |
| 2 Vehicles | 112 (38.9%) | 17 (17.7%) |
| 3 or more Vehicles | 81 (28.1%) | 0 (0.0%) |
| Total | 288 (100.0%) | 96 (100.0%) |
Real Estate & Mortgages in Cobden
Real Estate and Mortgage Overview in Cobden
| Characteristic | Without Mortgage | With Mortgage |
| Housing Units | 167 | 121 |
| Median Property Value | $89,800 | $117,600 |
| Median Household Income | $46,838 | $4 |
| Monthly Housing Costs | $432 | $3 |
| Real Estate Taxes | $818 | $7 |
Property Value by Mortgage Status in Cobden
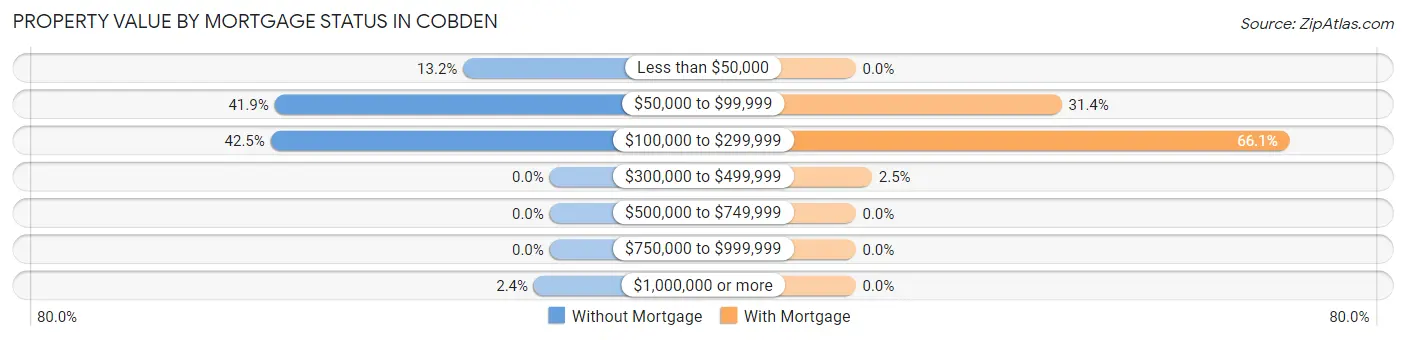
| Property Value | Without Mortgage | With Mortgage |
| Less than $50,000 | 22 (13.2%) | 0 (0.0%) |
| $50,000 to $99,999 | 70 (41.9%) | 38 (31.4%) |
| $100,000 to $299,999 | 71 (42.5%) | 80 (66.1%) |
| $300,000 to $499,999 | 0 (0.0%) | 3 (2.5%) |
| $500,000 to $749,999 | 0 (0.0%) | 0 (0.0%) |
| $750,000 to $999,999 | 0 (0.0%) | 0 (0.0%) |
| $1,000,000 or more | 4 (2.4%) | 0 (0.0%) |
| Total | 167 (100.0%) | 121 (100.0%) |
Household Income by Mortgage Status in Cobden
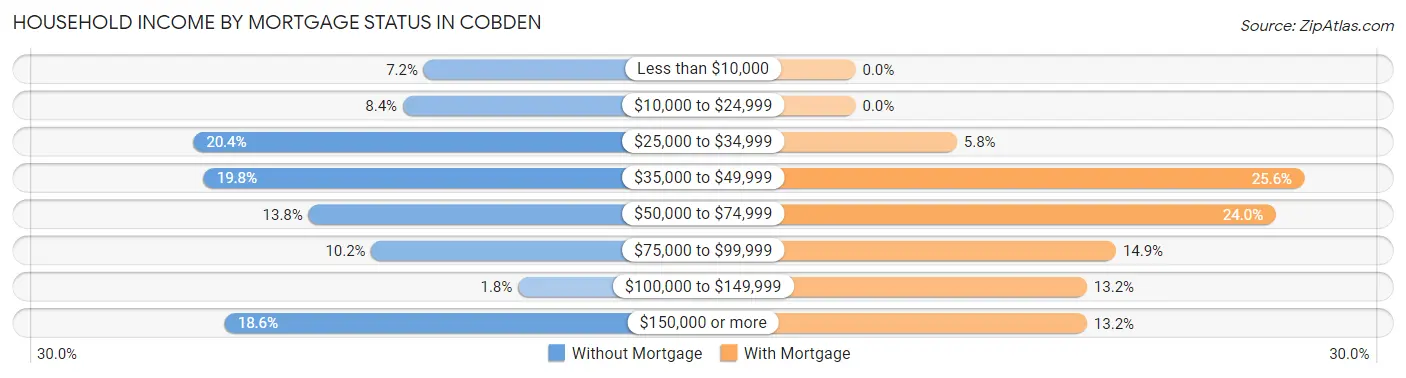
| Household Income | Without Mortgage | With Mortgage |
| Less than $10,000 | 12 (7.2%) | 0 (0.0%) |
| $10,000 to $24,999 | 14 (8.4%) | 0 (0.0%) |
| $25,000 to $34,999 | 34 (20.4%) | 7 (5.8%) |
| $35,000 to $49,999 | 33 (19.8%) | 31 (25.6%) |
| $50,000 to $74,999 | 23 (13.8%) | 29 (24.0%) |
| $75,000 to $99,999 | 17 (10.2%) | 18 (14.9%) |
| $100,000 to $149,999 | 3 (1.8%) | 16 (13.2%) |
| $150,000 or more | 31 (18.6%) | 16 (13.2%) |
| Total | 167 (100.0%) | 121 (100.0%) |
Property Value to Household Income Ratio in Cobden
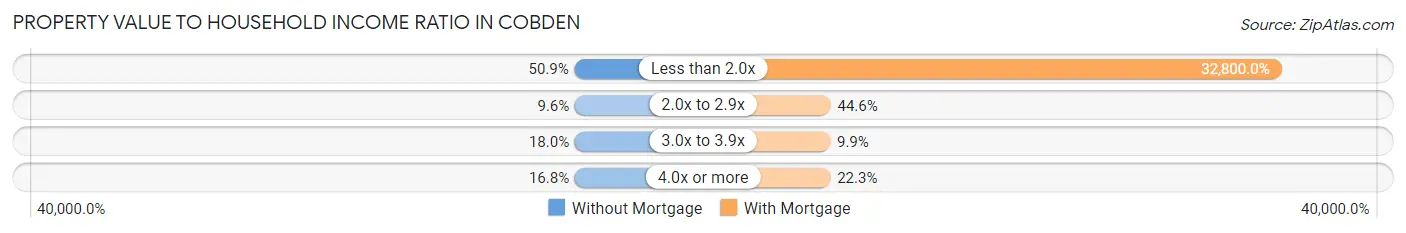
| Value-to-Income Ratio | Without Mortgage | With Mortgage |
| Less than 2.0x | 85 (50.9%) | 39,688 (32,800.0%) |
| 2.0x to 2.9x | 16 (9.6%) | 54 (44.6%) |
| 3.0x to 3.9x | 30 (18.0%) | 12 (9.9%) |
| 4.0x or more | 28 (16.8%) | 27 (22.3%) |
| Total | 167 (100.0%) | 121 (100.0%) |
Real Estate Taxes by Mortgage Status in Cobden
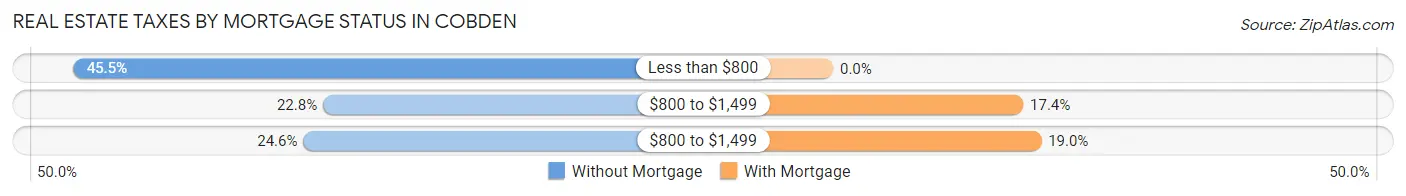
| Property Taxes | Without Mortgage | With Mortgage |
| Less than $800 | 76 (45.5%) | 0 (0.0%) |
| $800 to $1,499 | 38 (22.8%) | 21 (17.4%) |
| $800 to $1,499 | 41 (24.5%) | 23 (19.0%) |
| Total | 167 (100.0%) | 121 (100.0%) |
Health & Disability in Cobden
Health Insurance Coverage by Age in Cobden
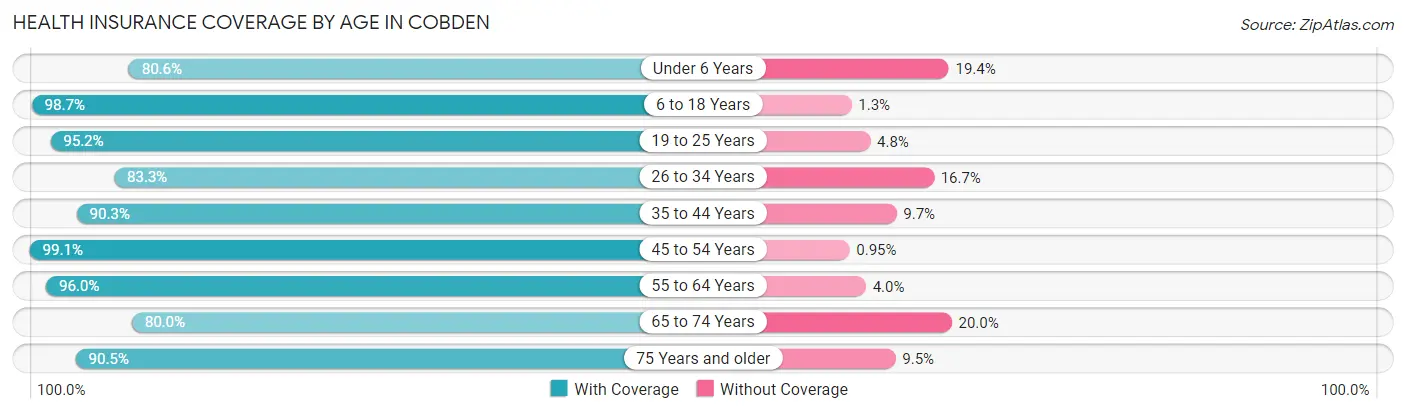
| Age Bracket | With Coverage | Without Coverage |
| Under 6 Years | 29 (80.6%) | 7 (19.4%) |
| 6 to 18 Years | 150 (98.7%) | 2 (1.3%) |
| 19 to 25 Years | 99 (95.2%) | 5 (4.8%) |
| 26 to 34 Years | 20 (83.3%) | 4 (16.7%) |
| 35 to 44 Years | 158 (90.3%) | 17 (9.7%) |
| 45 to 54 Years | 209 (99.1%) | 2 (0.9%) |
| 55 to 64 Years | 96 (96.0%) | 4 (4.0%) |
| 65 to 74 Years | 100 (80.0%) | 25 (20.0%) |
| 75 Years and older | 76 (90.5%) | 8 (9.5%) |
| Total | 937 (92.7%) | 74 (7.3%) |
Health Insurance Coverage by Citizenship Status in Cobden
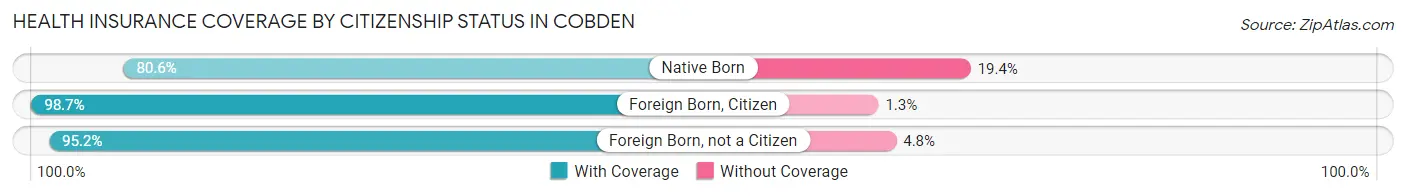
| Citizenship Status | With Coverage | Without Coverage |
| Native Born | 29 (80.6%) | 7 (19.4%) |
| Foreign Born, Citizen | 150 (98.7%) | 2 (1.3%) |
| Foreign Born, not a Citizen | 99 (95.2%) | 5 (4.8%) |
Health Insurance Coverage by Household Income in Cobden
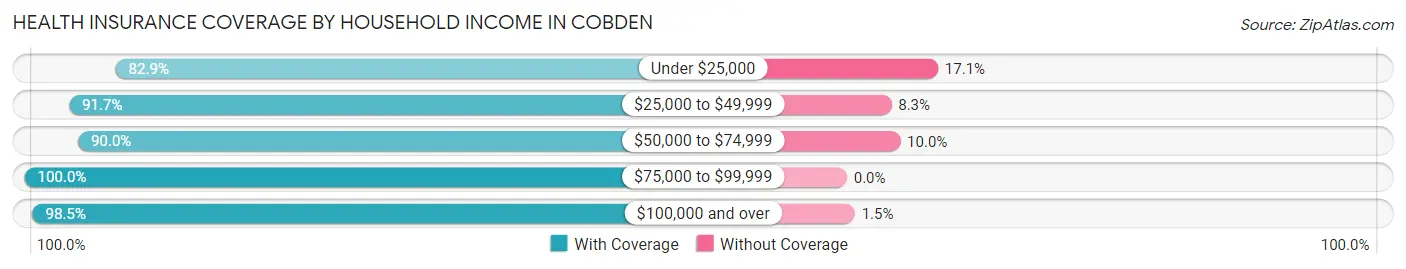
| Household Income | With Coverage | Without Coverage |
| Under $25,000 | 136 (82.9%) | 28 (17.1%) |
| $25,000 to $49,999 | 352 (91.7%) | 32 (8.3%) |
| $50,000 to $74,999 | 99 (90.0%) | 11 (10.0%) |
| $75,000 to $99,999 | 122 (100.0%) | 0 (0.0%) |
| $100,000 and over | 199 (98.5%) | 3 (1.5%) |
Public vs Private Health Insurance Coverage by Age in Cobden
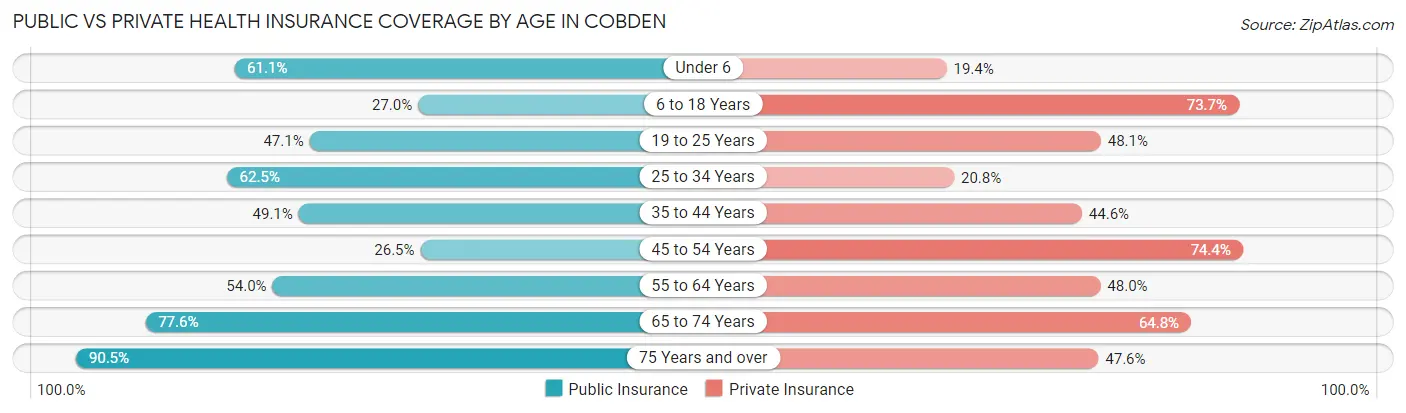
| Age Bracket | Public Insurance | Private Insurance |
| Under 6 | 22 (61.1%) | 7 (19.4%) |
| 6 to 18 Years | 41 (27.0%) | 112 (73.7%) |
| 19 to 25 Years | 49 (47.1%) | 50 (48.1%) |
| 25 to 34 Years | 15 (62.5%) | 5 (20.8%) |
| 35 to 44 Years | 86 (49.1%) | 78 (44.6%) |
| 45 to 54 Years | 56 (26.5%) | 157 (74.4%) |
| 55 to 64 Years | 54 (54.0%) | 48 (48.0%) |
| 65 to 74 Years | 97 (77.6%) | 81 (64.8%) |
| 75 Years and over | 76 (90.5%) | 40 (47.6%) |
| Total | 496 (49.1%) | 578 (57.2%) |
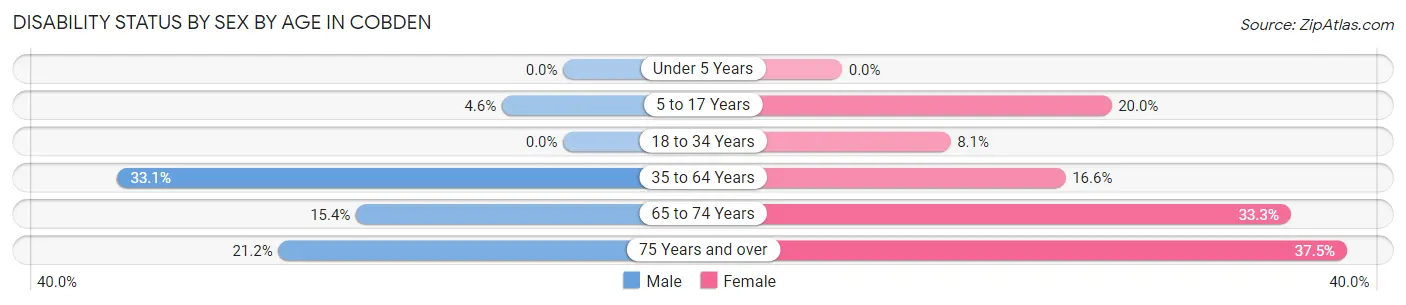
Disability Status by Sex by Age in Cobden
| Age Bracket | Male | Female |
| Under 5 Years | 0 (0.0%) | 0 (0.0%) |
| 5 to 17 Years | 3 (4.5%) | 14 (20.0%) |
| 18 to 34 Years | 0 (0.0%) | 7 (8.1%) |
| 35 to 64 Years | 93 (33.1%) | 34 (16.6%) |
| 65 to 74 Years | 10 (15.4%) | 20 (33.3%) |
| 75 Years and over | 11 (21.1%) | 12 (37.5%) |
Disability Class by Sex by Age in Cobden
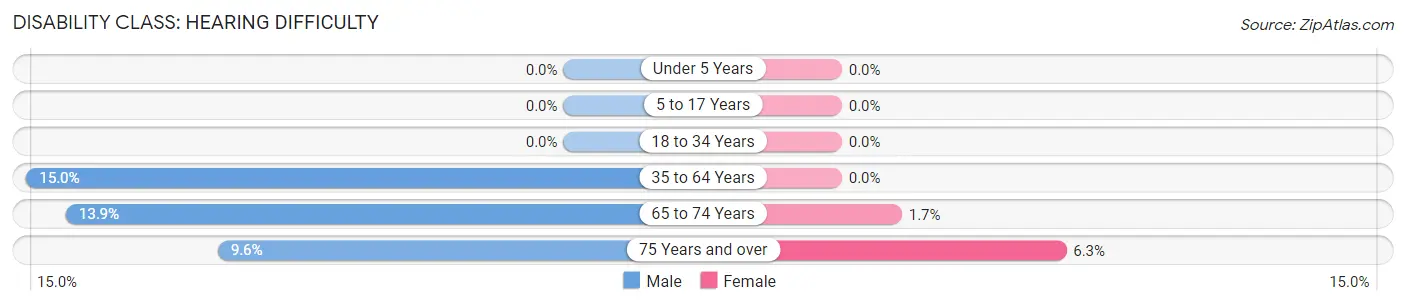
Disability Class: Hearing Difficulty
| Age Bracket | Male | Female |
| Under 5 Years | 0 (0.0%) | 0 (0.0%) |
| 5 to 17 Years | 0 (0.0%) | 0 (0.0%) |
| 18 to 34 Years | 0 (0.0%) | 0 (0.0%) |
| 35 to 64 Years | 42 (14.9%) | 0 (0.0%) |
| 65 to 74 Years | 9 (13.9%) | 1 (1.7%) |
| 75 Years and over | 5 (9.6%) | 2 (6.2%) |
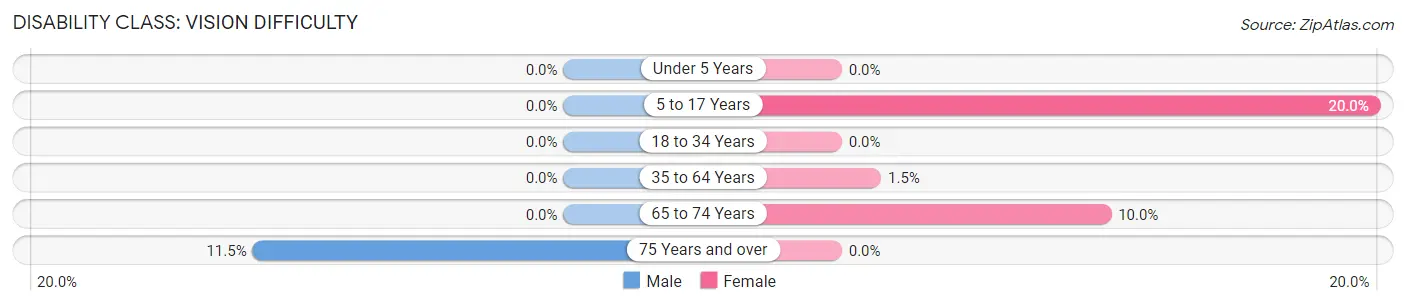
Disability Class: Vision Difficulty
| Age Bracket | Male | Female |
| Under 5 Years | 0 (0.0%) | 0 (0.0%) |
| 5 to 17 Years | 0 (0.0%) | 14 (20.0%) |
| 18 to 34 Years | 0 (0.0%) | 0 (0.0%) |
| 35 to 64 Years | 0 (0.0%) | 3 (1.5%) |
| 65 to 74 Years | 0 (0.0%) | 6 (10.0%) |
| 75 Years and over | 6 (11.5%) | 0 (0.0%) |
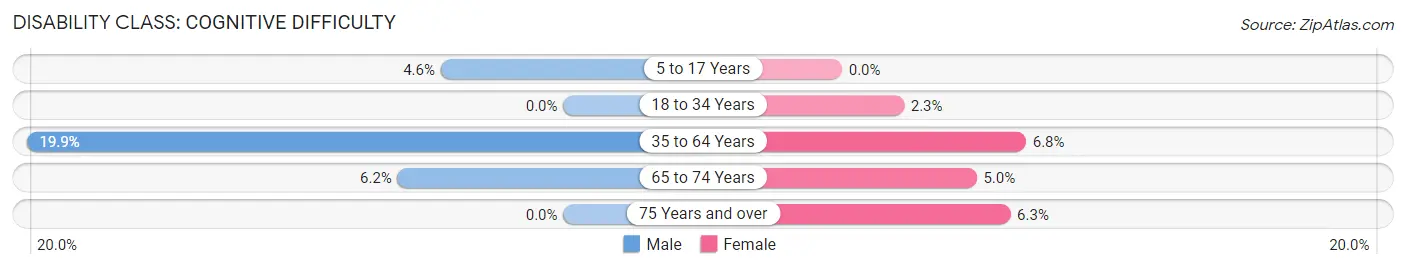
Disability Class: Cognitive Difficulty
| Age Bracket | Male | Female |
| 5 to 17 Years | 3 (4.5%) | 0 (0.0%) |
| 18 to 34 Years | 0 (0.0%) | 2 (2.3%) |
| 35 to 64 Years | 56 (19.9%) | 14 (6.8%) |
| 65 to 74 Years | 4 (6.1%) | 3 (5.0%) |
| 75 Years and over | 0 (0.0%) | 2 (6.2%) |
Disability Class: Ambulatory Difficulty
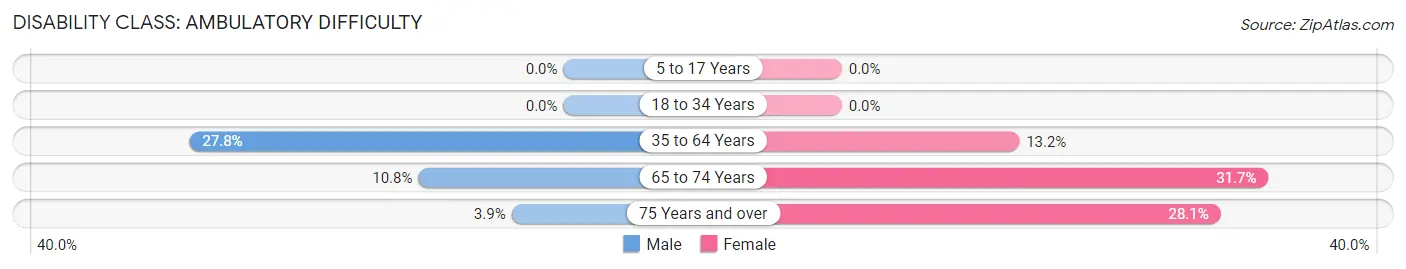
| Age Bracket | Male | Female |
| 5 to 17 Years | 0 (0.0%) | 0 (0.0%) |
| 18 to 34 Years | 0 (0.0%) | 0 (0.0%) |
| 35 to 64 Years | 78 (27.8%) | 27 (13.2%) |
| 65 to 74 Years | 7 (10.8%) | 19 (31.7%) |
| 75 Years and over | 2 (3.8%) | 9 (28.1%) |
Disability Class: Self-Care Difficulty
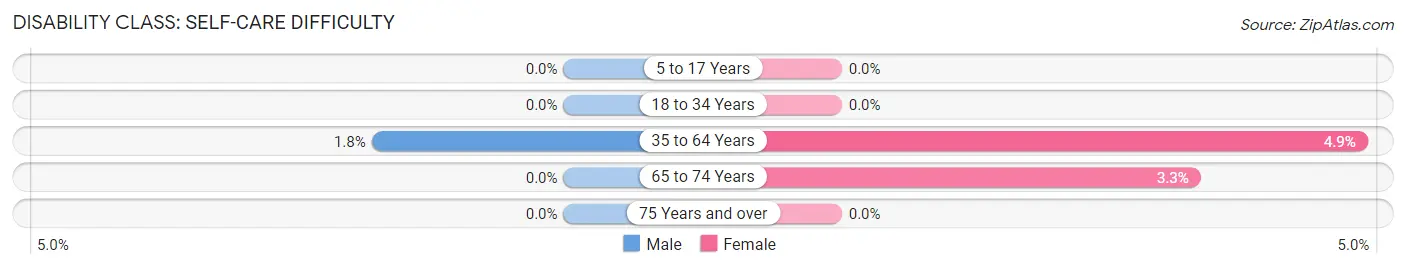
| Age Bracket | Male | Female |
| 5 to 17 Years | 0 (0.0%) | 0 (0.0%) |
| 18 to 34 Years | 0 (0.0%) | 0 (0.0%) |
| 35 to 64 Years | 5 (1.8%) | 10 (4.9%) |
| 65 to 74 Years | 0 (0.0%) | 2 (3.3%) |
| 75 Years and over | 0 (0.0%) | 0 (0.0%) |
Technology Access in Cobden
Computing Device Access in Cobden
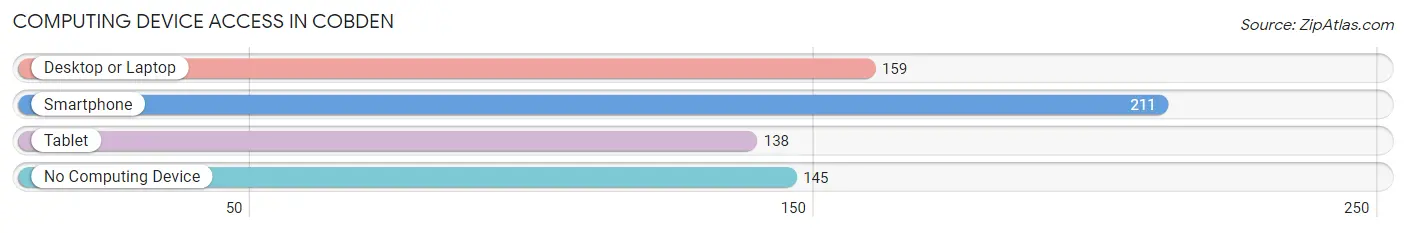
| Device Type | # Households | % Households |
| Desktop or Laptop | 159 | 41.4% |
| Smartphone | 211 | 54.9% |
| Tablet | 138 | 35.9% |
| No Computing Device | 145 | 37.8% |
| Total | 384 | 100.0% |
Internet Access in Cobden
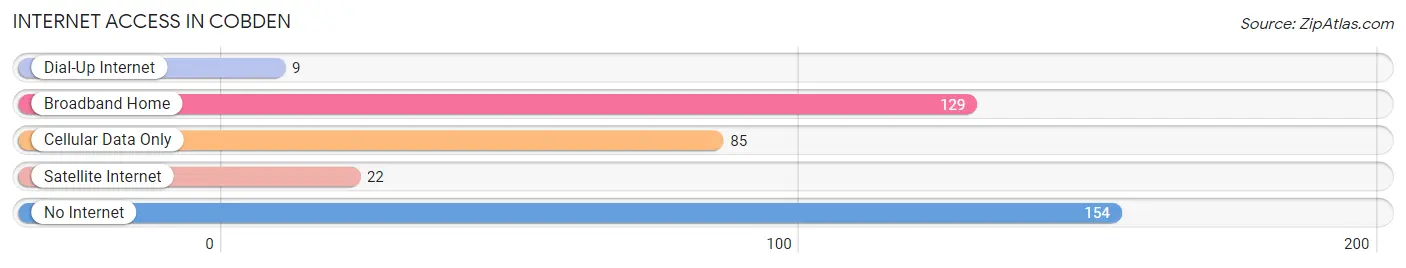
| Internet Type | # Households | % Households |
| Dial-Up Internet | 9 | 2.3% |
| Broadband Home | 129 | 33.6% |
| Cellular Data Only | 85 | 22.1% |
| Satellite Internet | 22 | 5.7% |
| No Internet | 154 | 40.1% |
| Total | 384 | 100.0% |
Cobden Summary
Cobden is a small village located in Union County, Illinois, United States. It is situated in the southern part of the state, approximately 20 miles east of Carbondale. The population of Cobden was 1,717 at the 2010 census.
History
Cobden was founded in 1854 by a group of settlers from England. The town was named after Richard Cobden, a British politician and advocate of free trade. The first post office was established in 1855.
In 1858, the Illinois Central Railroad was built through the town, connecting it to the rest of the state. This allowed Cobden to become an important trading center for the surrounding area.
In the late 19th century, Cobden was a thriving agricultural community. The town was home to several businesses, including a flour mill, a sawmill, a brickyard, and a canning factory.
Geography
Cobden is located at 37°51'N 89°17'W (37.851, -89.17). It is situated in the Shawnee Hills region of southern Illinois. The town is surrounded by rolling hills and woodlands.
The climate in Cobden is humid subtropical, with hot, humid summers and mild winters. The average annual temperature is 57°F (14°C).
Economy
The economy of Cobden is largely based on agriculture. The town is home to several farms, which produce corn, soybeans, wheat, and other crops.
Cobden is also home to several small businesses, including a grocery store, a hardware store, and a restaurant. The town is served by the Union County Airport, which offers flights to nearby cities.
Demographics
As of the 2010 census, the population of Cobden was 1,717. The racial makeup of the town was 97.2% White, 0.7% African American, 0.3% Native American, 0.2% Asian, 0.1% Pacific Islander, 0.5% from other races, and 0.9% from two or more races. Hispanic or Latino of any race were 1.3% of the population.
The median household income in Cobden was $37,917, and the median family income was $45,938. The per capita income was $19,945. About 11.2% of families and 14.2% of the population were below the poverty line, including 19.2% of those under age 18 and 8.2% of those age 65 or over.
Common Questions
What is Per Capita Income in Cobden?
Per Capita income in Cobden is $22,409.
What is the Median Family Income in Cobden?
Median Family Income in Cobden is $49,327.
What is the Median Household income in Cobden?
Median Household Income in Cobden is $38,929.
What is Income or Wage Gap in Cobden?
Income or Wage Gap in Cobden is 15.8%.
Women in Cobden earn 84.2 cents for every dollar earned by a man.
What is Inequality or Gini Index in Cobden?
Inequality or Gini Index in Cobden is 0.48.
What is the Total Population of Cobden?
Total Population of Cobden is 1,023.
What is the Total Male Population of Cobden?
Total Male Population of Cobden is 542.
What is the Total Female Population of Cobden?
Total Female Population of Cobden is 481.
What is the Ratio of Males per 100 Females in Cobden?
There are 112.68 Males per 100 Females in Cobden.
What is the Ratio of Females per 100 Males in Cobden?
There are 88.75 Females per 100 Males in Cobden.
What is the Median Population Age in Cobden?
Median Population Age in Cobden is 46.8 Years.
What is the Average Family Size in Cobden
Average Family Size in Cobden is 3.1 People.
What is the Average Household Size in Cobden
Average Household Size in Cobden is 2.6 People.
How Large is the Labor Force in Cobden?
There are 391 People in the Labor Forcein in Cobden.
What is the Percentage of People in the Labor Force in Cobden?
44.4% of People are in the Labor Force in Cobden.
What is the Unemployment Rate in Cobden?
Unemployment Rate in Cobden is 6.1%.