Fairmont, IL Map & Demographics
Fairmont Map
Fairmont Overview
$19,044
PER CAPITA INCOME
$64,792
AVG FAMILY INCOME
$61,103
AVG HOUSEHOLD INCOME
18.5%
WAGE / INCOME GAP [ % ]
81.5¢/ $1
WAGE / INCOME GAP [ $ ]
0.30
INEQUALITY / GINI INDEX
2,595
TOTAL POPULATION
1,101
MALE POPULATION
1,494
FEMALE POPULATION
73.69
MALES / 100 FEMALES
135.69
FEMALES / 100 MALES
30.5
MEDIAN AGE
4.2
AVG FAMILY SIZE
3.4
AVG HOUSEHOLD SIZE
1,185
LABOR FORCE [ PEOPLE ]
66.1%
PERCENT IN LABOR FORCE
9.6%
UNEMPLOYMENT RATE
Income in Fairmont
Income Overview in Fairmont
Per Capita Income in Fairmont is $19,044, while median incomes of families and households are $64,792 and $61,103 respectively.
| Characteristic | Number | Measure |
| Per Capita Income | 2,595 | $19,044 |
| Median Family Income | 538 | $64,792 |
| Mean Family Income | 538 | $66,480 |
| Median Household Income | 767 | $61,103 |
| Mean Household Income | 767 | $61,311 |
| Income Deficit | 538 | $0 |
| Wage / Income Gap (%) | 2,595 | 18.48% |
| Wage / Income Gap ($) | 2,595 | 81.52¢ per $1 |
| Gini / Inequality Index | 2,595 | 0.30 |
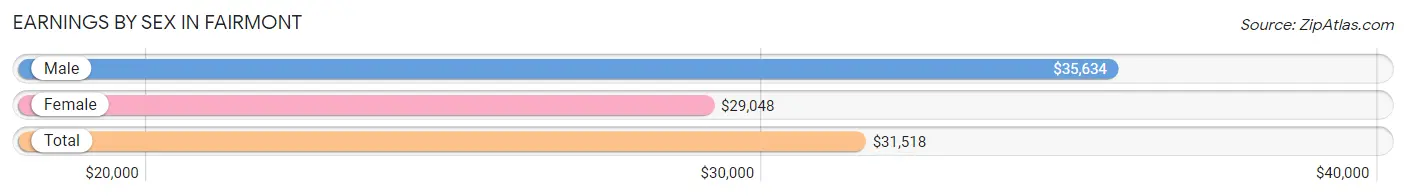
Earnings by Sex in Fairmont
Average Earnings in Fairmont are $31,518, $35,634 for men and $29,048 for women, a difference of 18.5%.
| Sex | Number | Average Earnings |
| Male | 557 (49.3%) | $35,634 |
| Female | 572 (50.7%) | $29,048 |
| Total | 1,129 (100.0%) | $31,518 |
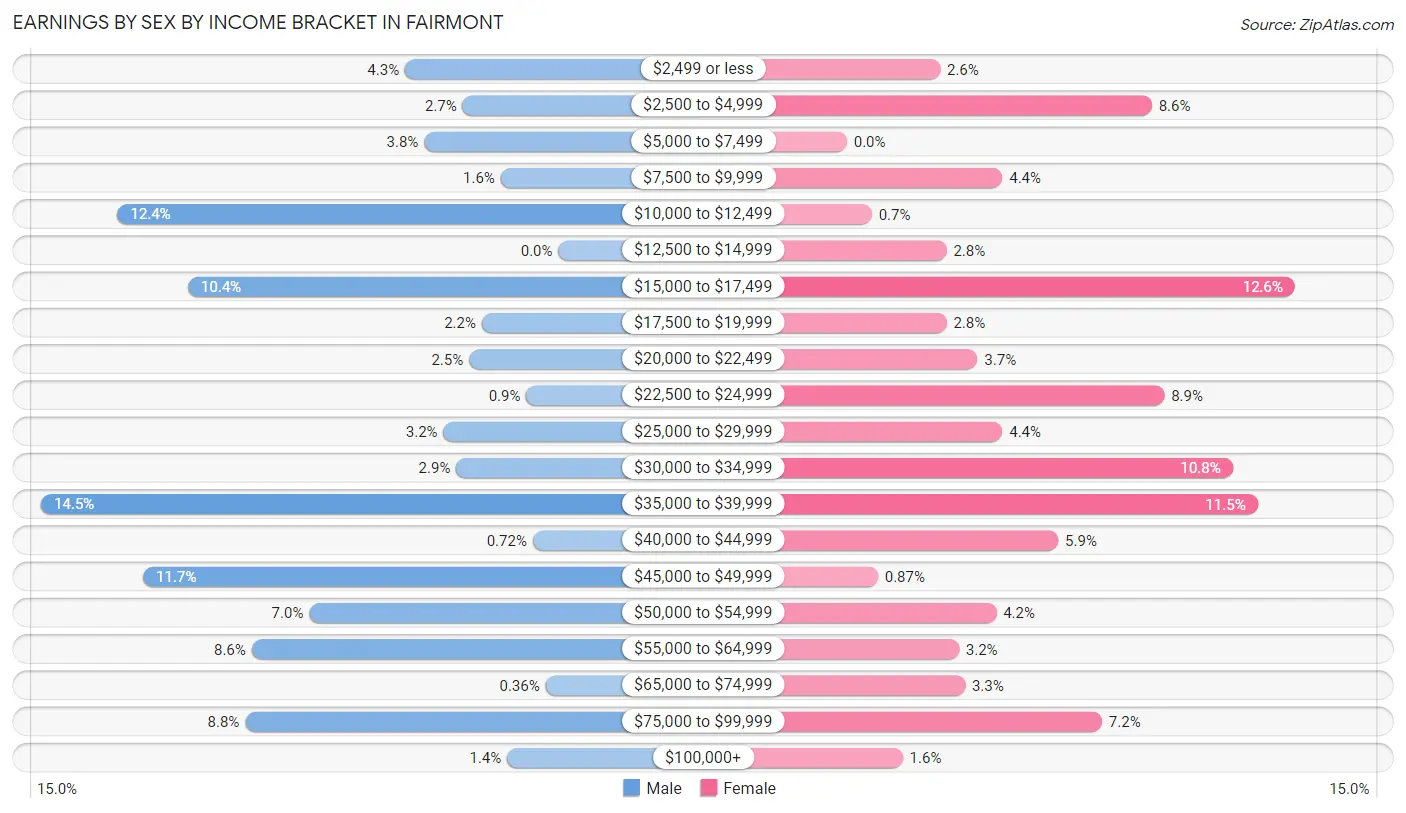
Earnings by Sex by Income Bracket in Fairmont
The most common earnings brackets in Fairmont are $35,000 to $39,999 for men (81 | 14.5%) and $15,000 to $17,499 for women (72 | 12.6%).
| Income | Male | Female |
| $2,499 or less | 24 (4.3%) | 15 (2.6%) |
| $2,500 to $4,999 | 15 (2.7%) | 49 (8.6%) |
| $5,000 to $7,499 | 21 (3.8%) | 0 (0.0%) |
| $7,500 to $9,999 | 9 (1.6%) | 25 (4.4%) |
| $10,000 to $12,499 | 69 (12.4%) | 4 (0.7%) |
| $12,500 to $14,999 | 0 (0.0%) | 16 (2.8%) |
| $15,000 to $17,499 | 58 (10.4%) | 72 (12.6%) |
| $17,500 to $19,999 | 12 (2.1%) | 16 (2.8%) |
| $20,000 to $22,499 | 14 (2.5%) | 21 (3.7%) |
| $22,500 to $24,999 | 5 (0.9%) | 51 (8.9%) |
| $25,000 to $29,999 | 18 (3.2%) | 25 (4.4%) |
| $30,000 to $34,999 | 16 (2.9%) | 62 (10.8%) |
| $35,000 to $39,999 | 81 (14.5%) | 66 (11.5%) |
| $40,000 to $44,999 | 4 (0.7%) | 34 (5.9%) |
| $45,000 to $49,999 | 65 (11.7%) | 5 (0.9%) |
| $50,000 to $54,999 | 39 (7.0%) | 24 (4.2%) |
| $55,000 to $64,999 | 48 (8.6%) | 18 (3.2%) |
| $65,000 to $74,999 | 2 (0.4%) | 19 (3.3%) |
| $75,000 to $99,999 | 49 (8.8%) | 41 (7.2%) |
| $100,000+ | 8 (1.4%) | 9 (1.6%) |
| Total | 557 (100.0%) | 572 (100.0%) |
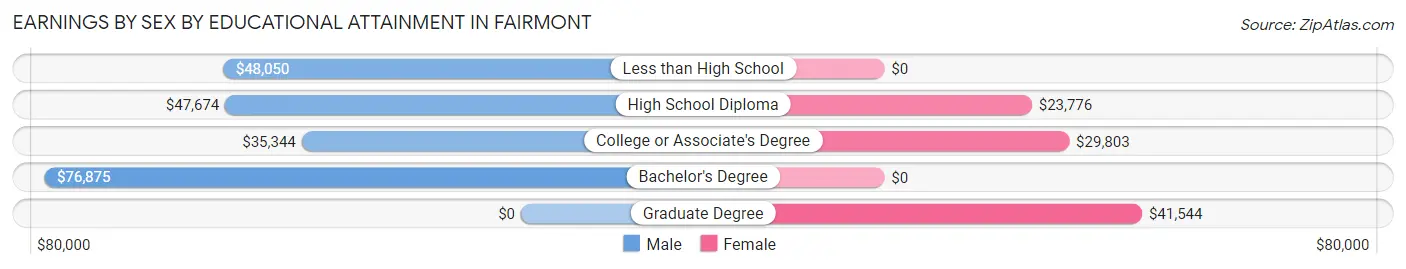
Earnings by Sex by Educational Attainment in Fairmont
Average earnings in Fairmont are $36,884 for men and $28,929 for women, a difference of 21.6%. Men with an educational attainment of bachelor's degree enjoy the highest average annual earnings of $76,875, while those with college or associate's degree education earn the least with $35,344. Women with an educational attainment of graduate degree earn the most with the average annual earnings of $41,544, while those with high school diploma education have the smallest earnings of $23,776.
| Educational Attainment | Male Income | Female Income |
| Less than High School | $48,050 | $0 |
| High School Diploma | $47,674 | $23,776 |
| College or Associate's Degree | $35,344 | $29,803 |
| Bachelor's Degree | $76,875 | $0 |
| Graduate Degree | - | - |
| Total | $36,884 | $28,929 |
Family Income in Fairmont
Family Income Brackets in Fairmont
According to the Fairmont family income data, there are 163 families falling into the $50,000 to $74,999 income range, which is the most common income bracket and makes up 30.3% of all families. Conversely, the $200,000+ income bracket is the least frequent group with only 1 families (0.2%) belonging to this category.
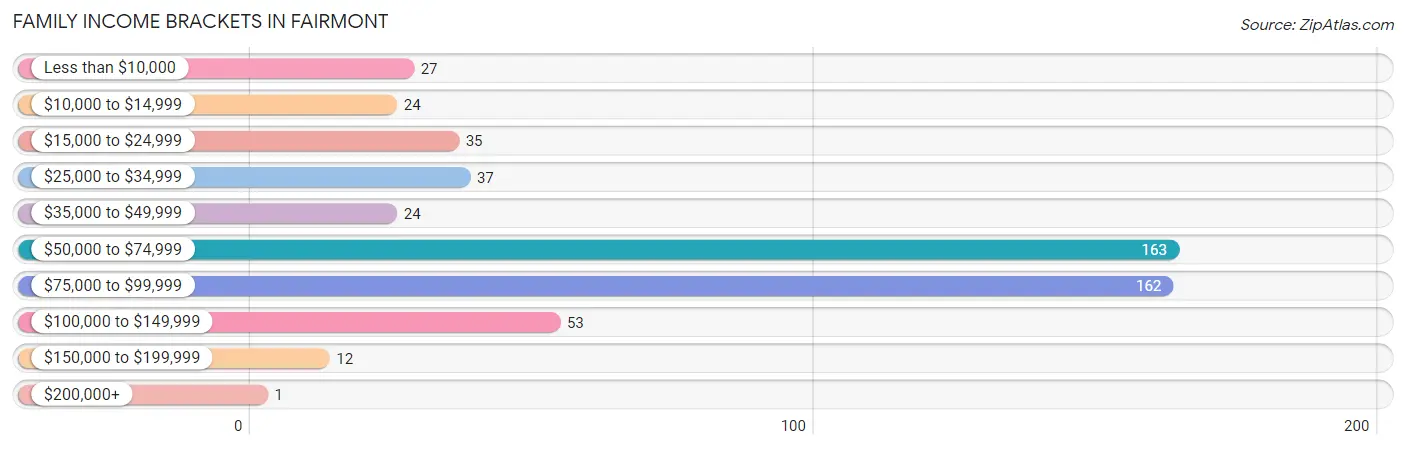
| Income Bracket | # Families | % Families |
| Less than $10,000 | 27 | 5.0% |
| $10,000 to $14,999 | 24 | 4.5% |
| $15,000 to $24,999 | 35 | 6.5% |
| $25,000 to $34,999 | 37 | 6.9% |
| $35,000 to $49,999 | 24 | 4.5% |
| $50,000 to $74,999 | 163 | 30.3% |
| $75,000 to $99,999 | 162 | 30.1% |
| $100,000 to $149,999 | 53 | 9.9% |
| $150,000 to $199,999 | 12 | 2.2% |
| $200,000+ | 1 | 0.2% |
Family Income by Famaliy Size in Fairmont
3-person families (113 | 21.0%) account for the highest median family income in Fairmont with $85,665 per family, while 2-person families (146 | 27.1%) have the highest median income of $33,125 per family member.
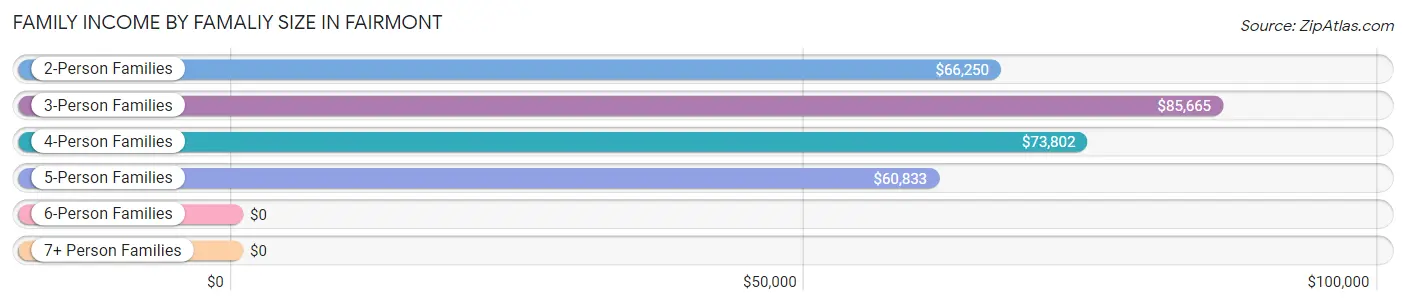
| Income Bracket | # Families | Median Income |
| 2-Person Families | 146 (27.1%) | $66,250 |
| 3-Person Families | 113 (21.0%) | $85,665 |
| 4-Person Families | 87 (16.2%) | $73,802 |
| 5-Person Families | 138 (25.7%) | $60,833 |
| 6-Person Families | 23 (4.3%) | $0 |
| 7+ Person Families | 31 (5.8%) | $0 |
| Total | 538 (100.0%) | $64,792 |
Family Income by Number of Earners in Fairmont
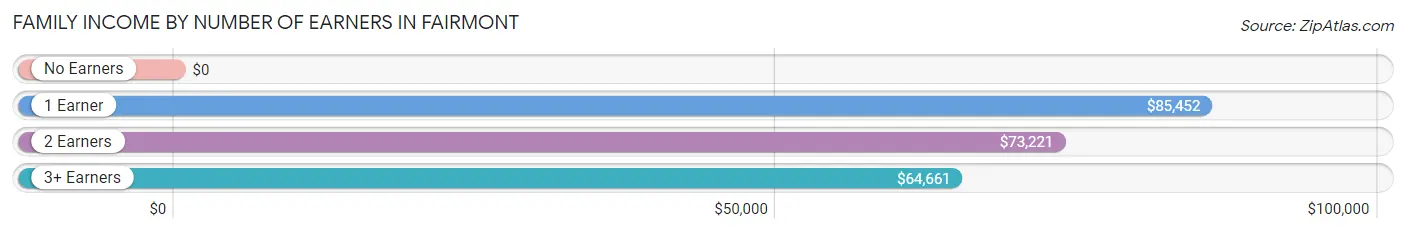
| Number of Earners | # Families | Median Income |
| No Earners | 69 (12.8%) | $0 |
| 1 Earner | 187 (34.8%) | $85,452 |
| 2 Earners | 199 (37.0%) | $73,221 |
| 3+ Earners | 83 (15.4%) | $64,661 |
| Total | 538 (100.0%) | $64,792 |
Household Income in Fairmont
Household Income Brackets in Fairmont
With 258 households falling in the category, the $50,000 to $74,999 income range is the most frequent in Fairmont, accounting for 33.6% of all households. In contrast, only 1 households (0.1%) fall into the $200,000+ income bracket, making it the least populous group.
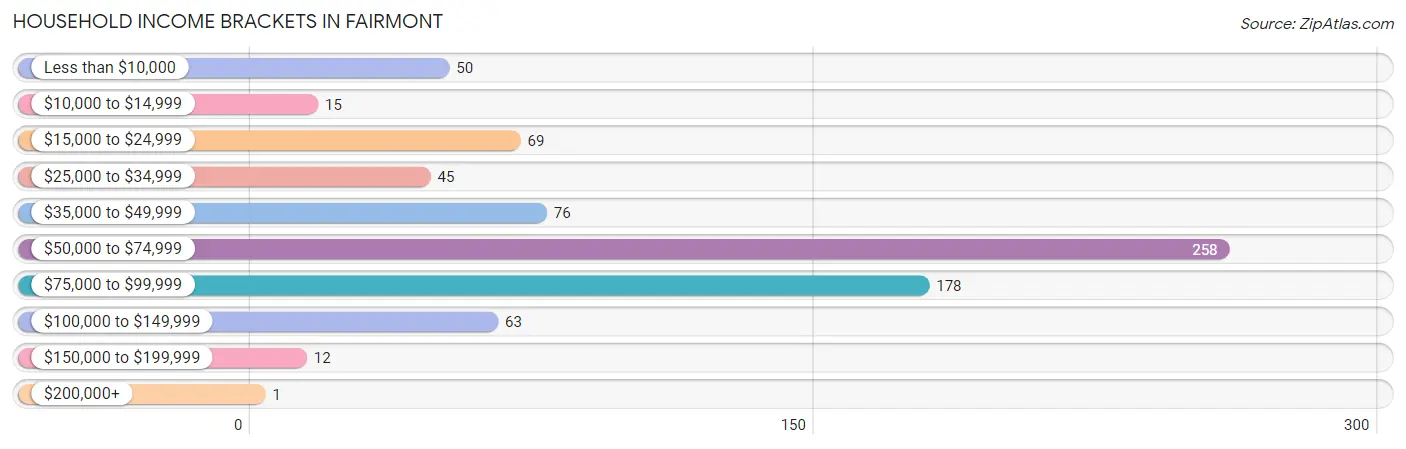
| Income Bracket | # Households | % Households |
| Less than $10,000 | 50 | 6.5% |
| $10,000 to $14,999 | 15 | 2.0% |
| $15,000 to $24,999 | 69 | 9.0% |
| $25,000 to $34,999 | 45 | 5.9% |
| $35,000 to $49,999 | 76 | 9.9% |
| $50,000 to $74,999 | 258 | 33.6% |
| $75,000 to $99,999 | 178 | 23.2% |
| $100,000 to $149,999 | 63 | 8.2% |
| $150,000 to $199,999 | 12 | 1.6% |
| $200,000+ | 1 | 0.1% |
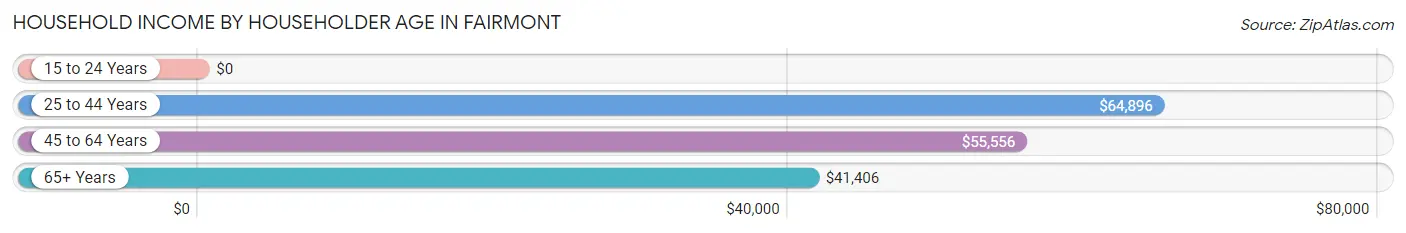
Household Income by Householder Age in Fairmont
The median household income in Fairmont is $61,103, with the highest median household income of $64,896 found in the 25 to 44 years age bracket for the primary householder. A total of 322 households (42.0%) fall into this category.
| Income Bracket | # Households | Median Income |
| 15 to 24 Years | 0 (0.0%) | $0 |
| 25 to 44 Years | 322 (42.0%) | $64,896 |
| 45 to 64 Years | 238 (31.0%) | $55,556 |
| 65+ Years | 207 (27.0%) | $41,406 |
| Total | 767 (100.0%) | $61,103 |
Poverty in Fairmont
Income Below Poverty by Sex and Age in Fairmont
With 18.8% poverty level for males and 20.3% for females among the residents of Fairmont, 16 and 17 year old males and 15 year old females are the most vulnerable to poverty, with 35 males (72.9%) and 18 females (46.2%) in their respective age groups living below the poverty level.
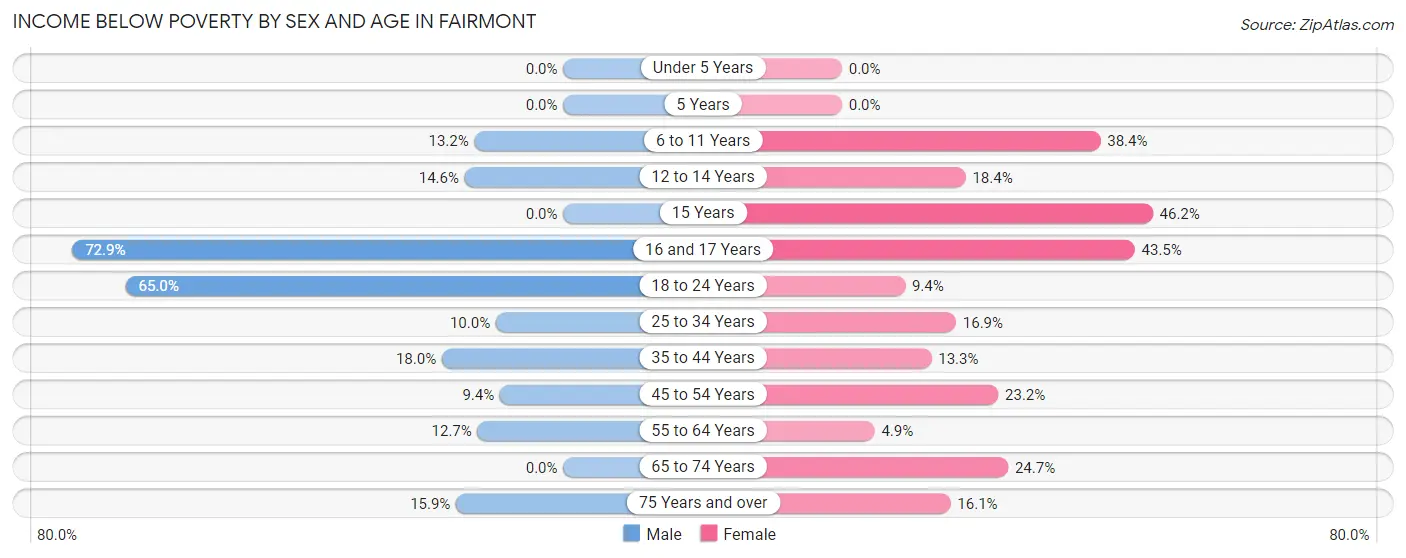
| Age Bracket | Male | Female |
| Under 5 Years | 0 (0.0%) | 0 (0.0%) |
| 5 Years | 0 (0.0%) | 0 (0.0%) |
| 6 to 11 Years | 12 (13.2%) | 104 (38.4%) |
| 12 to 14 Years | 12 (14.6%) | 9 (18.4%) |
| 15 Years | 0 (0.0%) | 18 (46.2%) |
| 16 and 17 Years | 35 (72.9%) | 10 (43.5%) |
| 18 to 24 Years | 78 (65.0%) | 6 (9.4%) |
| 25 to 34 Years | 25 (10.0%) | 41 (16.9%) |
| 35 to 44 Years | 20 (18.0%) | 23 (13.3%) |
| 45 to 54 Years | 11 (9.4%) | 39 (23.2%) |
| 55 to 64 Years | 7 (12.7%) | 5 (4.9%) |
| 65 to 74 Years | 0 (0.0%) | 38 (24.7%) |
| 75 Years and over | 7 (15.9%) | 10 (16.1%) |
| Total | 207 (18.8%) | 303 (20.3%) |
Income Above Poverty by Sex and Age in Fairmont
According to the poverty statistics in Fairmont, males aged under 5 years and females aged under 5 years are the age groups that are most secure financially, with 100.0% of males and 100.0% of females in these age groups living above the poverty line.
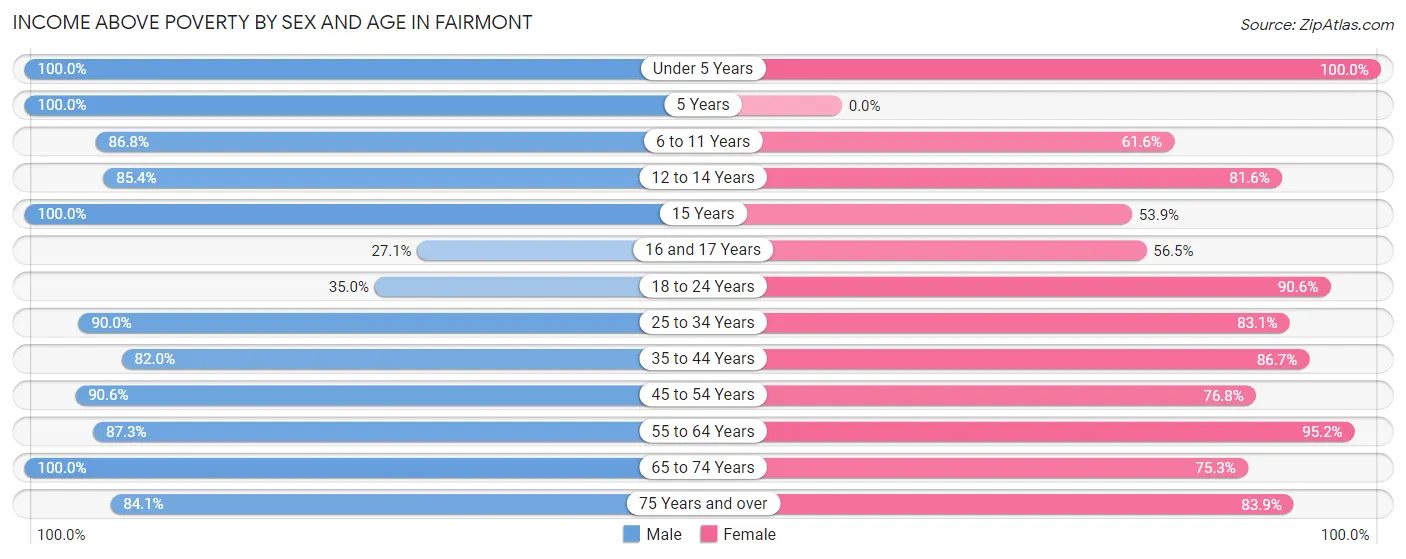
| Age Bracket | Male | Female |
| Under 5 Years | 85 (100.0%) | 146 (100.0%) |
| 5 Years | 13 (100.0%) | 0 (0.0%) |
| 6 to 11 Years | 79 (86.8%) | 167 (61.6%) |
| 12 to 14 Years | 70 (85.4%) | 40 (81.6%) |
| 15 Years | 27 (100.0%) | 21 (53.8%) |
| 16 and 17 Years | 13 (27.1%) | 13 (56.5%) |
| 18 to 24 Years | 42 (35.0%) | 58 (90.6%) |
| 25 to 34 Years | 225 (90.0%) | 201 (83.1%) |
| 35 to 44 Years | 91 (82.0%) | 150 (86.7%) |
| 45 to 54 Years | 106 (90.6%) | 129 (76.8%) |
| 55 to 64 Years | 48 (87.3%) | 98 (95.2%) |
| 65 to 74 Years | 58 (100.0%) | 116 (75.3%) |
| 75 Years and over | 37 (84.1%) | 52 (83.9%) |
| Total | 894 (81.2%) | 1,191 (79.7%) |
Income Below Poverty Among Married-Couple Families in Fairmont
The poverty statistics for married-couple families in Fairmont show that 6.6% or 15 of the total 229 families live below the poverty line. Families with 3 or 4 children have the highest poverty rate of 20.7%, comprising of 12 families. On the other hand, families with no children have the lowest poverty rate of 0.0%, which includes 0 families.
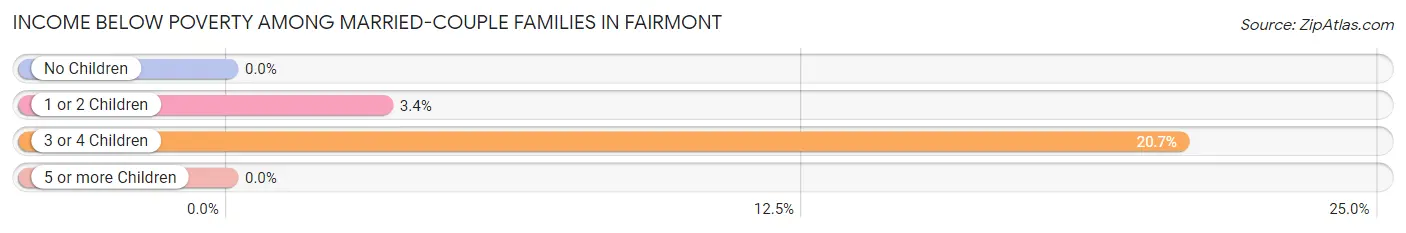
| Children | Above Poverty | Below Poverty |
| No Children | 65 (100.0%) | 0 (0.0%) |
| 1 or 2 Children | 86 (96.6%) | 3 (3.4%) |
| 3 or 4 Children | 46 (79.3%) | 12 (20.7%) |
| 5 or more Children | 17 (100.0%) | 0 (0.0%) |
| Total | 214 (93.4%) | 15 (6.6%) |
Income Below Poverty Among Single-Parent Households in Fairmont
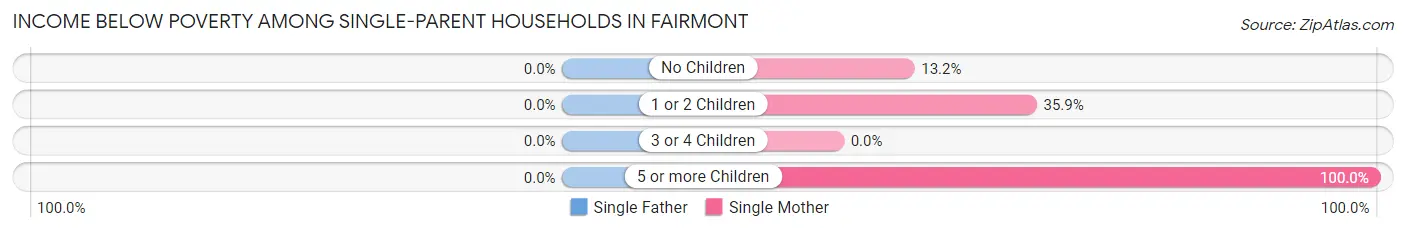
| Children | Single Father | Single Mother |
| No Children | 0 (0.0%) | 15 (13.2%) |
| 1 or 2 Children | 0 (0.0%) | 51 (35.9%) |
| 3 or 4 Children | 0 (0.0%) | 0 (0.0%) |
| 5 or more Children | 0 (0.0%) | 9 (100.0%) |
| Total | 0 (0.0%) | 75 (24.6%) |
Income Below Poverty Among Married-Couple vs Single-Parent Households in Fairmont
The poverty data for Fairmont shows that 15 of the married-couple family households (6.6%) and 75 of the single-parent households (24.3%) are living below the poverty level. Within the married-couple family households, those with 3 or 4 children have the highest poverty rate, with 12 households (20.7%) falling below the poverty line. Among the single-parent households, those with 5 or more children have the highest poverty rate, with 9 household (100.0%) living below poverty.
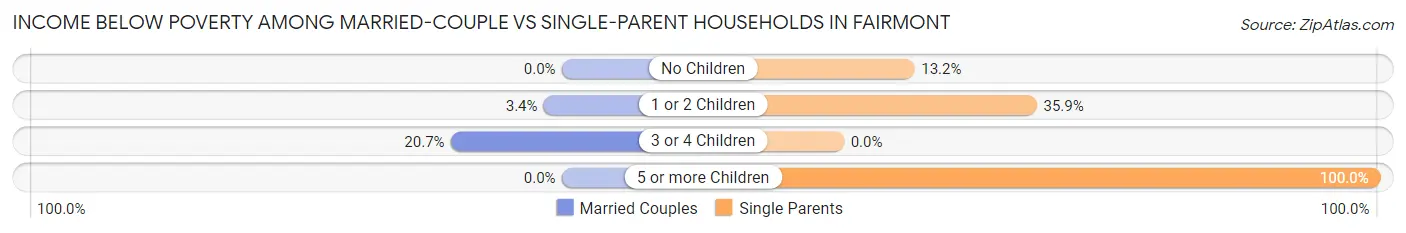
| Children | Married-Couple Families | Single-Parent Households |
| No Children | 0 (0.0%) | 15 (13.2%) |
| 1 or 2 Children | 3 (3.4%) | 51 (35.9%) |
| 3 or 4 Children | 12 (20.7%) | 0 (0.0%) |
| 5 or more Children | 0 (0.0%) | 9 (100.0%) |
| Total | 15 (6.6%) | 75 (24.3%) |
Race in Fairmont
The most populous races in Fairmont are White / Caucasian (1,094 | 42.2%), Hispanic or Latino (940 | 36.2%), and Black / African American (861 | 33.2%).
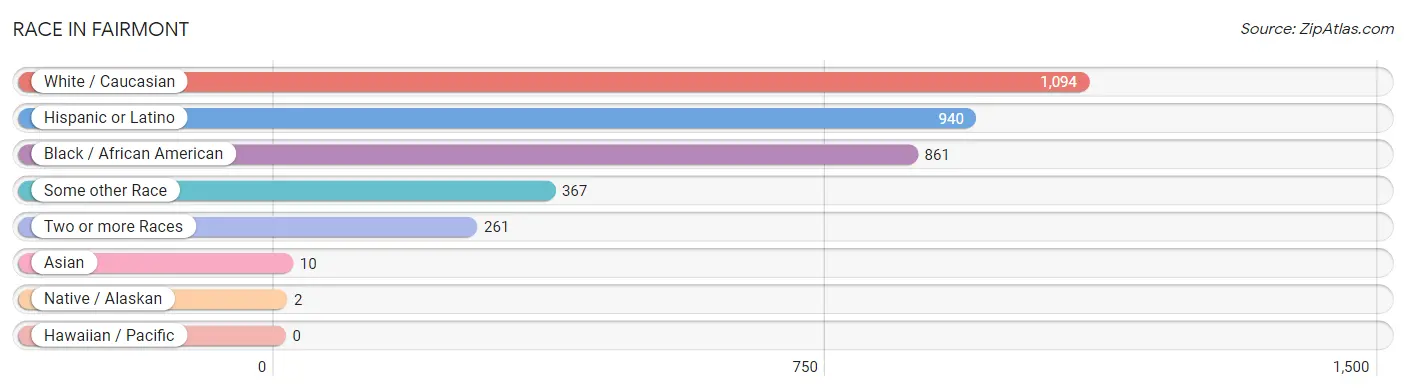
| Race | # Population | % Population |
| Asian | 10 | 0.4% |
| Black / African American | 861 | 33.2% |
| Hawaiian / Pacific | 0 | 0.0% |
| Hispanic or Latino | 940 | 36.2% |
| Native / Alaskan | 2 | 0.1% |
| White / Caucasian | 1,094 | 42.2% |
| Two or more Races | 261 | 10.1% |
| Some other Race | 367 | 14.1% |
| Total | 2,595 | 100.0% |
Ancestry in Fairmont
The most populous ancestries reported in Fairmont are Mexican (829 | 32.0%), Polish (252 | 9.7%), German (211 | 8.1%), Italian (169 | 6.5%), and American (55 | 2.1%), together accounting for 58.4% of all Fairmont residents.
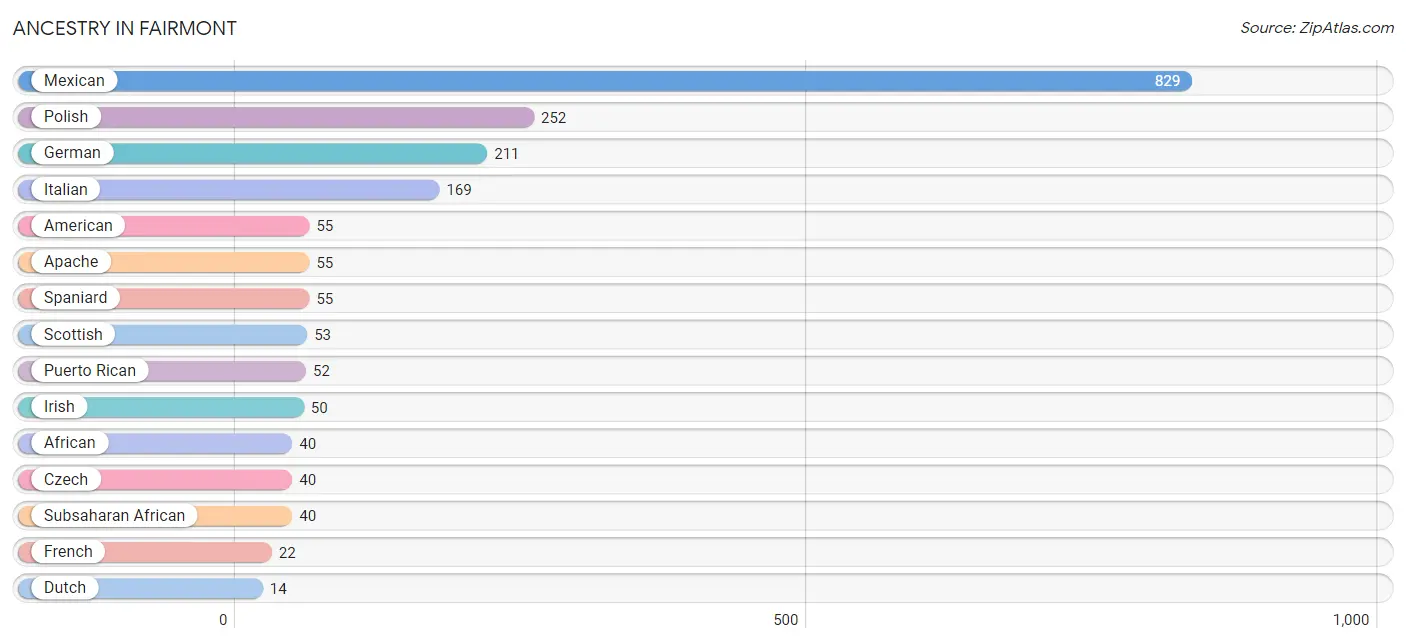
| Ancestry | # Population | % Population |
| African | 40 | 1.5% |
| American | 55 | 2.1% |
| Apache | 55 | 2.1% |
| British | 5 | 0.2% |
| Czech | 40 | 1.5% |
| Dutch | 14 | 0.5% |
| English | 6 | 0.2% |
| French | 22 | 0.9% |
| German | 211 | 8.1% |
| German Russian | 13 | 0.5% |
| Irish | 50 | 1.9% |
| Italian | 169 | 6.5% |
| Lithuanian | 4 | 0.2% |
| Mexican | 829 | 32.0% |
| Mexican American Indian | 2 | 0.1% |
| Norwegian | 13 | 0.5% |
| Polish | 252 | 9.7% |
| Portuguese | 9 | 0.4% |
| Puerto Rican | 52 | 2.0% |
| Russian | 13 | 0.5% |
| Scottish | 53 | 2.0% |
| Spaniard | 55 | 2.1% |
| Subsaharan African | 40 | 1.5% |
| Swedish | 14 | 0.5% | View All 24 Rows |
Immigrants in Fairmont
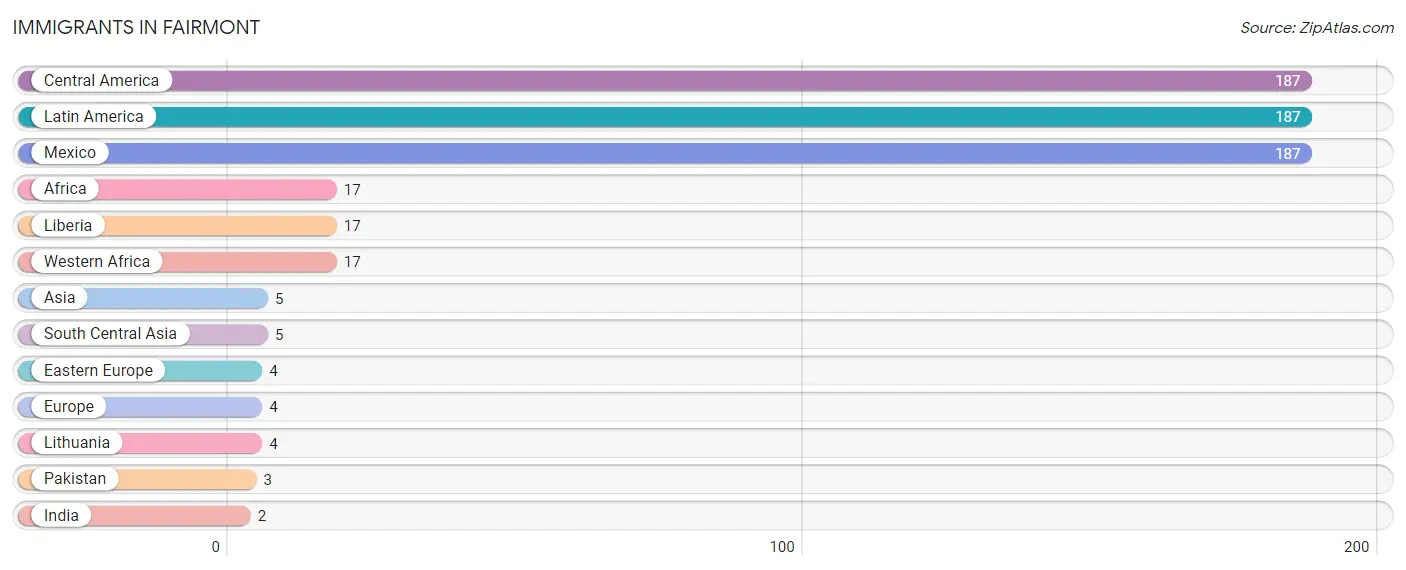
The most numerous immigrant groups reported in Fairmont came from Central America (187 | 7.2%), Latin America (187 | 7.2%), Mexico (187 | 7.2%), Africa (17 | 0.7%), and Liberia (17 | 0.7%), together accounting for 22.9% of all Fairmont residents.
| Immigration Origin | # Population | % Population |
| Africa | 17 | 0.7% |
| Asia | 5 | 0.2% |
| Central America | 187 | 7.2% |
| Eastern Europe | 4 | 0.2% |
| Europe | 4 | 0.2% |
| India | 2 | 0.1% |
| Latin America | 187 | 7.2% |
| Liberia | 17 | 0.7% |
| Lithuania | 4 | 0.2% |
| Mexico | 187 | 7.2% |
| Pakistan | 3 | 0.1% |
| South Central Asia | 5 | 0.2% |
| Western Africa | 17 | 0.7% | View All 13 Rows |
Sex and Age in Fairmont
Sex and Age in Fairmont
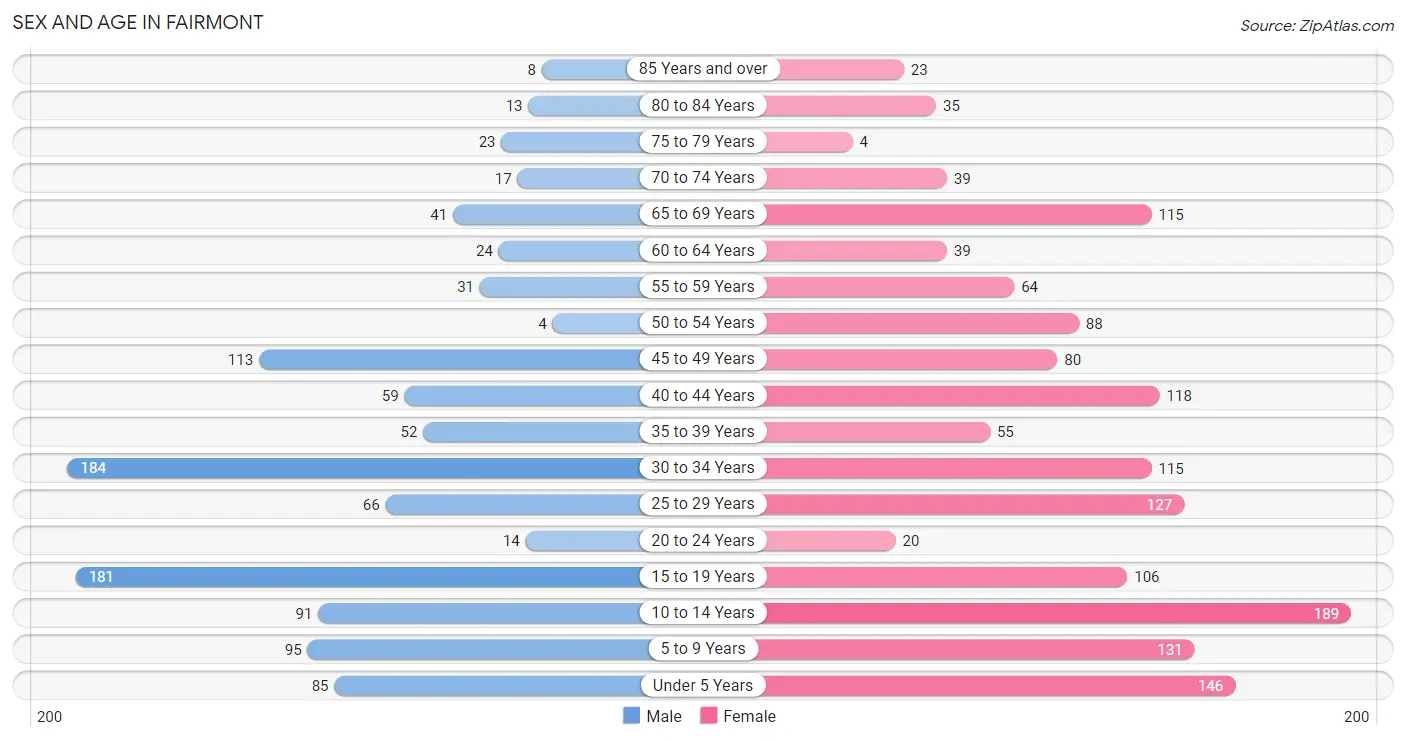
The most populous age groups in Fairmont are 30 to 34 Years (184 | 16.7%) for men and 10 to 14 Years (189 | 12.7%) for women.
| Age Bracket | Male | Female |
| Under 5 Years | 85 (7.7%) | 146 (9.8%) |
| 5 to 9 Years | 95 (8.6%) | 131 (8.8%) |
| 10 to 14 Years | 91 (8.3%) | 189 (12.7%) |
| 15 to 19 Years | 181 (16.4%) | 106 (7.1%) |
| 20 to 24 Years | 14 (1.3%) | 20 (1.3%) |
| 25 to 29 Years | 66 (6.0%) | 127 (8.5%) |
| 30 to 34 Years | 184 (16.7%) | 115 (7.7%) |
| 35 to 39 Years | 52 (4.7%) | 55 (3.7%) |
| 40 to 44 Years | 59 (5.4%) | 118 (7.9%) |
| 45 to 49 Years | 113 (10.3%) | 80 (5.3%) |
| 50 to 54 Years | 4 (0.4%) | 88 (5.9%) |
| 55 to 59 Years | 31 (2.8%) | 64 (4.3%) |
| 60 to 64 Years | 24 (2.2%) | 39 (2.6%) |
| 65 to 69 Years | 41 (3.7%) | 115 (7.7%) |
| 70 to 74 Years | 17 (1.5%) | 39 (2.6%) |
| 75 to 79 Years | 23 (2.1%) | 4 (0.3%) |
| 80 to 84 Years | 13 (1.2%) | 35 (2.3%) |
| 85 Years and over | 8 (0.7%) | 23 (1.5%) |
| Total | 1,101 (100.0%) | 1,494 (100.0%) |
Families and Households in Fairmont
Median Family Size in Fairmont
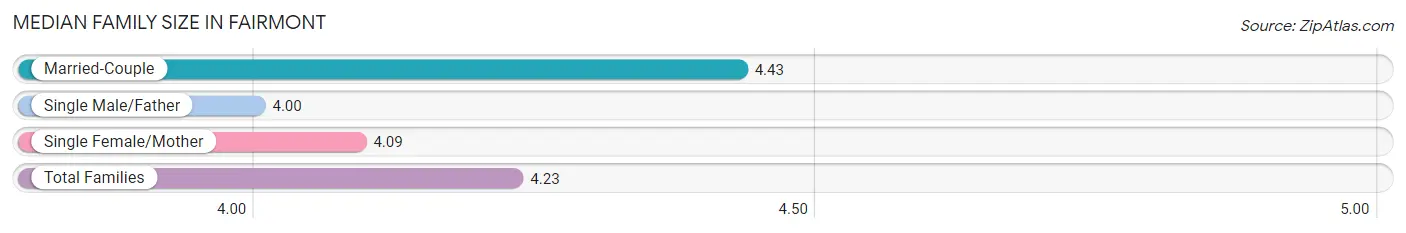
The median family size in Fairmont is 4.23 persons per family, with married-couple families (229 | 42.6%) accounting for the largest median family size of 4.43 persons per family. On the other hand, single male/father families (4 | 0.7%) represent the smallest median family size with 4.00 persons per family.
| Family Type | # Families | Family Size |
| Married-Couple | 229 (42.6%) | 4.43 |
| Single Male/Father | 4 (0.7%) | 4.00 |
| Single Female/Mother | 305 (56.7%) | 4.09 |
| Total Families | 538 (100.0%) | 4.23 |
Median Household Size in Fairmont
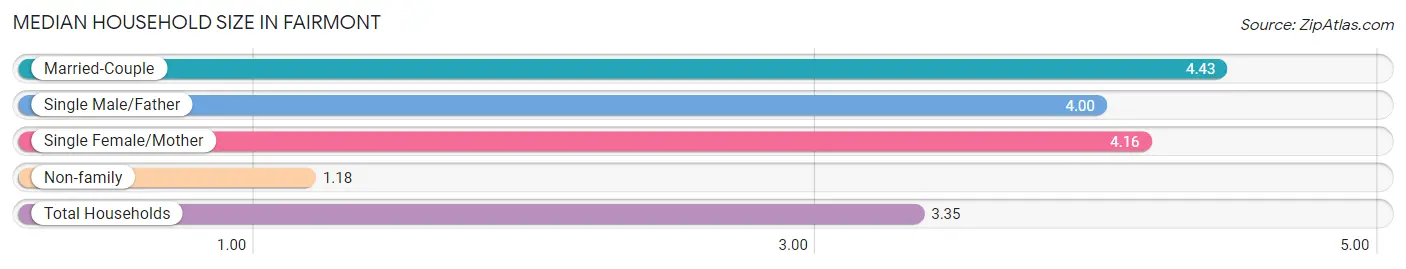
The median household size in Fairmont is 3.35 persons per household, with married-couple households (229 | 29.9%) accounting for the largest median household size of 4.43 persons per household. non-family households (229 | 29.9%) represent the smallest median household size with 1.18 persons per household.
| Household Type | # Households | Household Size |
| Married-Couple | 229 (29.9%) | 4.43 |
| Single Male/Father | 4 (0.5%) | 4.00 |
| Single Female/Mother | 305 (39.8%) | 4.16 |
| Non-family | 229 (29.9%) | 1.18 |
| Total Households | 767 (100.0%) | 3.35 |
Household Size by Marriage Status in Fairmont
Out of a total of 767 households in Fairmont, 538 (70.1%) are family households, while 229 (29.9%) are nonfamily households. The most numerous type of family households are 2-person households, comprising 139, and the most common type of nonfamily households are 1-person households, comprising 209.
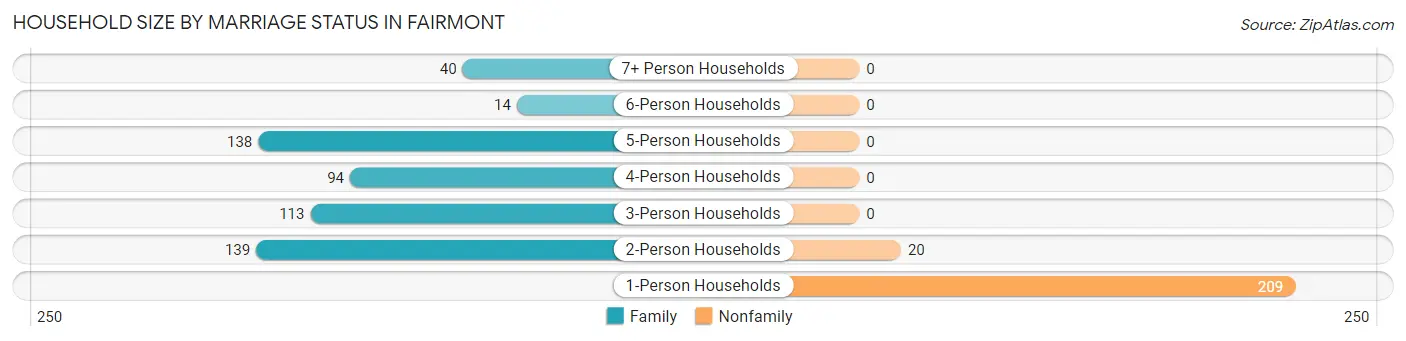
| Household Size | Family Households | Nonfamily Households |
| 1-Person Households | - | 209 (27.3%) |
| 2-Person Households | 139 (18.1%) | 20 (2.6%) |
| 3-Person Households | 113 (14.7%) | 0 (0.0%) |
| 4-Person Households | 94 (12.3%) | 0 (0.0%) |
| 5-Person Households | 138 (18.0%) | 0 (0.0%) |
| 6-Person Households | 14 (1.8%) | 0 (0.0%) |
| 7+ Person Households | 40 (5.2%) | 0 (0.0%) |
| Total | 538 (70.1%) | 229 (29.9%) |
Female Fertility in Fairmont
Fertility by Age in Fairmont
Average fertility rate in Fairmont is 12.0 births per 1,000 women. Women in the age bracket of 20 to 34 years have the highest fertility rate with 31.0 births per 1,000 women. Women in the age bracket of 20 to 34 years acount for 100.0% of all women with births.
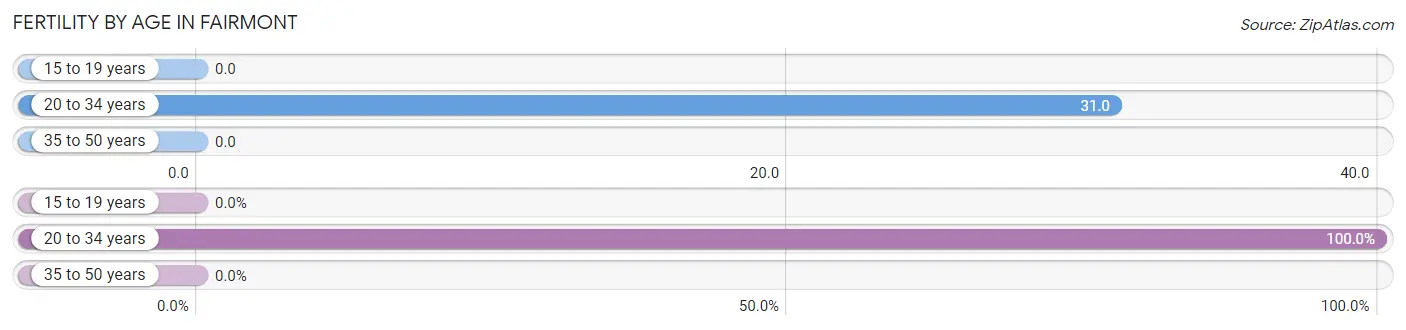
| Age Bracket | Women with Births | Births / 1,000 Women |
| 15 to 19 years | 0 (0.0%) | 0.0 |
| 20 to 34 years | 8 (100.0%) | 31.0 |
| 35 to 50 years | 0 (0.0%) | 0.0 |
| Total | 8 (100.0%) | 12.0 |
Fertility by Age by Marriage Status in Fairmont
25.0% of women with births (8) in Fairmont are married. The highest percentage of unmarried women with births falls into 20 to 34 years age bracket with 75.0% of them unmarried at the time of birth, while the lowest percentage of unmarried women with births belong to 20 to 34 years age bracket with 75.0% of them unmarried.
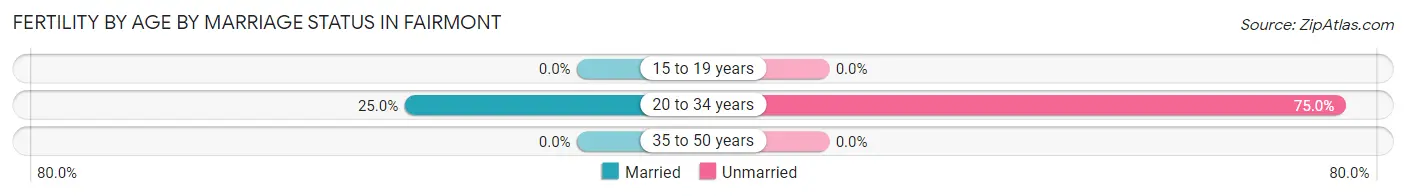
| Age Bracket | Married | Unmarried |
| 15 to 19 years | 0 (0.0%) | 0 (0.0%) |
| 20 to 34 years | 2 (25.0%) | 6 (75.0%) |
| 35 to 50 years | 0 (0.0%) | 0 (0.0%) |
| Total | 2 (25.0%) | 6 (75.0%) |
Fertility by Education in Fairmont
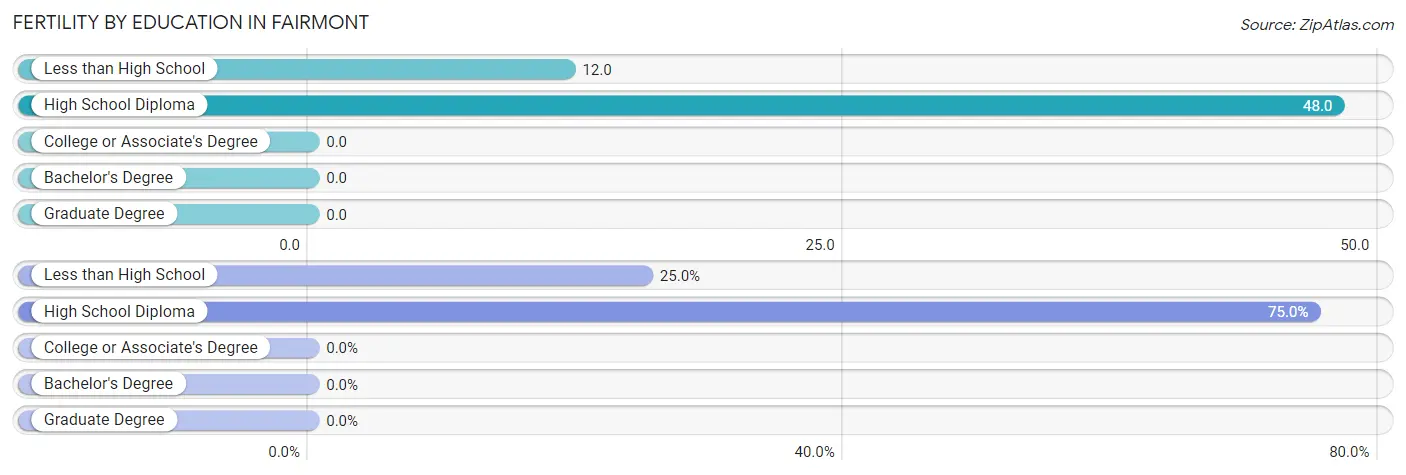
| Educational Attainment | Women with Births | Births / 1,000 Women |
| Less than High School | 2 (25.0%) | 12.0 |
| High School Diploma | 6 (75.0%) | 48.0 |
| College or Associate's Degree | 0 (0.0%) | 0.0 |
| Bachelor's Degree | 0 (0.0%) | 0.0 |
| Graduate Degree | 0 (0.0%) | 0.0 |
| Total | 8 (100.0%) | 12.0 |
Fertility by Education by Marriage Status in Fairmont
75.0% of women with births in Fairmont are unmarried. Women with the educational attainment of less than high school are most likely to be married with 100.0% of them married at childbirth, while women with the educational attainment of high school diploma are least likely to be married with 100.0% of them unmarried at childbirth.
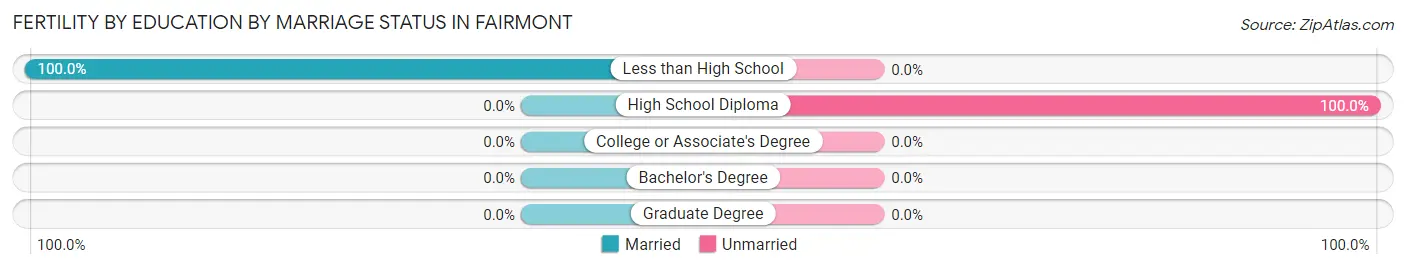
| Educational Attainment | Married | Unmarried |
| Less than High School | 2 (100.0%) | 0 (0.0%) |
| High School Diploma | 0 (0.0%) | 6 (100.0%) |
| College or Associate's Degree | 0 (0.0%) | 0 (0.0%) |
| Bachelor's Degree | 0 (0.0%) | 0 (0.0%) |
| Graduate Degree | 0 (0.0%) | 0 (0.0%) |
| Total | 2 (25.0%) | 6 (75.0%) |
Employment Characteristics in Fairmont
Employment by Class of Employer in Fairmont
Among the 1,054 employed individuals in Fairmont, private company employees (872 | 82.7%), not-for-profit organizations (67 | 6.4%), and federal government employees (44 | 4.2%) make up the most common classes of employment.
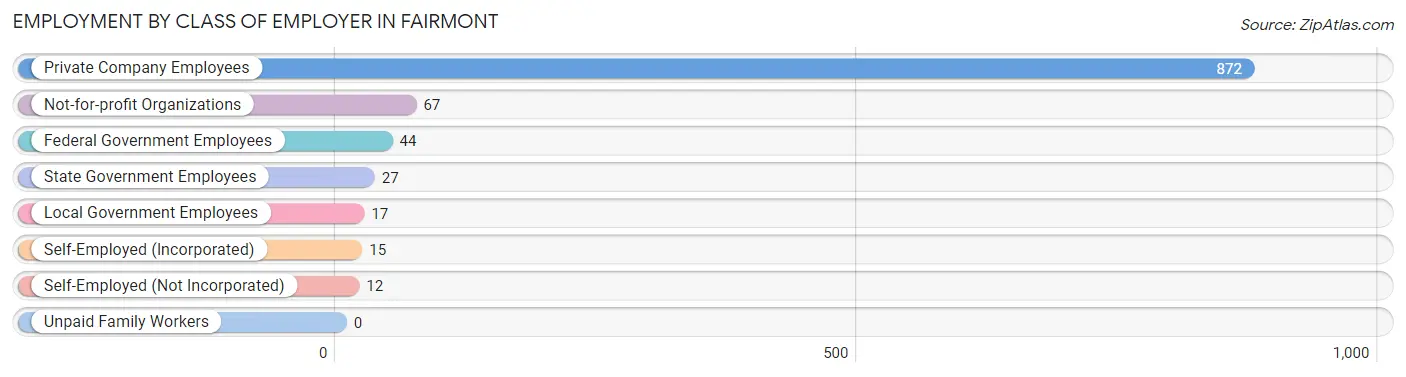
| Employer Class | # Employees | % Employees |
| Private Company Employees | 872 | 82.7% |
| Self-Employed (Incorporated) | 15 | 1.4% |
| Self-Employed (Not Incorporated) | 12 | 1.1% |
| Not-for-profit Organizations | 67 | 6.4% |
| Local Government Employees | 17 | 1.6% |
| State Government Employees | 27 | 2.6% |
| Federal Government Employees | 44 | 4.2% |
| Unpaid Family Workers | 0 | 0.0% |
| Total | 1,054 | 100.0% |
Employment Status by Age in Fairmont
According to the labor force statistics for Fairmont, out of the total population over 16 years of age (1,792), 66.1% or 1,185 individuals are in the labor force, with 9.6% or 114 of them unemployed. The age group with the highest labor force participation rate is 20 to 24 years, with 100.0% or 34 individuals in the labor force. Within the labor force, the 75 years and over age range has the highest percentage of unemployed individuals, with 100.0% or 4 of them being unemployed.
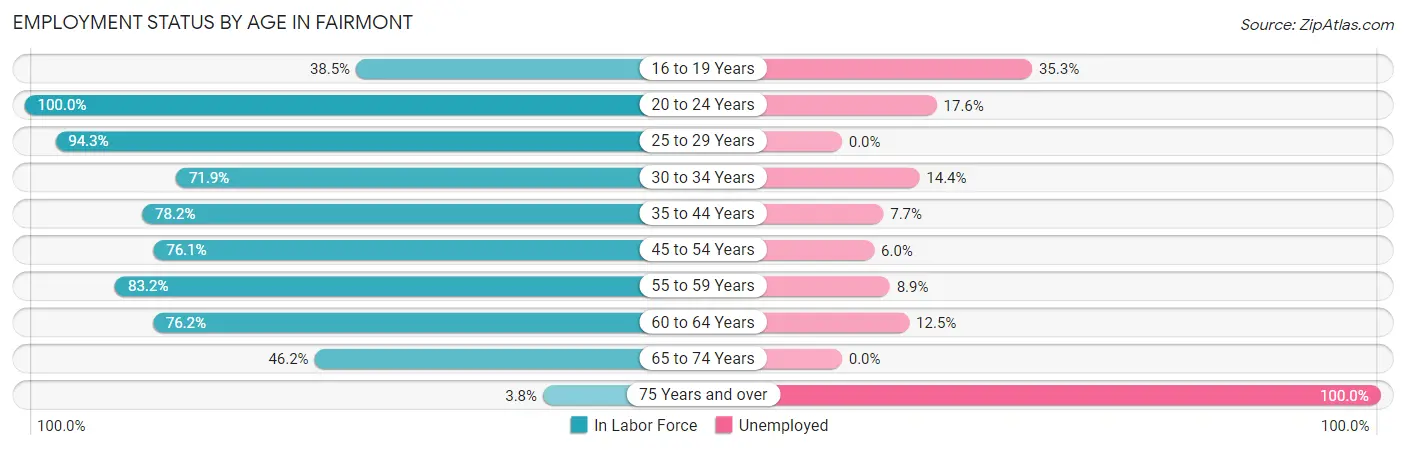
| Age Bracket | In Labor Force | Unemployed |
| 16 to 19 Years | 85 (38.5%) | 30 (35.3%) |
| 20 to 24 Years | 34 (100.0%) | 6 (17.6%) |
| 25 to 29 Years | 182 (94.3%) | 0 (0.0%) |
| 30 to 34 Years | 215 (71.9%) | 31 (14.4%) |
| 35 to 44 Years | 222 (78.2%) | 17 (7.7%) |
| 45 to 54 Years | 217 (76.1%) | 13 (6.0%) |
| 55 to 59 Years | 79 (83.2%) | 7 (8.9%) |
| 60 to 64 Years | 48 (76.2%) | 6 (12.5%) |
| 65 to 74 Years | 98 (46.2%) | 0 (0.0%) |
| 75 Years and over | 4 (3.8%) | 4 (100.0%) |
| Total | 1,185 (66.1%) | 114 (9.6%) |
Employment Status by Educational Attainment in Fairmont
According to labor force statistics for Fairmont, 79.0% of individuals (963) out of the total population between 25 and 64 years of age (1,219) are in the labor force, with 7.7% or 74 of them being unemployed. The group with the highest labor force participation rate are those with the educational attainment of less than high school, with 89.6% or 129 individuals in the labor force. Within the labor force, individuals with less than high school education have the highest percentage of unemployment, with 32.6% or 42 of them being unemployed.
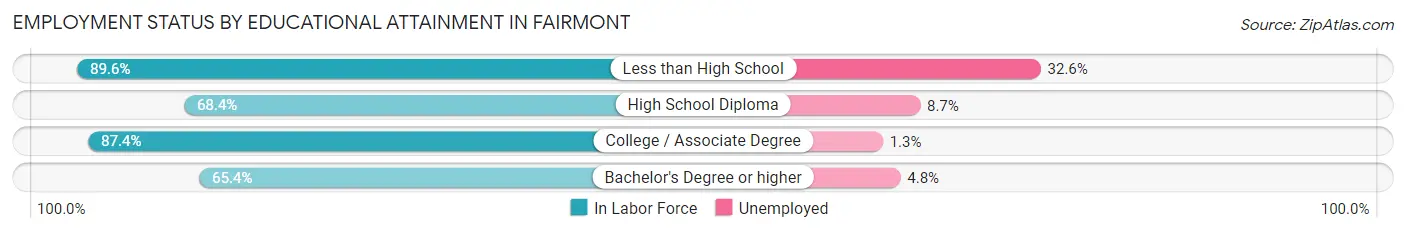
| Educational Attainment | In Labor Force | Unemployed |
| Less than High School | 129 (89.6%) | 47 (32.6%) |
| High School Diploma | 229 (68.4%) | 29 (8.7%) |
| College / Associate Degree | 480 (87.4%) | 7 (1.3%) |
| Bachelor's Degree or higher | 125 (65.4%) | 9 (4.8%) |
| Total | 963 (79.0%) | 94 (7.7%) |
Employment Occupations by Sex in Fairmont
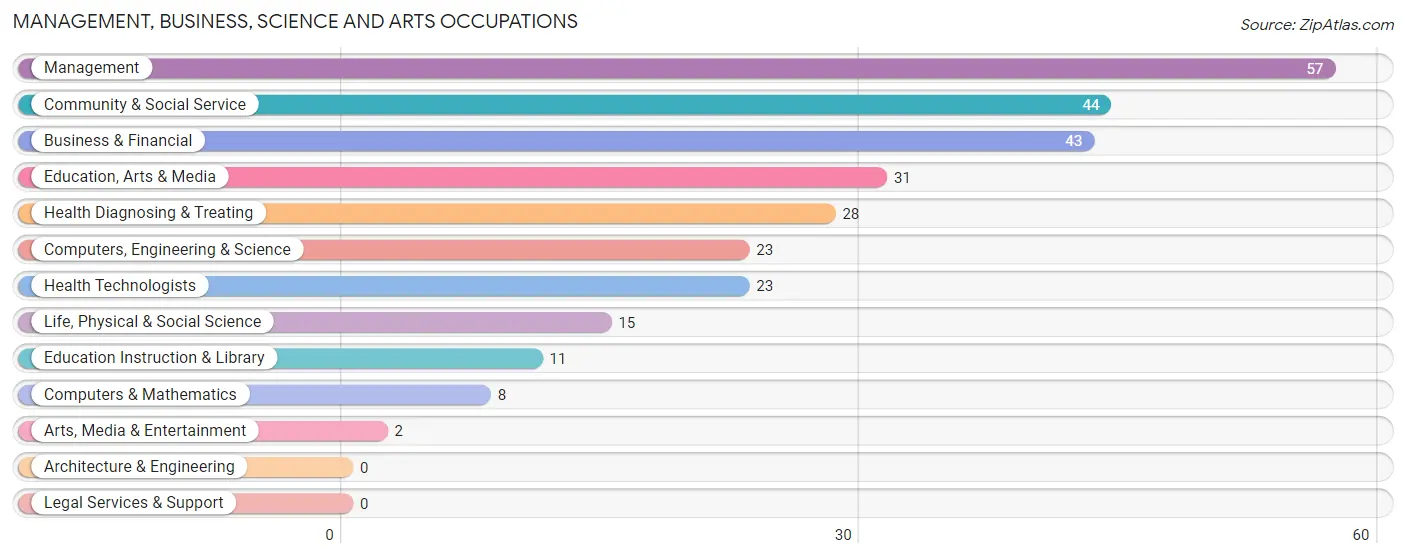
Management, Business, Science and Arts Occupations
The most common Management, Business, Science and Arts occupations in Fairmont are Management (57 | 5.3%), Community & Social Service (44 | 4.1%), Business & Financial (43 | 4.0%), Education, Arts & Media (31 | 2.9%), and Health Diagnosing & Treating (28 | 2.6%).
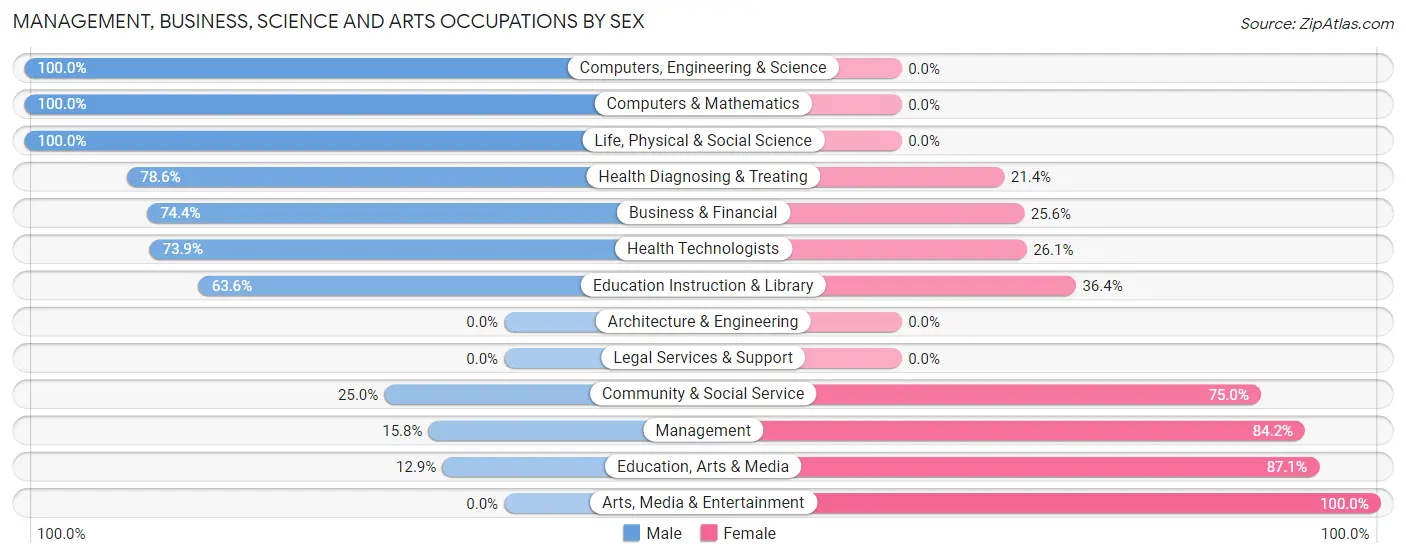
Management, Business, Science and Arts Occupations by Sex
Within the Management, Business, Science and Arts occupations in Fairmont, the most male-oriented occupations are Computers, Engineering & Science (100.0%), Computers & Mathematics (100.0%), and Life, Physical & Social Science (100.0%), while the most female-oriented occupations are Arts, Media & Entertainment (100.0%), Education, Arts & Media (87.1%), and Management (84.2%).
| Occupation | Male | Female |
| Management | 9 (15.8%) | 48 (84.2%) |
| Business & Financial | 32 (74.4%) | 11 (25.6%) |
| Computers, Engineering & Science | 23 (100.0%) | 0 (0.0%) |
| Computers & Mathematics | 8 (100.0%) | 0 (0.0%) |
| Architecture & Engineering | 0 (0.0%) | 0 (0.0%) |
| Life, Physical & Social Science | 15 (100.0%) | 0 (0.0%) |
| Community & Social Service | 11 (25.0%) | 33 (75.0%) |
| Education, Arts & Media | 4 (12.9%) | 27 (87.1%) |
| Legal Services & Support | 0 (0.0%) | 0 (0.0%) |
| Education Instruction & Library | 7 (63.6%) | 4 (36.4%) |
| Arts, Media & Entertainment | 0 (0.0%) | 2 (100.0%) |
| Health Diagnosing & Treating | 22 (78.6%) | 6 (21.4%) |
| Health Technologists | 17 (73.9%) | 6 (26.1%) |
| Total (Category) | 97 (49.7%) | 98 (50.3%) |
| Total (Overall) | 509 (47.6%) | 561 (52.4%) |
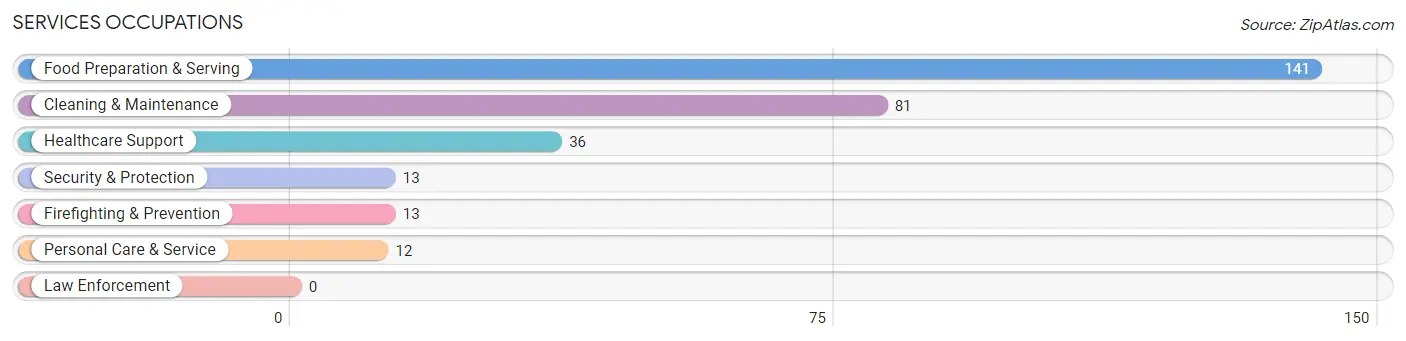
Services Occupations
The most common Services occupations in Fairmont are Food Preparation & Serving (141 | 13.2%), Cleaning & Maintenance (81 | 7.6%), Healthcare Support (36 | 3.4%), Security & Protection (13 | 1.2%), and Firefighting & Prevention (13 | 1.2%).
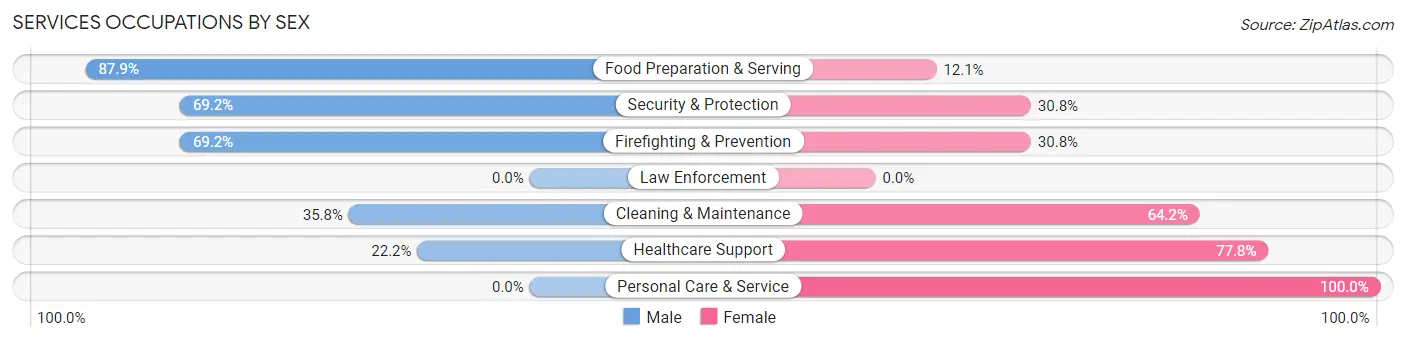
Services Occupations by Sex
Within the Services occupations in Fairmont, the most male-oriented occupations are Food Preparation & Serving (87.9%), Security & Protection (69.2%), and Firefighting & Prevention (69.2%), while the most female-oriented occupations are Personal Care & Service (100.0%), Healthcare Support (77.8%), and Cleaning & Maintenance (64.2%).
| Occupation | Male | Female |
| Healthcare Support | 8 (22.2%) | 28 (77.8%) |
| Security & Protection | 9 (69.2%) | 4 (30.8%) |
| Firefighting & Prevention | 9 (69.2%) | 4 (30.8%) |
| Law Enforcement | 0 (0.0%) | 0 (0.0%) |
| Food Preparation & Serving | 124 (87.9%) | 17 (12.1%) |
| Cleaning & Maintenance | 29 (35.8%) | 52 (64.2%) |
| Personal Care & Service | 0 (0.0%) | 12 (100.0%) |
| Total (Category) | 170 (60.1%) | 113 (39.9%) |
| Total (Overall) | 509 (47.6%) | 561 (52.4%) |
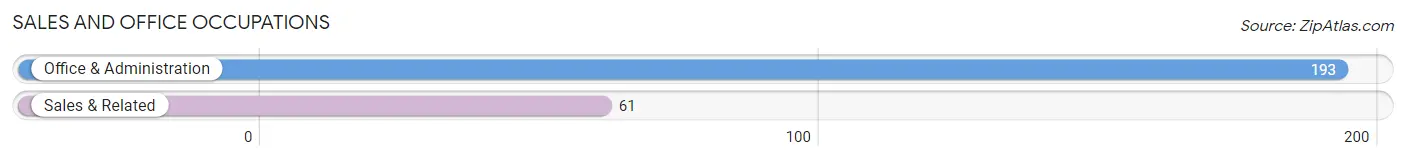
Sales and Office Occupations
The most common Sales and Office occupations in Fairmont are Office & Administration (193 | 18.0%), and Sales & Related (61 | 5.7%).
Sales and Office Occupations by Sex
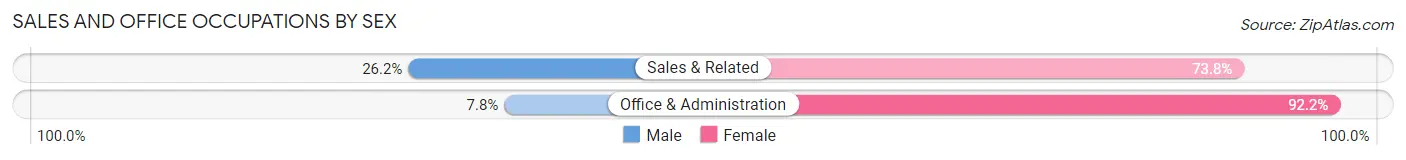
| Occupation | Male | Female |
| Sales & Related | 16 (26.2%) | 45 (73.8%) |
| Office & Administration | 15 (7.8%) | 178 (92.2%) |
| Total (Category) | 31 (12.2%) | 223 (87.8%) |
| Total (Overall) | 509 (47.6%) | 561 (52.4%) |
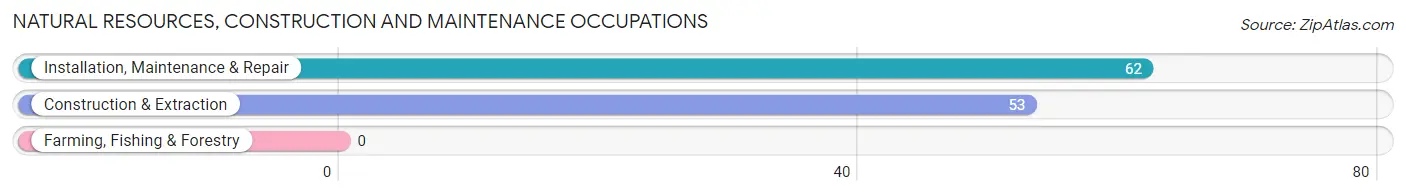
Natural Resources, Construction and Maintenance Occupations
The most common Natural Resources, Construction and Maintenance occupations in Fairmont are Installation, Maintenance & Repair (62 | 5.8%), and Construction & Extraction (53 | 5.0%).
Natural Resources, Construction and Maintenance Occupations by Sex
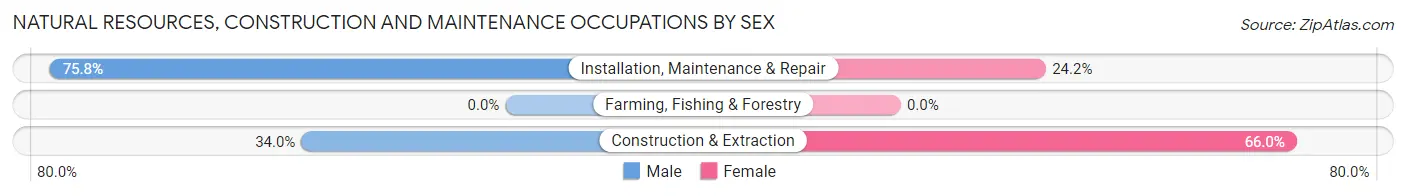
| Occupation | Male | Female |
| Farming, Fishing & Forestry | 0 (0.0%) | 0 (0.0%) |
| Construction & Extraction | 18 (34.0%) | 35 (66.0%) |
| Installation, Maintenance & Repair | 47 (75.8%) | 15 (24.2%) |
| Total (Category) | 65 (56.5%) | 50 (43.5%) |
| Total (Overall) | 509 (47.6%) | 561 (52.4%) |
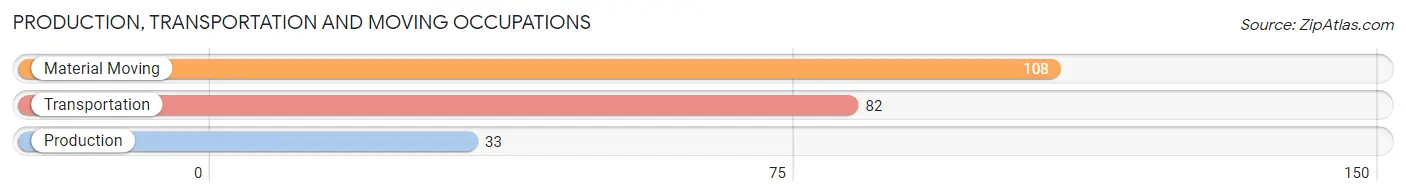
Production, Transportation and Moving Occupations
The most common Production, Transportation and Moving occupations in Fairmont are Material Moving (108 | 10.1%), Transportation (82 | 7.7%), and Production (33 | 3.1%).
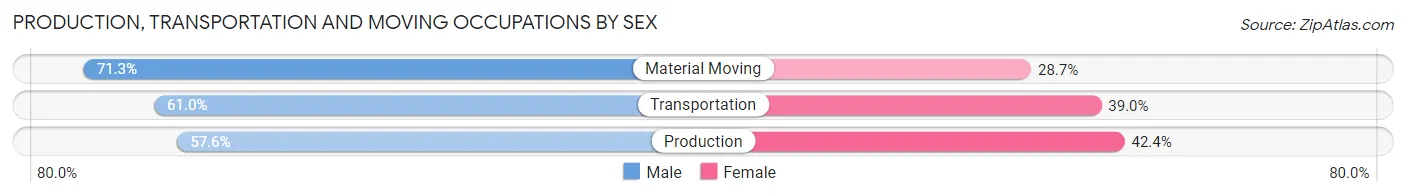
Production, Transportation and Moving Occupations by Sex
| Occupation | Male | Female |
| Production | 19 (57.6%) | 14 (42.4%) |
| Transportation | 50 (61.0%) | 32 (39.0%) |
| Material Moving | 77 (71.3%) | 31 (28.7%) |
| Total (Category) | 146 (65.5%) | 77 (34.5%) |
| Total (Overall) | 509 (47.6%) | 561 (52.4%) |
Employment Industries by Sex in Fairmont
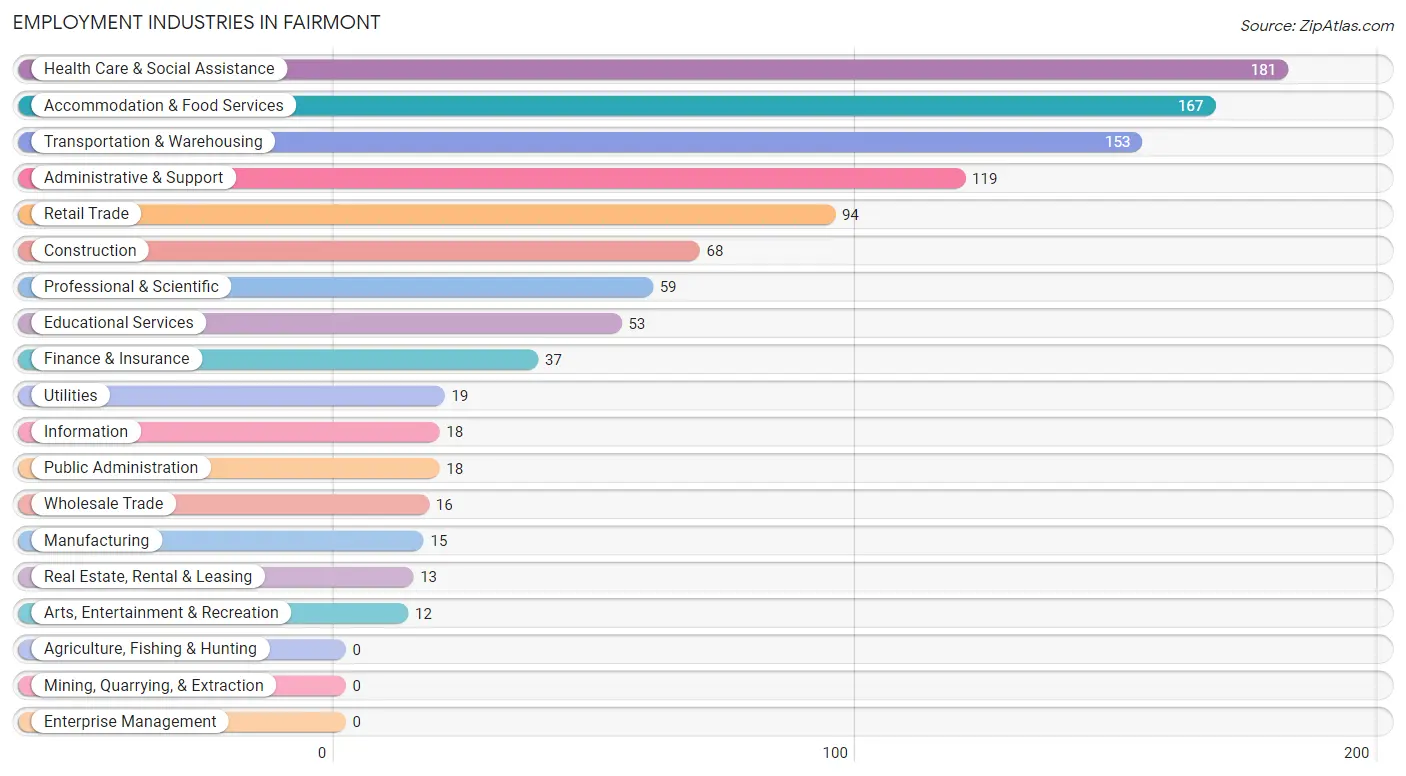
Employment Industries in Fairmont
The major employment industries in Fairmont include Health Care & Social Assistance (181 | 16.9%), Accommodation & Food Services (167 | 15.6%), Transportation & Warehousing (153 | 14.3%), Administrative & Support (119 | 11.1%), and Retail Trade (94 | 8.8%).
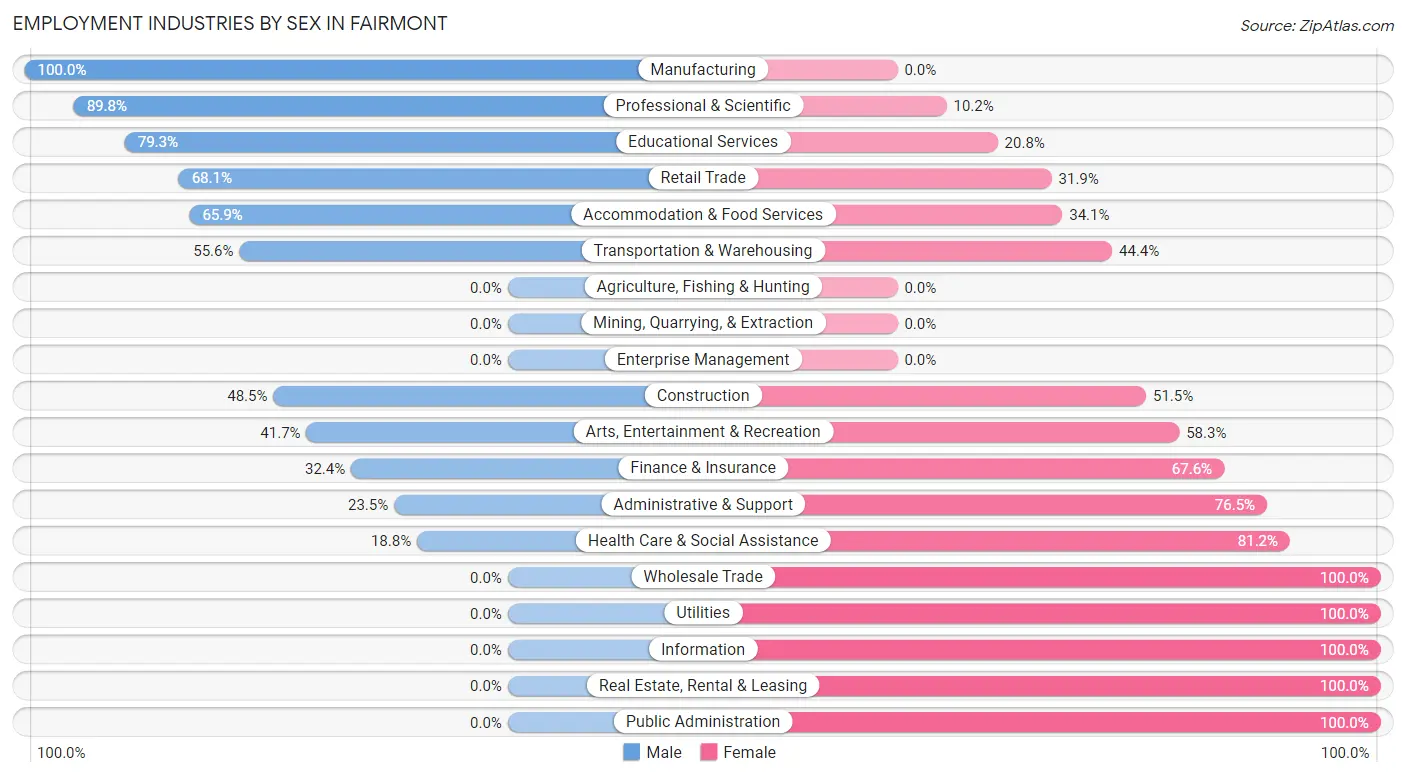
Employment Industries by Sex in Fairmont
The Fairmont industries that see more men than women are Manufacturing (100.0%), Professional & Scientific (89.8%), and Educational Services (79.2%), whereas the industries that tend to have a higher number of women are Wholesale Trade (100.0%), Utilities (100.0%), and Information (100.0%).
| Industry | Male | Female |
| Agriculture, Fishing & Hunting | 0 (0.0%) | 0 (0.0%) |
| Mining, Quarrying, & Extraction | 0 (0.0%) | 0 (0.0%) |
| Construction | 33 (48.5%) | 35 (51.5%) |
| Manufacturing | 15 (100.0%) | 0 (0.0%) |
| Wholesale Trade | 0 (0.0%) | 16 (100.0%) |
| Retail Trade | 64 (68.1%) | 30 (31.9%) |
| Transportation & Warehousing | 85 (55.6%) | 68 (44.4%) |
| Utilities | 0 (0.0%) | 19 (100.0%) |
| Information | 0 (0.0%) | 18 (100.0%) |
| Finance & Insurance | 12 (32.4%) | 25 (67.6%) |
| Real Estate, Rental & Leasing | 0 (0.0%) | 13 (100.0%) |
| Professional & Scientific | 53 (89.8%) | 6 (10.2%) |
| Enterprise Management | 0 (0.0%) | 0 (0.0%) |
| Administrative & Support | 28 (23.5%) | 91 (76.5%) |
| Educational Services | 42 (79.2%) | 11 (20.7%) |
| Health Care & Social Assistance | 34 (18.8%) | 147 (81.2%) |
| Arts, Entertainment & Recreation | 5 (41.7%) | 7 (58.3%) |
| Accommodation & Food Services | 110 (65.9%) | 57 (34.1%) |
| Public Administration | 0 (0.0%) | 18 (100.0%) |
| Total | 509 (47.6%) | 561 (52.4%) |
Education in Fairmont
School Enrollment in Fairmont
The most common levels of schooling among the 842 students in Fairmont are high school (219 | 26.0%), elementary school (212 | 25.2%), and middle school (169 | 20.1%).
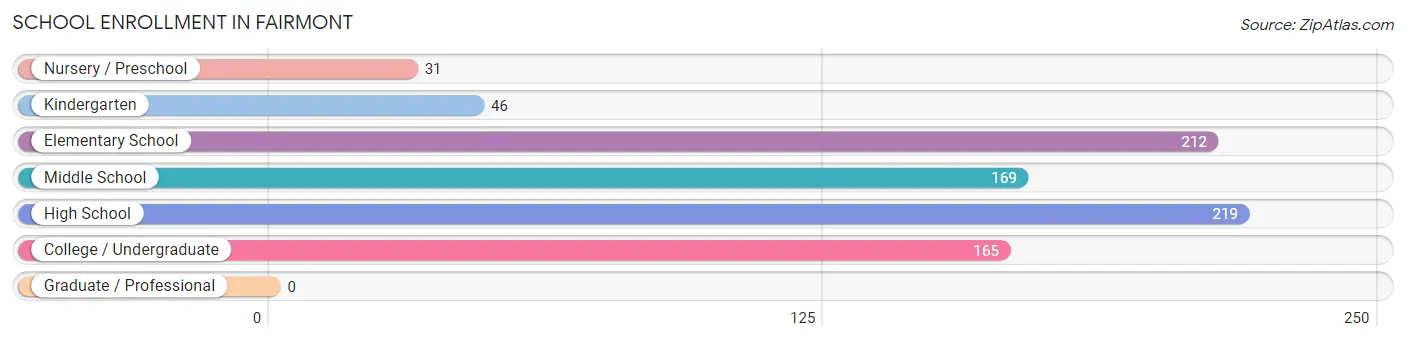
| School Level | # Students | % Students |
| Nursery / Preschool | 31 | 3.7% |
| Kindergarten | 46 | 5.5% |
| Elementary School | 212 | 25.2% |
| Middle School | 169 | 20.1% |
| High School | 219 | 26.0% |
| College / Undergraduate | 165 | 19.6% |
| Graduate / Professional | 0 | 0.0% |
| Total | 842 | 100.0% |
School Enrollment by Age by Funding Source in Fairmont
Out of a total of 842 students who are enrolled in schools in Fairmont, 126 (15.0%) attend a private institution, while the remaining 716 (85.0%) are enrolled in public schools. The age group of 20 to 24 year olds has the highest likelihood of being enrolled in private schools, with 6 (100.0% in the age bracket) enrolled. Conversely, the age group of 3 to 4 year olds has the lowest likelihood of being enrolled in a private school, with 18 (100.0% in the age bracket) attending a public institution.
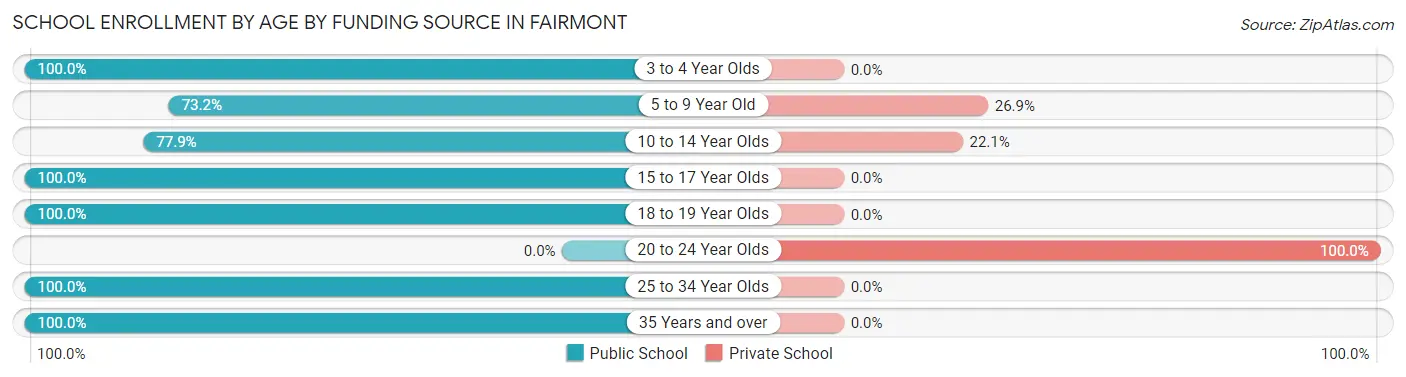
| Age Bracket | Public School | Private School |
| 3 to 4 Year Olds | 18 (100.0%) | 0 (0.0%) |
| 5 to 9 Year Old | 158 (73.2%) | 58 (26.9%) |
| 10 to 14 Year Olds | 218 (77.9%) | 62 (22.1%) |
| 15 to 17 Year Olds | 124 (100.0%) | 0 (0.0%) |
| 18 to 19 Year Olds | 62 (100.0%) | 0 (0.0%) |
| 20 to 24 Year Olds | 0 (0.0%) | 6 (100.0%) |
| 25 to 34 Year Olds | 123 (100.0%) | 0 (0.0%) |
| 35 Years and over | 13 (100.0%) | 0 (0.0%) |
| Total | 716 (85.0%) | 126 (15.0%) |
Educational Attainment by Field of Study in Fairmont
Business (63 | 24.7%), computers & mathematics (54 | 21.2%), education (51 | 20.0%), communications (21 | 8.2%), and arts & humanities (16 | 6.3%) are the most common fields of study among 255 individuals in Fairmont who have obtained a bachelor's degree or higher.
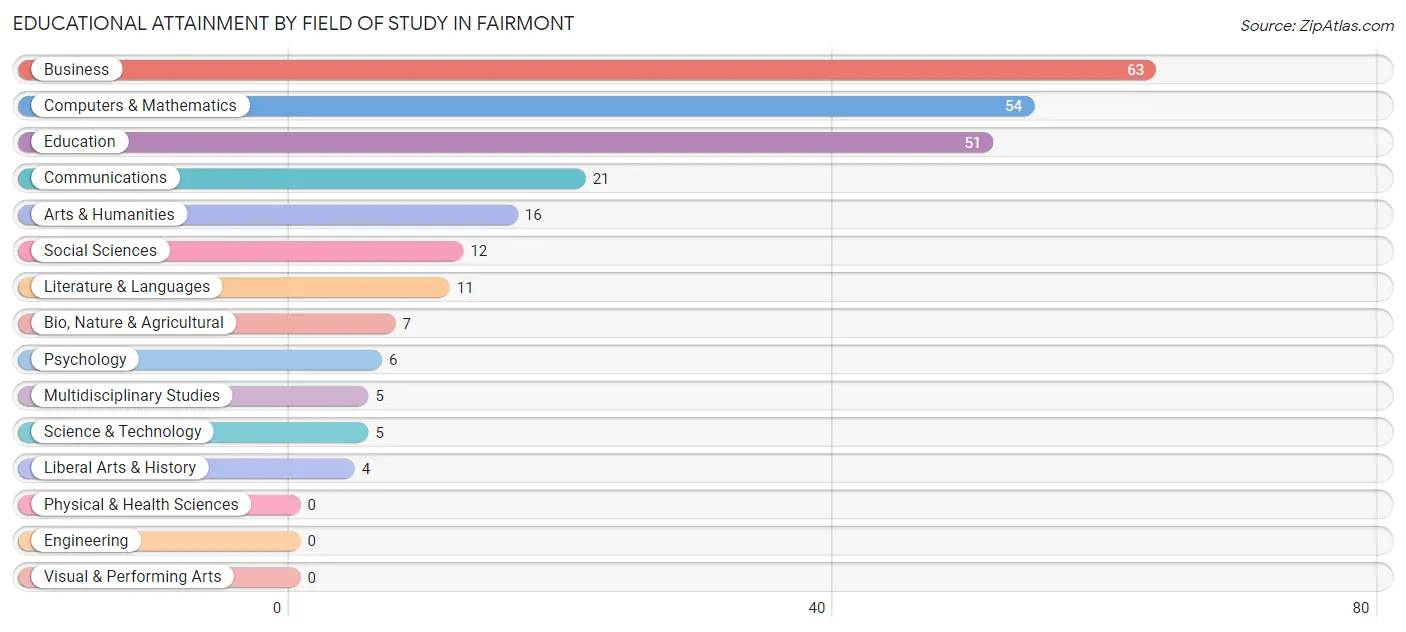
| Field of Study | # Graduates | % Graduates |
| Computers & Mathematics | 54 | 21.2% |
| Bio, Nature & Agricultural | 7 | 2.8% |
| Physical & Health Sciences | 0 | 0.0% |
| Psychology | 6 | 2.4% |
| Social Sciences | 12 | 4.7% |
| Engineering | 0 | 0.0% |
| Multidisciplinary Studies | 5 | 2.0% |
| Science & Technology | 5 | 2.0% |
| Business | 63 | 24.7% |
| Education | 51 | 20.0% |
| Literature & Languages | 11 | 4.3% |
| Liberal Arts & History | 4 | 1.6% |
| Visual & Performing Arts | 0 | 0.0% |
| Communications | 21 | 8.2% |
| Arts & Humanities | 16 | 6.3% |
| Total | 255 | 100.0% |
Transportation & Commute in Fairmont
Vehicle Availability by Sex in Fairmont
The most prevalent vehicle ownership categories in Fairmont are males with 1 vehicle (173, accounting for 35.5%) and females with 1 vehicle (303, making up 30.9%).
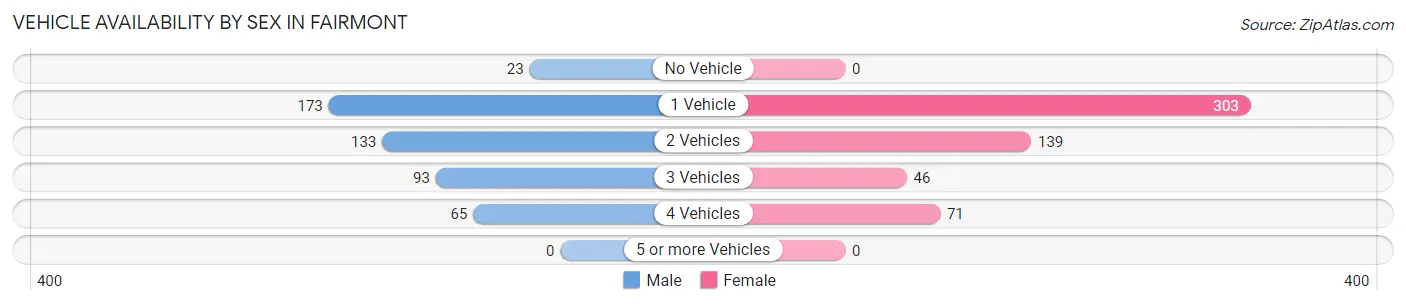
| Vehicles Available | Male | Female |
| No Vehicle | 23 (4.7%) | 0 (0.0%) |
| 1 Vehicle | 173 (35.5%) | 303 (54.2%) |
| 2 Vehicles | 133 (27.3%) | 139 (24.9%) |
| 3 Vehicles | 93 (19.1%) | 46 (8.2%) |
| 4 Vehicles | 65 (13.4%) | 71 (12.7%) |
| 5 or more Vehicles | 0 (0.0%) | 0 (0.0%) |
| Total | 487 (100.0%) | 559 (100.0%) |
Commute Time in Fairmont
The most frequently occuring commute durations in Fairmont are 20 to 24 minutes (211 commuters, 20.8%), 10 to 14 minutes (205 commuters, 20.3%), and 15 to 19 minutes (137 commuters, 13.5%).
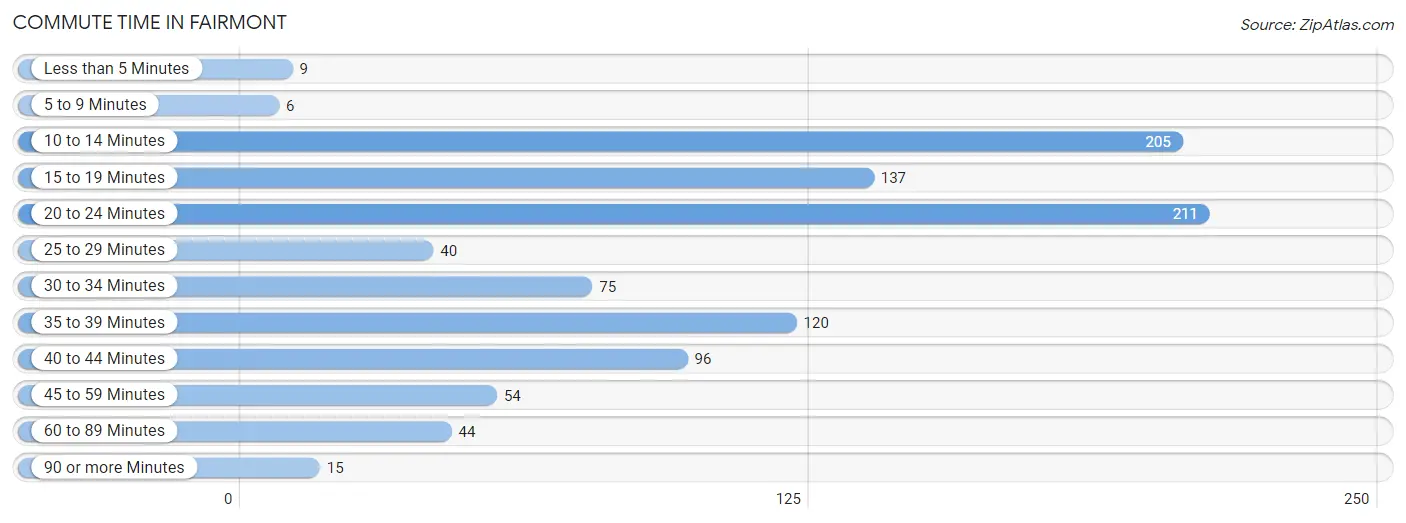
| Commute Time | # Commuters | % Commuters |
| Less than 5 Minutes | 9 | 0.9% |
| 5 to 9 Minutes | 6 | 0.6% |
| 10 to 14 Minutes | 205 | 20.3% |
| 15 to 19 Minutes | 137 | 13.5% |
| 20 to 24 Minutes | 211 | 20.8% |
| 25 to 29 Minutes | 40 | 4.0% |
| 30 to 34 Minutes | 75 | 7.4% |
| 35 to 39 Minutes | 120 | 11.9% |
| 40 to 44 Minutes | 96 | 9.5% |
| 45 to 59 Minutes | 54 | 5.3% |
| 60 to 89 Minutes | 44 | 4.3% |
| 90 or more Minutes | 15 | 1.5% |
Commute Time by Sex in Fairmont
The most common commute times in Fairmont are 10 to 14 minutes (126 commuters, 27.2%) for males and 20 to 24 minutes (111 commuters, 20.3%) for females.
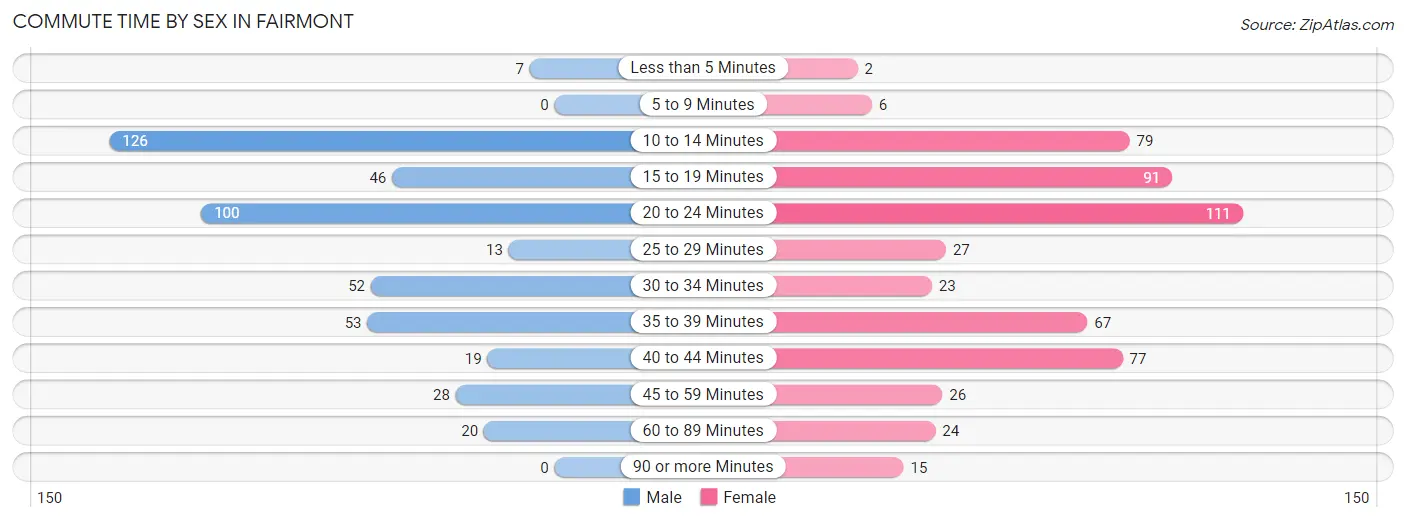
| Commute Time | Male | Female |
| Less than 5 Minutes | 7 (1.5%) | 2 (0.4%) |
| 5 to 9 Minutes | 0 (0.0%) | 6 (1.1%) |
| 10 to 14 Minutes | 126 (27.2%) | 79 (14.4%) |
| 15 to 19 Minutes | 46 (9.9%) | 91 (16.6%) |
| 20 to 24 Minutes | 100 (21.5%) | 111 (20.3%) |
| 25 to 29 Minutes | 13 (2.8%) | 27 (4.9%) |
| 30 to 34 Minutes | 52 (11.2%) | 23 (4.2%) |
| 35 to 39 Minutes | 53 (11.4%) | 67 (12.2%) |
| 40 to 44 Minutes | 19 (4.1%) | 77 (14.1%) |
| 45 to 59 Minutes | 28 (6.0%) | 26 (4.7%) |
| 60 to 89 Minutes | 20 (4.3%) | 24 (4.4%) |
| 90 or more Minutes | 0 (0.0%) | 15 (2.7%) |
Time of Departure to Work by Sex in Fairmont
The most frequent times of departure to work in Fairmont are 5:30 AM to 5:59 AM (93, 20.0%) for males and 6:00 AM to 6:29 AM (159, 29.0%) for females.
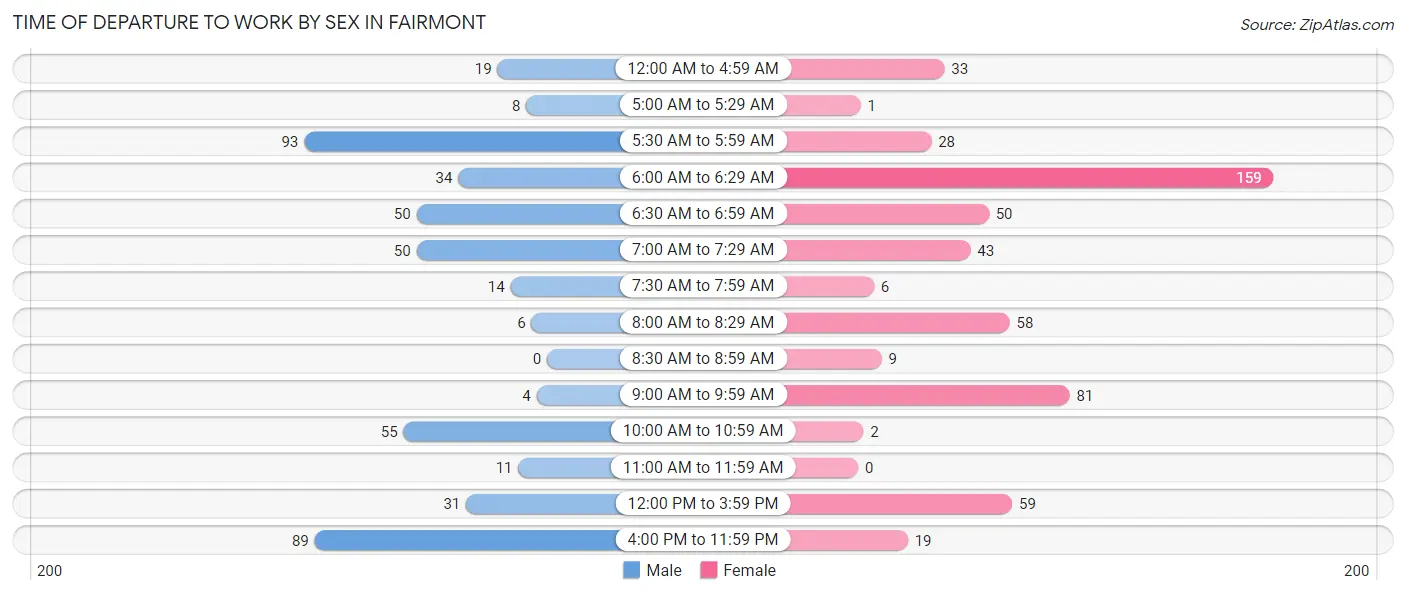
| Time of Departure | Male | Female |
| 12:00 AM to 4:59 AM | 19 (4.1%) | 33 (6.0%) |
| 5:00 AM to 5:29 AM | 8 (1.7%) | 1 (0.2%) |
| 5:30 AM to 5:59 AM | 93 (20.0%) | 28 (5.1%) |
| 6:00 AM to 6:29 AM | 34 (7.3%) | 159 (29.0%) |
| 6:30 AM to 6:59 AM | 50 (10.8%) | 50 (9.1%) |
| 7:00 AM to 7:29 AM | 50 (10.8%) | 43 (7.9%) |
| 7:30 AM to 7:59 AM | 14 (3.0%) | 6 (1.1%) |
| 8:00 AM to 8:29 AM | 6 (1.3%) | 58 (10.6%) |
| 8:30 AM to 8:59 AM | 0 (0.0%) | 9 (1.6%) |
| 9:00 AM to 9:59 AM | 4 (0.9%) | 81 (14.8%) |
| 10:00 AM to 10:59 AM | 55 (11.8%) | 2 (0.4%) |
| 11:00 AM to 11:59 AM | 11 (2.4%) | 0 (0.0%) |
| 12:00 PM to 3:59 PM | 31 (6.7%) | 59 (10.8%) |
| 4:00 PM to 11:59 PM | 89 (19.2%) | 19 (3.5%) |
| Total | 464 (100.0%) | 548 (100.0%) |
Housing Occupancy in Fairmont
Occupancy by Ownership in Fairmont
Of the total 767 dwellings in Fairmont, owner-occupied units account for 447 (58.3%), while renter-occupied units make up 320 (41.7%).
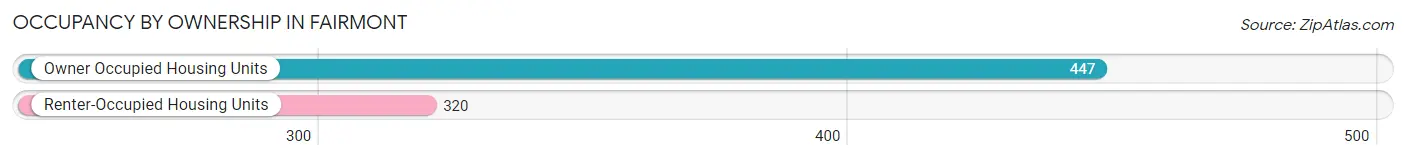
| Occupancy | # Housing Units | % Housing Units |
| Owner Occupied Housing Units | 447 | 58.3% |
| Renter-Occupied Housing Units | 320 | 41.7% |
| Total Occupied Housing Units | 767 | 100.0% |
Occupancy by Household Size in Fairmont
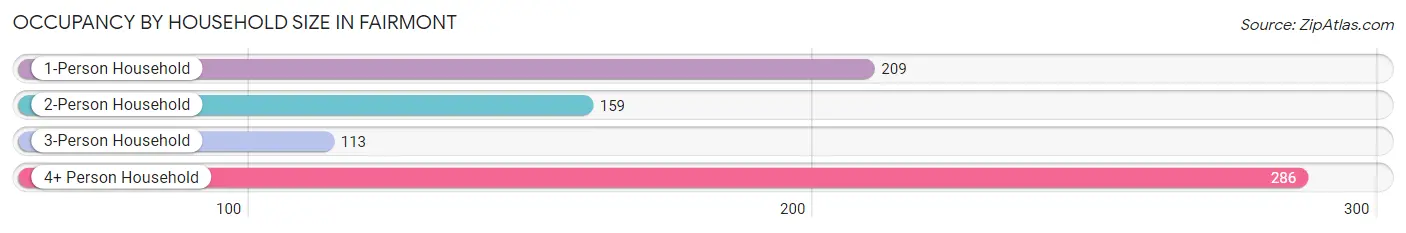
| Household Size | # Housing Units | % Housing Units |
| 1-Person Household | 209 | 27.3% |
| 2-Person Household | 159 | 20.7% |
| 3-Person Household | 113 | 14.7% |
| 4+ Person Household | 286 | 37.3% |
| Total Housing Units | 767 | 100.0% |
Occupancy by Ownership by Household Size in Fairmont
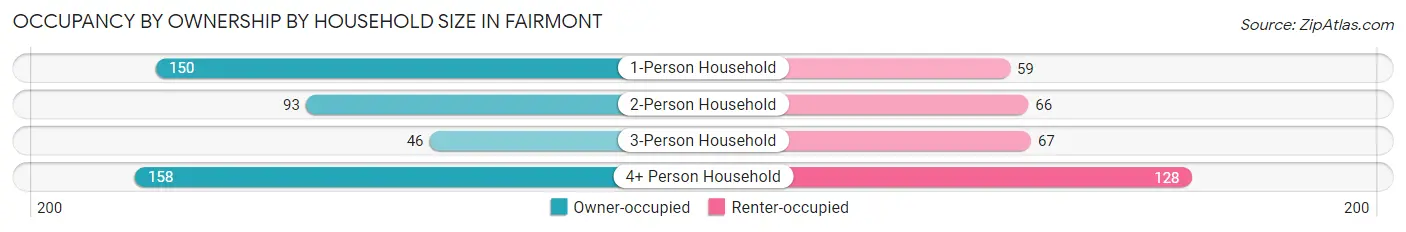
| Household Size | Owner-occupied | Renter-occupied |
| 1-Person Household | 150 (71.8%) | 59 (28.2%) |
| 2-Person Household | 93 (58.5%) | 66 (41.5%) |
| 3-Person Household | 46 (40.7%) | 67 (59.3%) |
| 4+ Person Household | 158 (55.2%) | 128 (44.8%) |
| Total Housing Units | 447 (58.3%) | 320 (41.7%) |
Occupancy by Educational Attainment in Fairmont
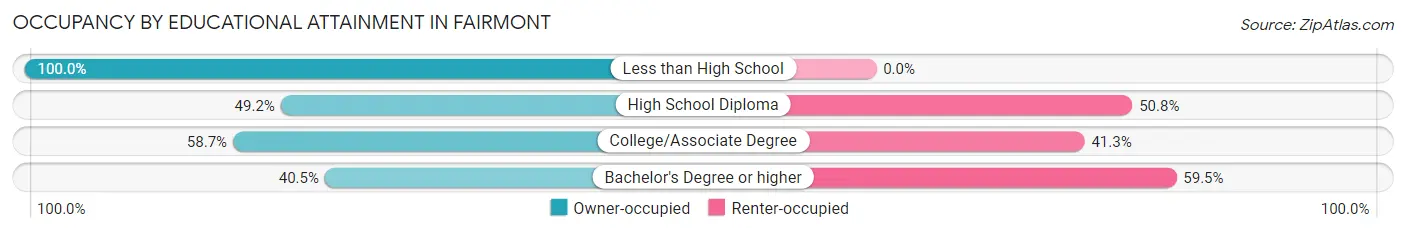
| Household Size | Owner-occupied | Renter-occupied |
| Less than High School | 111 (100.0%) | 0 (0.0%) |
| High School Diploma | 96 (49.2%) | 99 (50.8%) |
| College/Associate Degree | 172 (58.7%) | 121 (41.3%) |
| Bachelor's Degree or higher | 68 (40.5%) | 100 (59.5%) |
Occupancy by Age of Householder in Fairmont
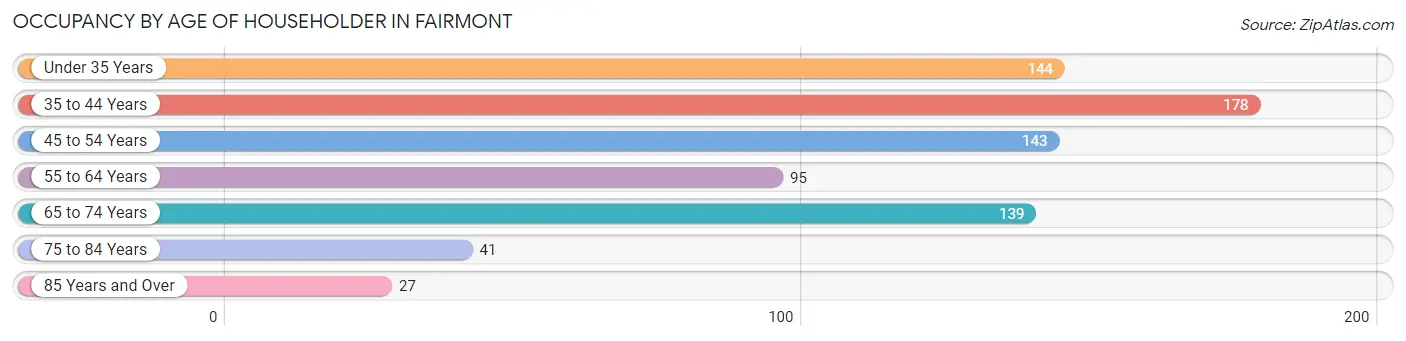
| Age Bracket | # Households | % Households |
| Under 35 Years | 144 | 18.8% |
| 35 to 44 Years | 178 | 23.2% |
| 45 to 54 Years | 143 | 18.6% |
| 55 to 64 Years | 95 | 12.4% |
| 65 to 74 Years | 139 | 18.1% |
| 75 to 84 Years | 41 | 5.3% |
| 85 Years and Over | 27 | 3.5% |
| Total | 767 | 100.0% |
Housing Finances in Fairmont
Median Income by Occupancy in Fairmont
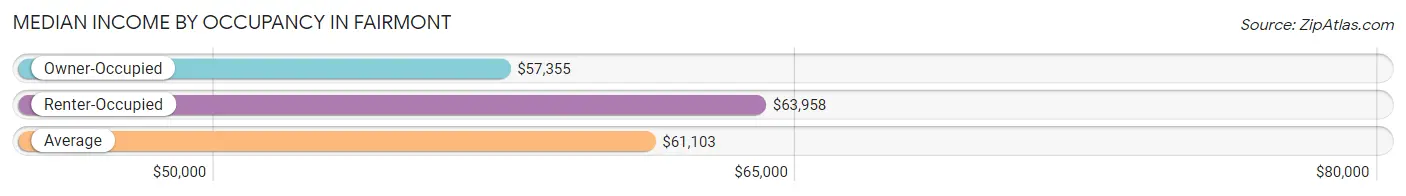
| Occupancy Type | # Households | Median Income |
| Owner-Occupied | 447 (58.3%) | $57,355 |
| Renter-Occupied | 320 (41.7%) | $63,958 |
| Average | 767 (100.0%) | $61,103 |
Occupancy by Householder Income Bracket in Fairmont
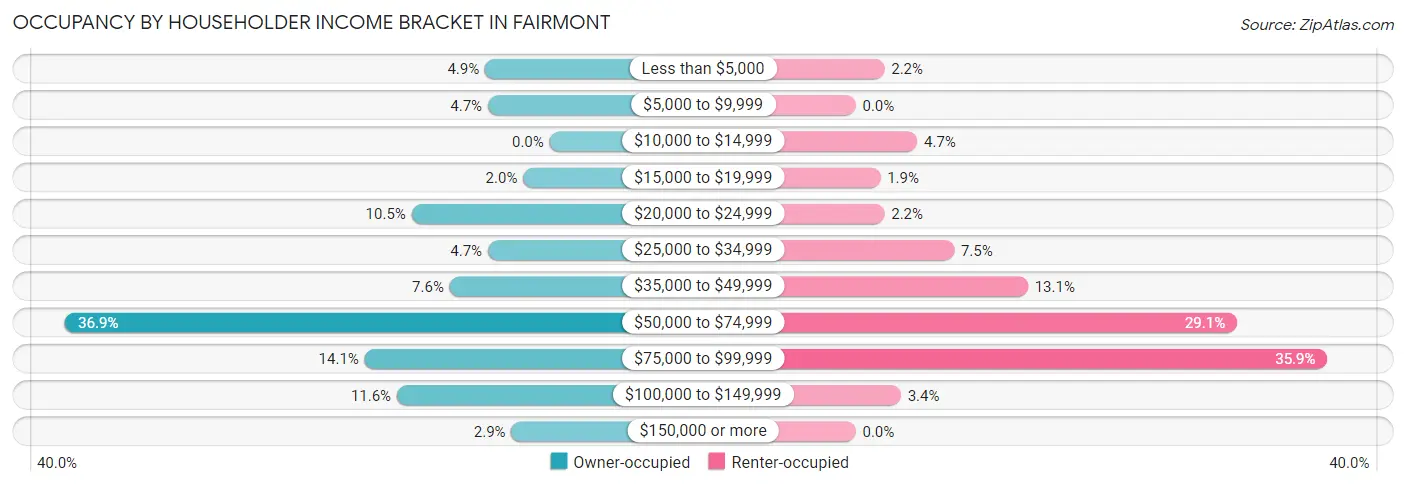
| Income Bracket | Owner-occupied | Renter-occupied |
| Less than $5,000 | 22 (4.9%) | 7 (2.2%) |
| $5,000 to $9,999 | 21 (4.7%) | 0 (0.0%) |
| $10,000 to $14,999 | 0 (0.0%) | 15 (4.7%) |
| $15,000 to $19,999 | 9 (2.0%) | 6 (1.9%) |
| $20,000 to $24,999 | 47 (10.5%) | 7 (2.2%) |
| $25,000 to $34,999 | 21 (4.7%) | 24 (7.5%) |
| $35,000 to $49,999 | 34 (7.6%) | 42 (13.1%) |
| $50,000 to $74,999 | 165 (36.9%) | 93 (29.1%) |
| $75,000 to $99,999 | 63 (14.1%) | 115 (35.9%) |
| $100,000 to $149,999 | 52 (11.6%) | 11 (3.4%) |
| $150,000 or more | 13 (2.9%) | 0 (0.0%) |
| Total | 447 (100.0%) | 320 (100.0%) |
Monthly Housing Cost Tiers in Fairmont
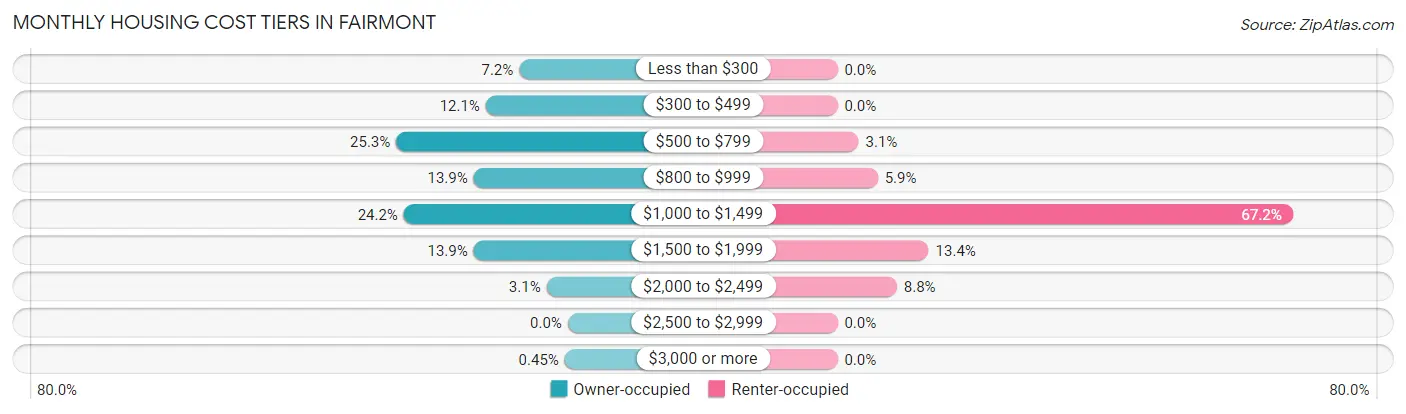
| Monthly Cost | Owner-occupied | Renter-occupied |
| Less than $300 | 32 (7.2%) | 0 (0.0%) |
| $300 to $499 | 54 (12.1%) | 0 (0.0%) |
| $500 to $799 | 113 (25.3%) | 10 (3.1%) |
| $800 to $999 | 62 (13.9%) | 19 (5.9%) |
| $1,000 to $1,499 | 108 (24.2%) | 215 (67.2%) |
| $1,500 to $1,999 | 62 (13.9%) | 43 (13.4%) |
| $2,000 to $2,499 | 14 (3.1%) | 28 (8.7%) |
| $2,500 to $2,999 | 0 (0.0%) | 0 (0.0%) |
| $3,000 or more | 2 (0.4%) | 0 (0.0%) |
| Total | 447 (100.0%) | 320 (100.0%) |
Physical Housing Characteristics in Fairmont
Housing Structures in Fairmont
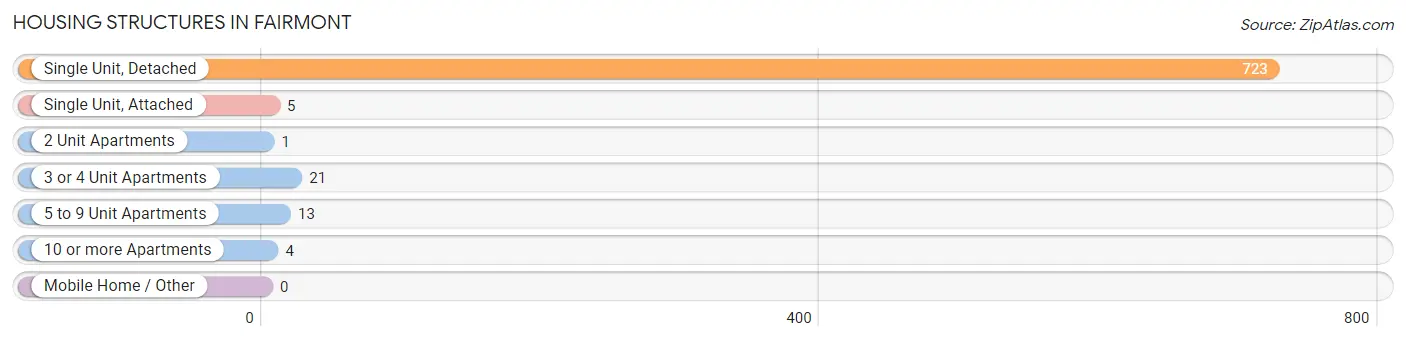
| Structure Type | # Housing Units | % Housing Units |
| Single Unit, Detached | 723 | 94.3% |
| Single Unit, Attached | 5 | 0.6% |
| 2 Unit Apartments | 1 | 0.1% |
| 3 or 4 Unit Apartments | 21 | 2.7% |
| 5 to 9 Unit Apartments | 13 | 1.7% |
| 10 or more Apartments | 4 | 0.5% |
| Mobile Home / Other | 0 | 0.0% |
| Total | 767 | 100.0% |
Housing Structures by Occupancy in Fairmont
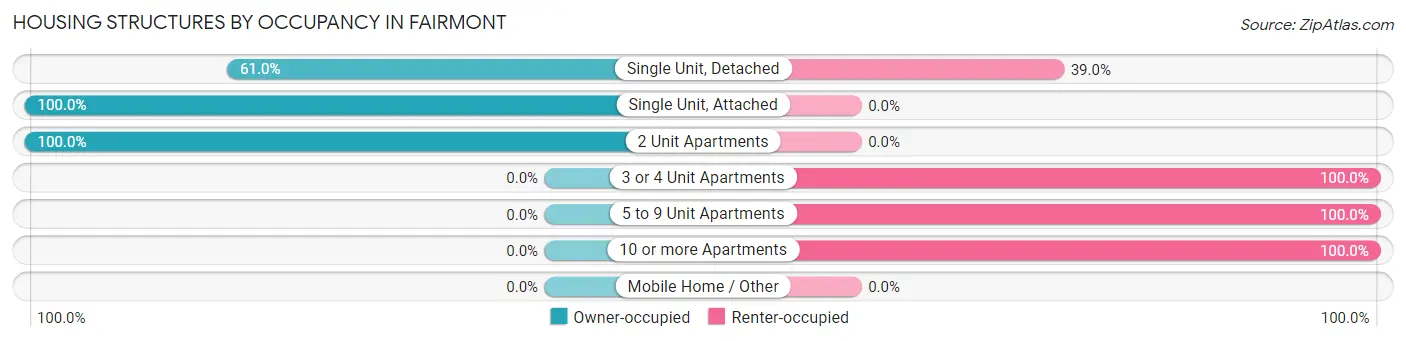
| Structure Type | Owner-occupied | Renter-occupied |
| Single Unit, Detached | 441 (61.0%) | 282 (39.0%) |
| Single Unit, Attached | 5 (100.0%) | 0 (0.0%) |
| 2 Unit Apartments | 1 (100.0%) | 0 (0.0%) |
| 3 or 4 Unit Apartments | 0 (0.0%) | 21 (100.0%) |
| 5 to 9 Unit Apartments | 0 (0.0%) | 13 (100.0%) |
| 10 or more Apartments | 0 (0.0%) | 4 (100.0%) |
| Mobile Home / Other | 0 (0.0%) | 0 (0.0%) |
| Total | 447 (58.3%) | 320 (41.7%) |
Housing Structures by Number of Rooms in Fairmont
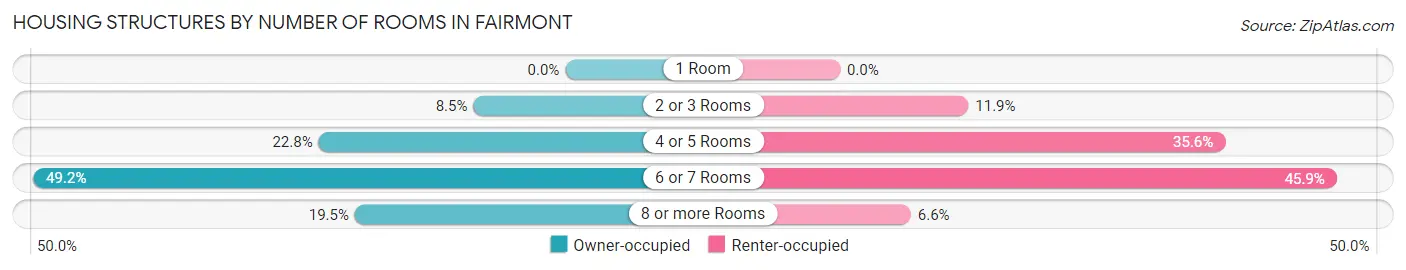
| Number of Rooms | Owner-occupied | Renter-occupied |
| 1 Room | 0 (0.0%) | 0 (0.0%) |
| 2 or 3 Rooms | 38 (8.5%) | 38 (11.9%) |
| 4 or 5 Rooms | 102 (22.8%) | 114 (35.6%) |
| 6 or 7 Rooms | 220 (49.2%) | 147 (45.9%) |
| 8 or more Rooms | 87 (19.5%) | 21 (6.6%) |
| Total | 447 (100.0%) | 320 (100.0%) |
Housing Structure by Heating Type in Fairmont
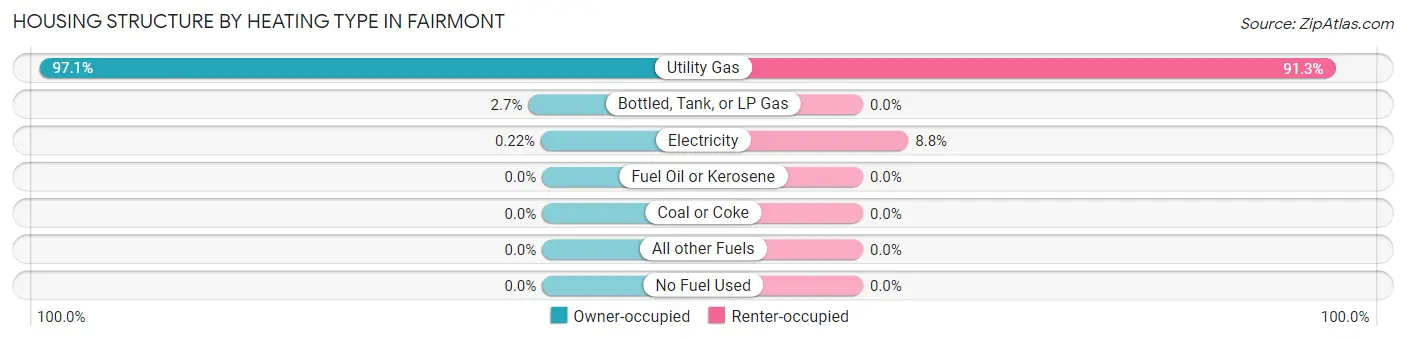
| Heating Type | Owner-occupied | Renter-occupied |
| Utility Gas | 434 (97.1%) | 292 (91.2%) |
| Bottled, Tank, or LP Gas | 12 (2.7%) | 0 (0.0%) |
| Electricity | 1 (0.2%) | 28 (8.7%) |
| Fuel Oil or Kerosene | 0 (0.0%) | 0 (0.0%) |
| Coal or Coke | 0 (0.0%) | 0 (0.0%) |
| All other Fuels | 0 (0.0%) | 0 (0.0%) |
| No Fuel Used | 0 (0.0%) | 0 (0.0%) |
| Total | 447 (100.0%) | 320 (100.0%) |
Household Vehicle Usage in Fairmont
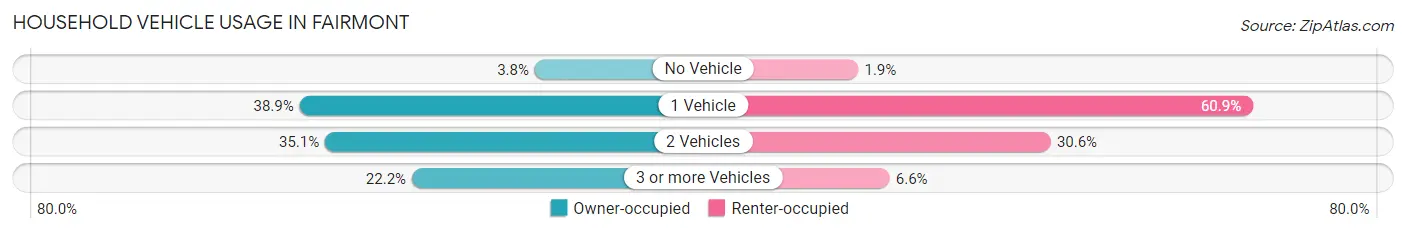
| Vehicles per Household | Owner-occupied | Renter-occupied |
| No Vehicle | 17 (3.8%) | 6 (1.9%) |
| 1 Vehicle | 174 (38.9%) | 195 (60.9%) |
| 2 Vehicles | 157 (35.1%) | 98 (30.6%) |
| 3 or more Vehicles | 99 (22.2%) | 21 (6.6%) |
| Total | 447 (100.0%) | 320 (100.0%) |
Real Estate & Mortgages in Fairmont
Real Estate and Mortgage Overview in Fairmont
| Characteristic | Without Mortgage | With Mortgage |
| Housing Units | 204 | 243 |
| Median Property Value | $122,900 | $156,400 |
| Median Household Income | $56,400 | $7 |
| Monthly Housing Costs | $522 | $2 |
| Real Estate Taxes | $1,792 | $0 |
Property Value by Mortgage Status in Fairmont
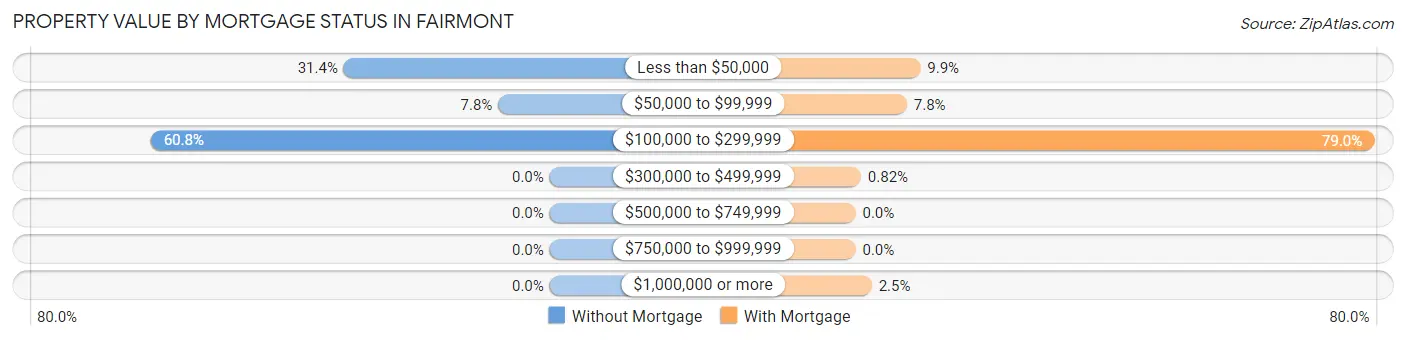
| Property Value | Without Mortgage | With Mortgage |
| Less than $50,000 | 64 (31.4%) | 24 (9.9%) |
| $50,000 to $99,999 | 16 (7.8%) | 19 (7.8%) |
| $100,000 to $299,999 | 124 (60.8%) | 192 (79.0%) |
| $300,000 to $499,999 | 0 (0.0%) | 2 (0.8%) |
| $500,000 to $749,999 | 0 (0.0%) | 0 (0.0%) |
| $750,000 to $999,999 | 0 (0.0%) | 0 (0.0%) |
| $1,000,000 or more | 0 (0.0%) | 6 (2.5%) |
| Total | 204 (100.0%) | 243 (100.0%) |
Household Income by Mortgage Status in Fairmont
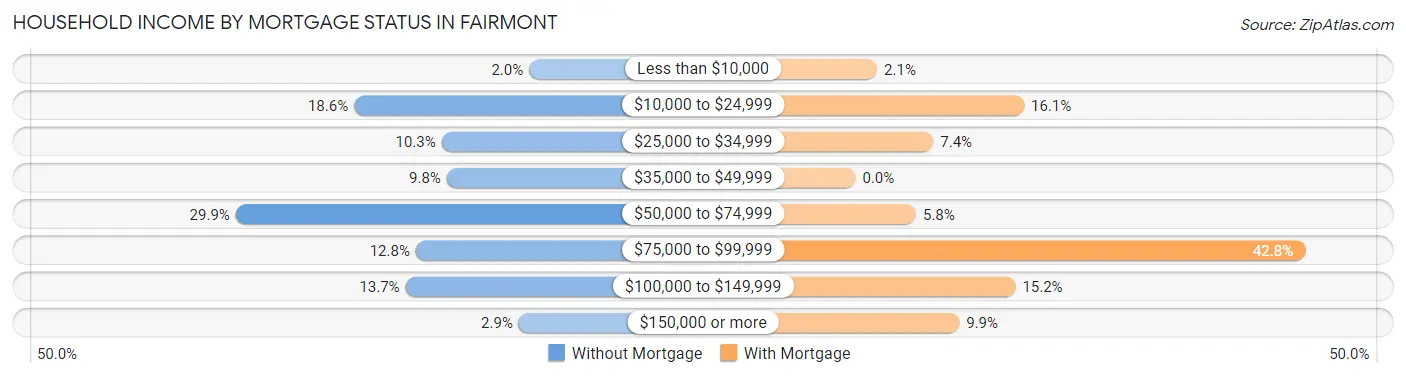
| Household Income | Without Mortgage | With Mortgage |
| Less than $10,000 | 4 (2.0%) | 5 (2.1%) |
| $10,000 to $24,999 | 38 (18.6%) | 39 (16.1%) |
| $25,000 to $34,999 | 21 (10.3%) | 18 (7.4%) |
| $35,000 to $49,999 | 20 (9.8%) | 0 (0.0%) |
| $50,000 to $74,999 | 61 (29.9%) | 14 (5.8%) |
| $75,000 to $99,999 | 26 (12.8%) | 104 (42.8%) |
| $100,000 to $149,999 | 28 (13.7%) | 37 (15.2%) |
| $150,000 or more | 6 (2.9%) | 24 (9.9%) |
| Total | 204 (100.0%) | 243 (100.0%) |
Property Value to Household Income Ratio in Fairmont
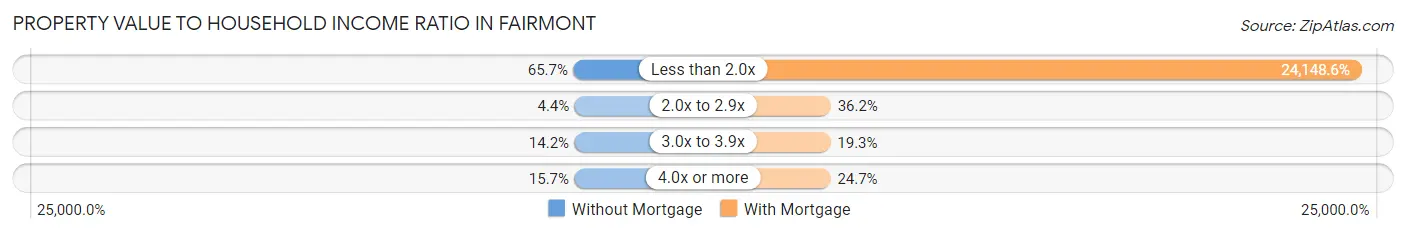
| Value-to-Income Ratio | Without Mortgage | With Mortgage |
| Less than 2.0x | 134 (65.7%) | 58,681 (24,148.6%) |
| 2.0x to 2.9x | 9 (4.4%) | 88 (36.2%) |
| 3.0x to 3.9x | 29 (14.2%) | 47 (19.3%) |
| 4.0x or more | 32 (15.7%) | 60 (24.7%) |
| Total | 204 (100.0%) | 243 (100.0%) |
Real Estate Taxes by Mortgage Status in Fairmont
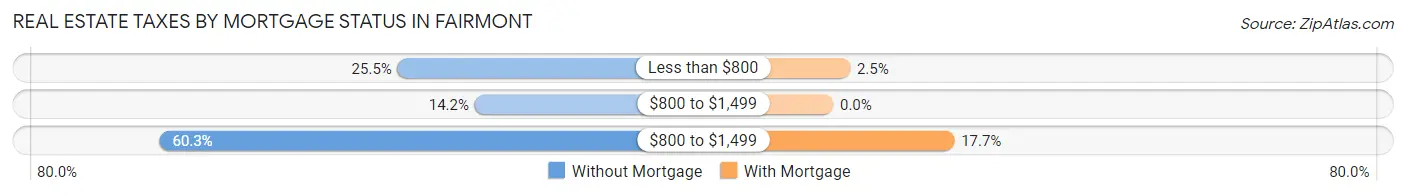
| Property Taxes | Without Mortgage | With Mortgage |
| Less than $800 | 52 (25.5%) | 6 (2.5%) |
| $800 to $1,499 | 29 (14.2%) | 0 (0.0%) |
| $800 to $1,499 | 123 (60.3%) | 43 (17.7%) |
| Total | 204 (100.0%) | 243 (100.0%) |
Health & Disability in Fairmont
Health Insurance Coverage by Age in Fairmont
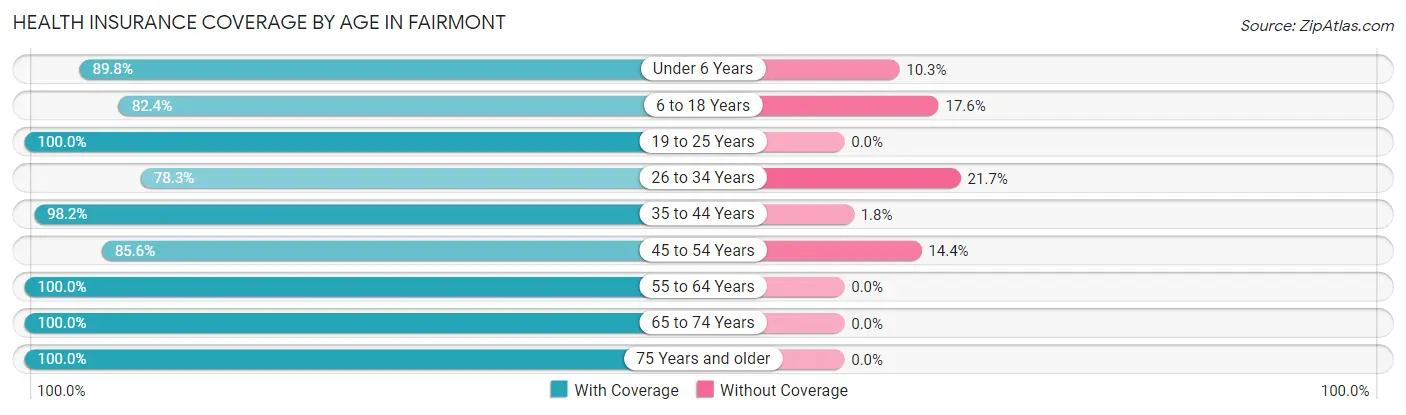
| Age Bracket | With Coverage | Without Coverage |
| Under 6 Years | 219 (89.7%) | 25 (10.2%) |
| 6 to 18 Years | 610 (82.4%) | 130 (17.6%) |
| 19 to 25 Years | 96 (100.0%) | 0 (0.0%) |
| 26 to 34 Years | 368 (78.3%) | 102 (21.7%) |
| 35 to 44 Years | 279 (98.2%) | 5 (1.8%) |
| 45 to 54 Years | 244 (85.6%) | 41 (14.4%) |
| 55 to 64 Years | 158 (100.0%) | 0 (0.0%) |
| 65 to 74 Years | 212 (100.0%) | 0 (0.0%) |
| 75 Years and older | 106 (100.0%) | 0 (0.0%) |
| Total | 2,292 (88.3%) | 303 (11.7%) |
Health Insurance Coverage by Citizenship Status in Fairmont
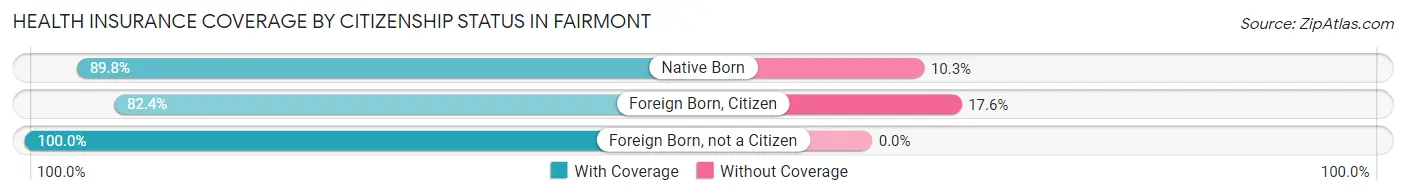
| Citizenship Status | With Coverage | Without Coverage |
| Native Born | 219 (89.7%) | 25 (10.2%) |
| Foreign Born, Citizen | 610 (82.4%) | 130 (17.6%) |
| Foreign Born, not a Citizen | 96 (100.0%) | 0 (0.0%) |
Health Insurance Coverage by Household Income in Fairmont
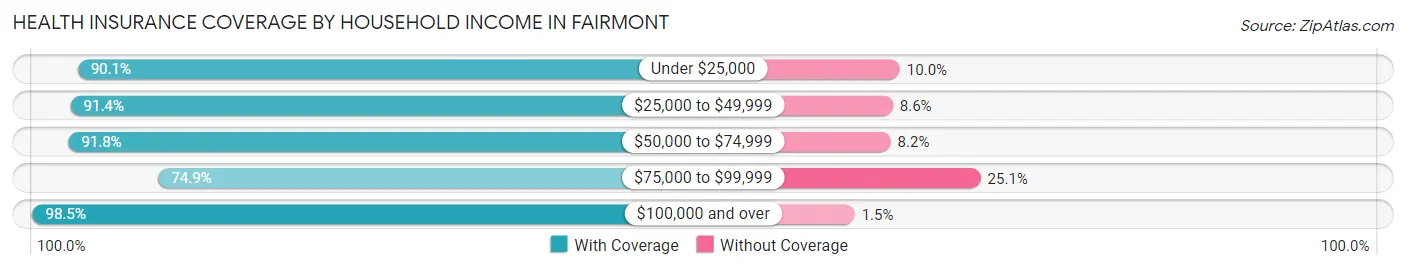
| Household Income | With Coverage | Without Coverage |
| Under $25,000 | 398 (90.0%) | 44 (10.0%) |
| $25,000 to $49,999 | 233 (91.4%) | 22 (8.6%) |
| $50,000 to $74,999 | 837 (91.8%) | 75 (8.2%) |
| $75,000 to $99,999 | 469 (74.9%) | 157 (25.1%) |
| $100,000 and over | 330 (98.5%) | 5 (1.5%) |
Public vs Private Health Insurance Coverage by Age in Fairmont
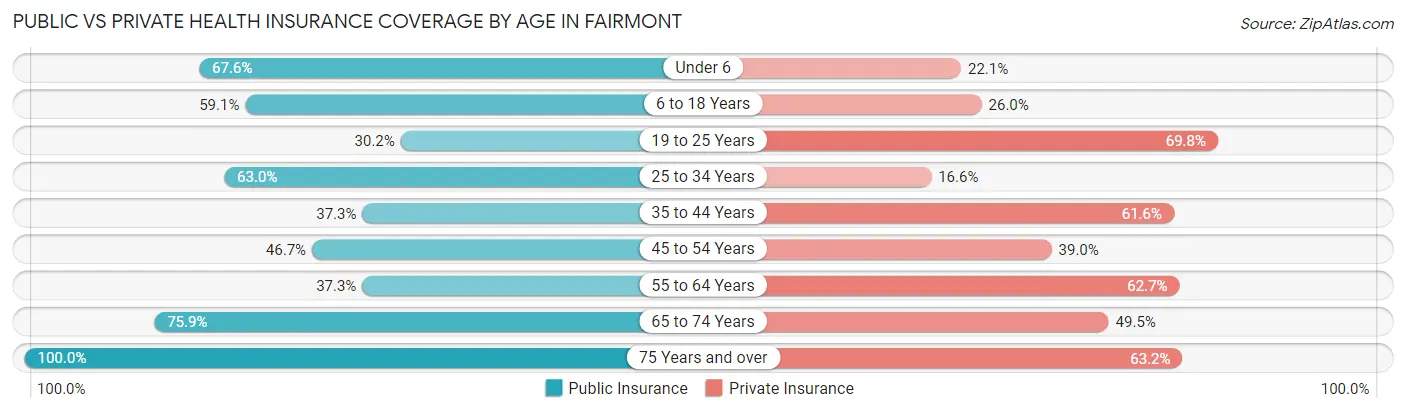
| Age Bracket | Public Insurance | Private Insurance |
| Under 6 | 165 (67.6%) | 54 (22.1%) |
| 6 to 18 Years | 437 (59.1%) | 192 (26.0%) |
| 19 to 25 Years | 29 (30.2%) | 67 (69.8%) |
| 25 to 34 Years | 296 (63.0%) | 78 (16.6%) |
| 35 to 44 Years | 106 (37.3%) | 175 (61.6%) |
| 45 to 54 Years | 133 (46.7%) | 111 (39.0%) |
| 55 to 64 Years | 59 (37.3%) | 99 (62.7%) |
| 65 to 74 Years | 161 (75.9%) | 105 (49.5%) |
| 75 Years and over | 106 (100.0%) | 67 (63.2%) |
| Total | 1,492 (57.5%) | 948 (36.5%) |
Disability Status by Sex by Age in Fairmont
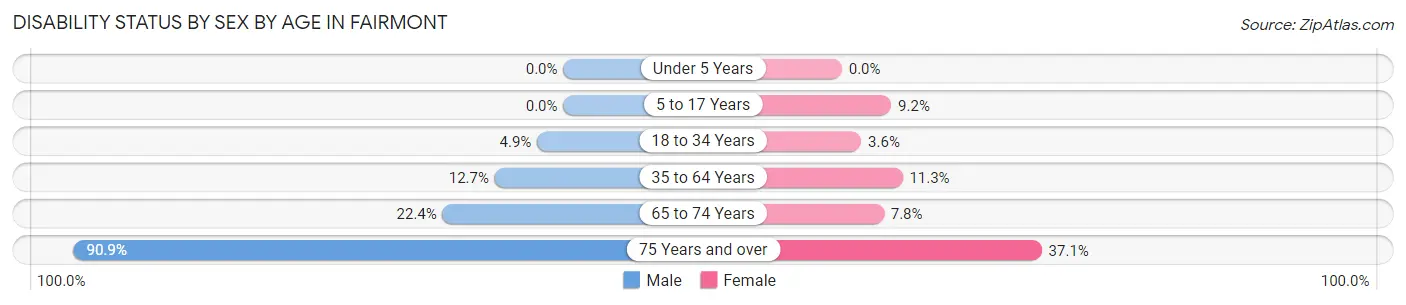
| Age Bracket | Male | Female |
| Under 5 Years | 0 (0.0%) | 0 (0.0%) |
| 5 to 17 Years | 0 (0.0%) | 35 (9.2%) |
| 18 to 34 Years | 18 (4.9%) | 11 (3.6%) |
| 35 to 64 Years | 36 (12.7%) | 50 (11.3%) |
| 65 to 74 Years | 13 (22.4%) | 12 (7.8%) |
| 75 Years and over | 40 (90.9%) | 23 (37.1%) |
Disability Class by Sex by Age in Fairmont
Disability Class: Hearing Difficulty
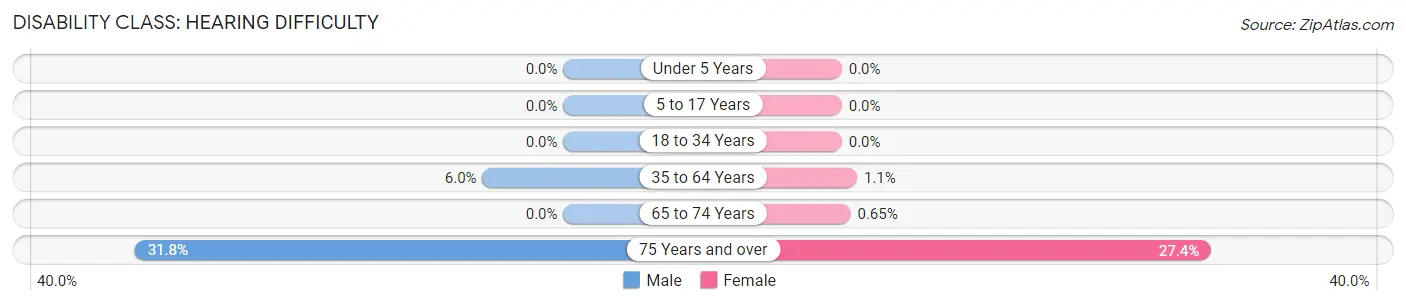
| Age Bracket | Male | Female |
| Under 5 Years | 0 (0.0%) | 0 (0.0%) |
| 5 to 17 Years | 0 (0.0%) | 0 (0.0%) |
| 18 to 34 Years | 0 (0.0%) | 0 (0.0%) |
| 35 to 64 Years | 17 (6.0%) | 5 (1.1%) |
| 65 to 74 Years | 0 (0.0%) | 1 (0.6%) |
| 75 Years and over | 14 (31.8%) | 17 (27.4%) |
Disability Class: Vision Difficulty
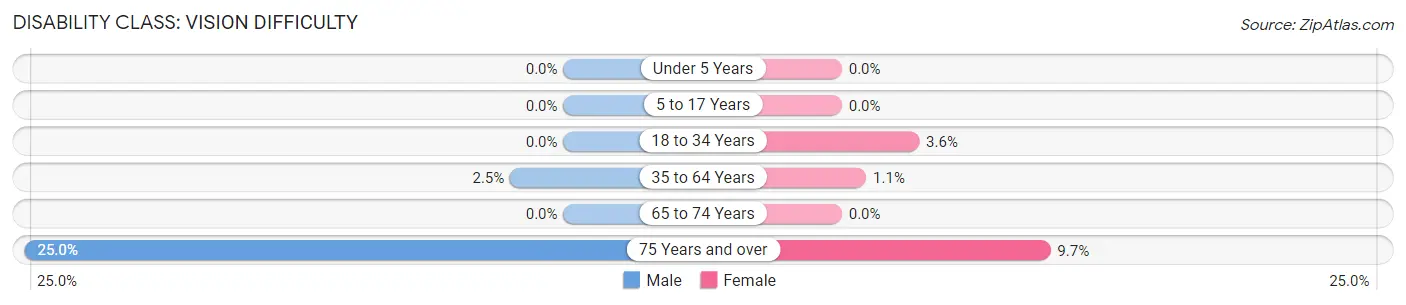
| Age Bracket | Male | Female |
| Under 5 Years | 0 (0.0%) | 0 (0.0%) |
| 5 to 17 Years | 0 (0.0%) | 0 (0.0%) |
| 18 to 34 Years | 0 (0.0%) | 11 (3.6%) |
| 35 to 64 Years | 7 (2.5%) | 5 (1.1%) |
| 65 to 74 Years | 0 (0.0%) | 0 (0.0%) |
| 75 Years and over | 11 (25.0%) | 6 (9.7%) |
Disability Class: Cognitive Difficulty
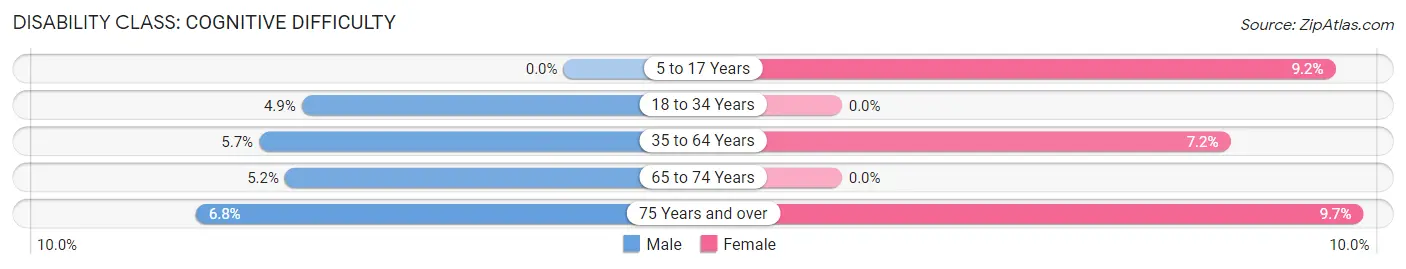
| Age Bracket | Male | Female |
| 5 to 17 Years | 0 (0.0%) | 35 (9.2%) |
| 18 to 34 Years | 18 (4.9%) | 0 (0.0%) |
| 35 to 64 Years | 16 (5.7%) | 32 (7.2%) |
| 65 to 74 Years | 3 (5.2%) | 0 (0.0%) |
| 75 Years and over | 3 (6.8%) | 6 (9.7%) |
Disability Class: Ambulatory Difficulty
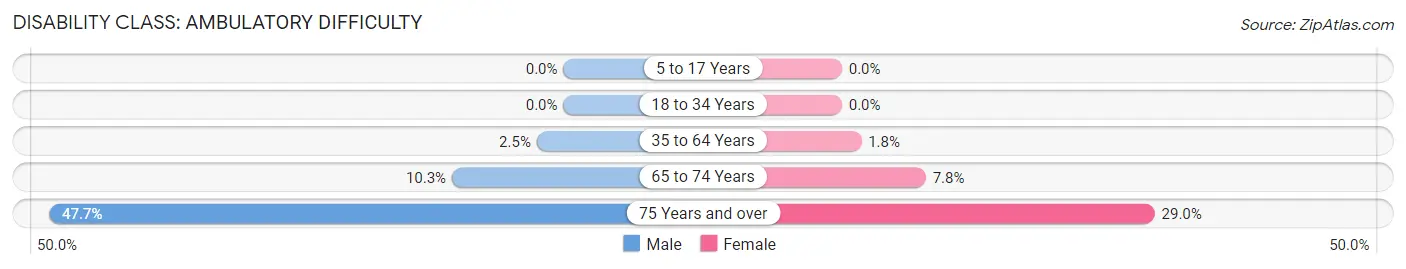
| Age Bracket | Male | Female |
| 5 to 17 Years | 0 (0.0%) | 0 (0.0%) |
| 18 to 34 Years | 0 (0.0%) | 0 (0.0%) |
| 35 to 64 Years | 7 (2.5%) | 8 (1.8%) |
| 65 to 74 Years | 6 (10.3%) | 12 (7.8%) |
| 75 Years and over | 21 (47.7%) | 18 (29.0%) |
Disability Class: Self-Care Difficulty
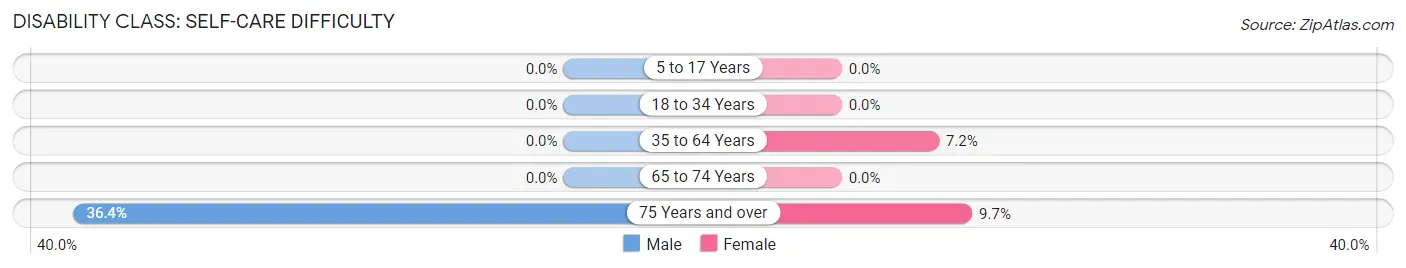
| Age Bracket | Male | Female |
| 5 to 17 Years | 0 (0.0%) | 0 (0.0%) |
| 18 to 34 Years | 0 (0.0%) | 0 (0.0%) |
| 35 to 64 Years | 0 (0.0%) | 32 (7.2%) |
| 65 to 74 Years | 0 (0.0%) | 0 (0.0%) |
| 75 Years and over | 16 (36.4%) | 6 (9.7%) |
Technology Access in Fairmont
Computing Device Access in Fairmont
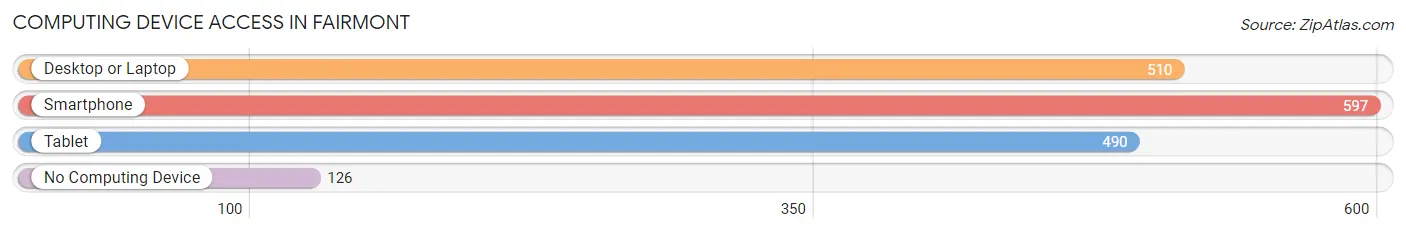
| Device Type | # Households | % Households |
| Desktop or Laptop | 510 | 66.5% |
| Smartphone | 597 | 77.8% |
| Tablet | 490 | 63.9% |
| No Computing Device | 126 | 16.4% |
| Total | 767 | 100.0% |
Internet Access in Fairmont
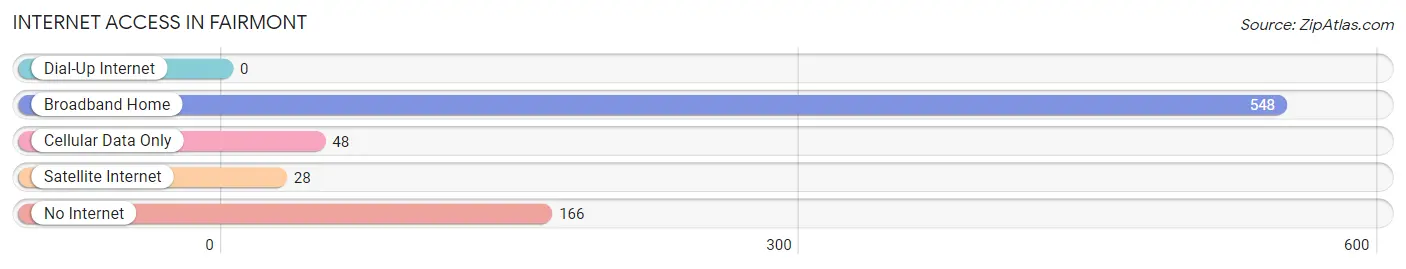
| Internet Type | # Households | % Households |
| Dial-Up Internet | 0 | 0.0% |
| Broadband Home | 548 | 71.5% |
| Cellular Data Only | 48 | 6.3% |
| Satellite Internet | 28 | 3.6% |
| No Internet | 166 | 21.6% |
| Total | 767 | 100.0% |
Fairmont Summary
History
The small town of Fairmont, Illinois is located in the northern part of the state, in the county of McHenry. It is situated on the banks of the Fox River, and is part of the Chicago metropolitan area. The town was first settled in 1836 by a group of settlers from New York, who were looking for a place to start a new life. The town was originally called Fairmount, but the name was changed to Fairmont in 1837.
The town was originally a farming community, and the main crops grown were wheat, corn, and oats. The town also had a few small businesses, such as a general store, a blacksmith, and a sawmill. The town grew slowly, but steadily, and by the late 1800s, it had become a thriving community.
In the early 1900s, the town began to experience a period of growth and development. The railroad came to town, and the town became a popular stop for travelers. The town also began to attract new businesses, such as a canning factory, a flour mill, and a brickyard.
The town continued to grow and prosper throughout the 20th century. In the 1950s, the town was home to a large number of factories, including a paper mill, a steel mill, and a chemical plant. The town also had a number of small businesses, such as a grocery store, a hardware store, and a drug store.
The town experienced a period of decline in the late 20th century, as many of the factories and businesses closed down. However, the town has seen a resurgence in recent years, as new businesses have opened up and the town has become a popular destination for tourists.
Geography
Fairmont is located in the northern part of Illinois, in the county of McHenry. It is situated on the banks of the Fox River, and is part of the Chicago metropolitan area. The town is located about 40 miles northwest of Chicago, and is bordered by the towns of Woodstock, Crystal Lake, and McHenry.
The town has a total area of 2.2 square miles, all of which is land. The terrain of the town is mostly flat, with some rolling hills. The town is located in a temperate climate, with hot summers and cold winters.
Economy
The economy of Fairmont is largely based on tourism and small businesses. The town is home to a number of small businesses, such as restaurants, shops, and galleries. The town also has a number of tourist attractions, such as the Fox River Trail, the McHenry County Historical Society, and the McHenry County Fairgrounds.
The town is also home to a number of manufacturing companies, such as a paper mill, a steel mill, and a chemical plant. These companies provide jobs for many of the town’s residents.
Demographics
As of the 2010 census, the town of Fairmont had a population of 4,719. The population is largely white (93.3%), with small percentages of African American (2.2%), Asian (1.3%), and Hispanic (1.2%) residents. The median household income is $60,945, and the median home value is $179,400.
The town has a high rate of homeownership (77.3%), and the majority of residents (90.2%) are high school graduates. The town also has a low unemployment rate (3.7%), and a low poverty rate (7.2%).
Conclusion
Fairmont, Illinois is a small town located in the northern part of the state, in the county of McHenry. It is situated on the banks of the Fox River, and is part of the Chicago metropolitan area. The town was first settled in 1836, and has since grown into a thriving community. The town has a largely white population, and the economy is largely based on tourism and small businesses. The town has a high rate of homeownership, and a low unemployment and poverty rate.
Common Questions
What is Per Capita Income in Fairmont?
Per Capita income in Fairmont is $19,044.
What is the Median Family Income in Fairmont?
Median Family Income in Fairmont is $64,792.
What is the Median Household income in Fairmont?
Median Household Income in Fairmont is $61,103.
What is Income or Wage Gap in Fairmont?
Income or Wage Gap in Fairmont is 18.5%.
Women in Fairmont earn 81.5 cents for every dollar earned by a man.
What is Inequality or Gini Index in Fairmont?
Inequality or Gini Index in Fairmont is 0.30.
What is the Total Population of Fairmont?
Total Population of Fairmont is 2,595.
What is the Total Male Population of Fairmont?
Total Male Population of Fairmont is 1,101.
What is the Total Female Population of Fairmont?
Total Female Population of Fairmont is 1,494.
What is the Ratio of Males per 100 Females in Fairmont?
There are 73.69 Males per 100 Females in Fairmont.
What is the Ratio of Females per 100 Males in Fairmont?
There are 135.69 Females per 100 Males in Fairmont.
What is the Median Population Age in Fairmont?
Median Population Age in Fairmont is 30.5 Years.
What is the Average Family Size in Fairmont
Average Family Size in Fairmont is 4.2 People.
What is the Average Household Size in Fairmont
Average Household Size in Fairmont is 3.4 People.
How Large is the Labor Force in Fairmont?
There are 1,185 People in the Labor Forcein in Fairmont.
What is the Percentage of People in the Labor Force in Fairmont?
66.1% of People are in the Labor Force in Fairmont.
What is the Unemployment Rate in Fairmont?
Unemployment Rate in Fairmont is 9.6%.