Onarga, IL Map & Demographics
Onarga Map
Onarga Overview
$23,258
PER CAPITA INCOME
$75,337
AVG FAMILY INCOME
$57,188
AVG HOUSEHOLD INCOME
20.8%
WAGE / INCOME GAP [ % ]
79.2¢/ $1
WAGE / INCOME GAP [ $ ]
0.40
INEQUALITY / GINI INDEX
1,288
TOTAL POPULATION
619
MALE POPULATION
669
FEMALE POPULATION
92.53
MALES / 100 FEMALES
108.08
FEMALES / 100 MALES
40.5
MEDIAN AGE
3.5
AVG FAMILY SIZE
2.8
AVG HOUSEHOLD SIZE
607
LABOR FORCE [ PEOPLE ]
58.8%
PERCENT IN LABOR FORCE
10.0%
UNEMPLOYMENT RATE
Onarga Zip Codes
Onarga Area Codes
Income in Onarga
Income Overview in Onarga
Per Capita Income in Onarga is $23,258, while median incomes of families and households are $75,337 and $57,188 respectively.
| Characteristic | Number | Measure |
| Per Capita Income | 1,288 | $23,258 |
| Median Family Income | 309 | $75,337 |
| Mean Family Income | 309 | $82,094 |
| Median Household Income | 444 | $57,188 |
| Mean Household Income | 444 | $67,709 |
| Income Deficit | 309 | $0 |
| Wage / Income Gap (%) | 1,288 | 20.80% |
| Wage / Income Gap ($) | 1,288 | 79.20¢ per $1 |
| Gini / Inequality Index | 1,288 | 0.40 |
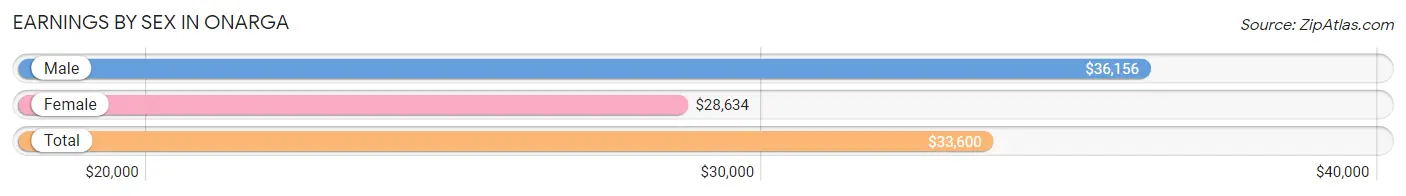
Earnings by Sex in Onarga
Average Earnings in Onarga are $33,600, $36,156 for men and $28,634 for women, a difference of 20.8%.
| Sex | Number | Average Earnings |
| Male | 337 (53.7%) | $36,156 |
| Female | 291 (46.3%) | $28,634 |
| Total | 628 (100.0%) | $33,600 |
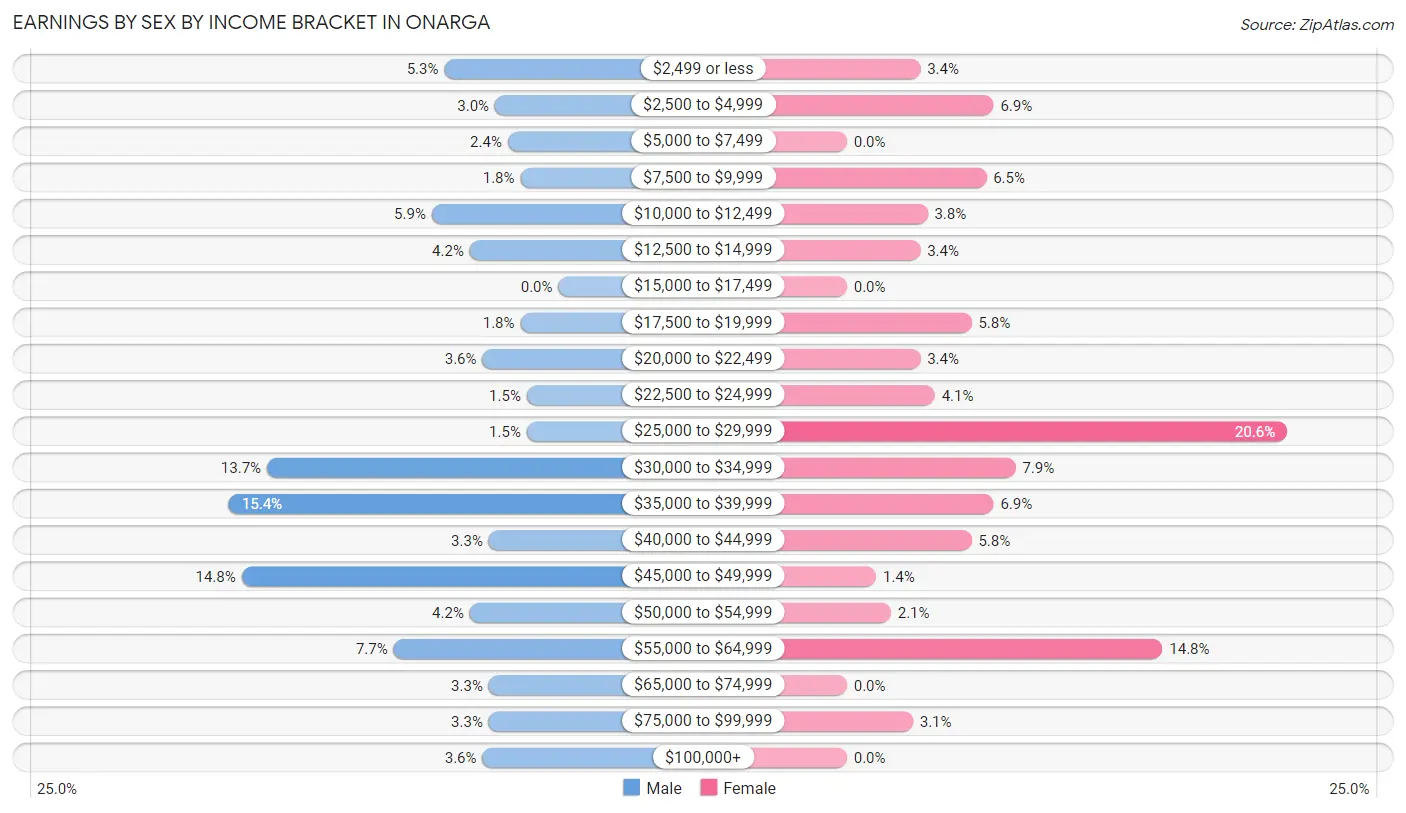
Earnings by Sex by Income Bracket in Onarga
The most common earnings brackets in Onarga are $35,000 to $39,999 for men (52 | 15.4%) and $25,000 to $29,999 for women (60 | 20.6%).
| Income | Male | Female |
| $2,499 or less | 18 (5.3%) | 10 (3.4%) |
| $2,500 to $4,999 | 10 (3.0%) | 20 (6.9%) |
| $5,000 to $7,499 | 8 (2.4%) | 0 (0.0%) |
| $7,500 to $9,999 | 6 (1.8%) | 19 (6.5%) |
| $10,000 to $12,499 | 20 (5.9%) | 11 (3.8%) |
| $12,500 to $14,999 | 14 (4.2%) | 10 (3.4%) |
| $15,000 to $17,499 | 0 (0.0%) | 0 (0.0%) |
| $17,500 to $19,999 | 6 (1.8%) | 17 (5.8%) |
| $20,000 to $22,499 | 12 (3.6%) | 10 (3.4%) |
| $22,500 to $24,999 | 5 (1.5%) | 12 (4.1%) |
| $25,000 to $29,999 | 5 (1.5%) | 60 (20.6%) |
| $30,000 to $34,999 | 46 (13.7%) | 23 (7.9%) |
| $35,000 to $39,999 | 52 (15.4%) | 20 (6.9%) |
| $40,000 to $44,999 | 11 (3.3%) | 17 (5.8%) |
| $45,000 to $49,999 | 50 (14.8%) | 4 (1.4%) |
| $50,000 to $54,999 | 14 (4.2%) | 6 (2.1%) |
| $55,000 to $64,999 | 26 (7.7%) | 43 (14.8%) |
| $65,000 to $74,999 | 11 (3.3%) | 0 (0.0%) |
| $75,000 to $99,999 | 11 (3.3%) | 9 (3.1%) |
| $100,000+ | 12 (3.6%) | 0 (0.0%) |
| Total | 337 (100.0%) | 291 (100.0%) |
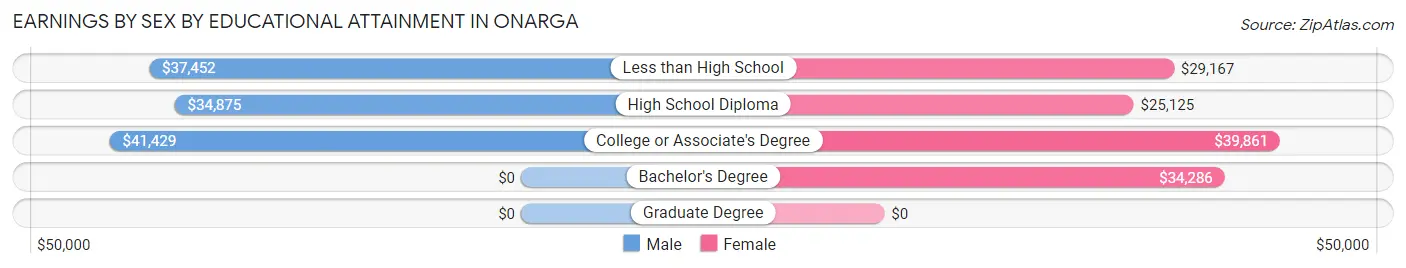
Earnings by Sex by Educational Attainment in Onarga
Average earnings in Onarga are $37,500 for men and $33,676 for women, a difference of 10.2%. Men with an educational attainment of college or associate's degree enjoy the highest average annual earnings of $41,429, while those with high school diploma education earn the least with $34,875. Women with an educational attainment of college or associate's degree earn the most with the average annual earnings of $39,861, while those with high school diploma education have the smallest earnings of $25,125.
| Educational Attainment | Male Income | Female Income |
| Less than High School | $37,452 | $29,167 |
| High School Diploma | $34,875 | $25,125 |
| College or Associate's Degree | $41,429 | $39,861 |
| Bachelor's Degree | - | - |
| Graduate Degree | - | - |
| Total | $37,500 | $33,676 |
Family Income in Onarga
Family Income Brackets in Onarga
According to the Onarga family income data, there are 81 families falling into the $100,000 to $149,999 income range, which is the most common income bracket and makes up 26.2% of all families. Conversely, the $15,000 to $24,999 income bracket is the least frequent group with only 3 families (1.0%) belonging to this category.
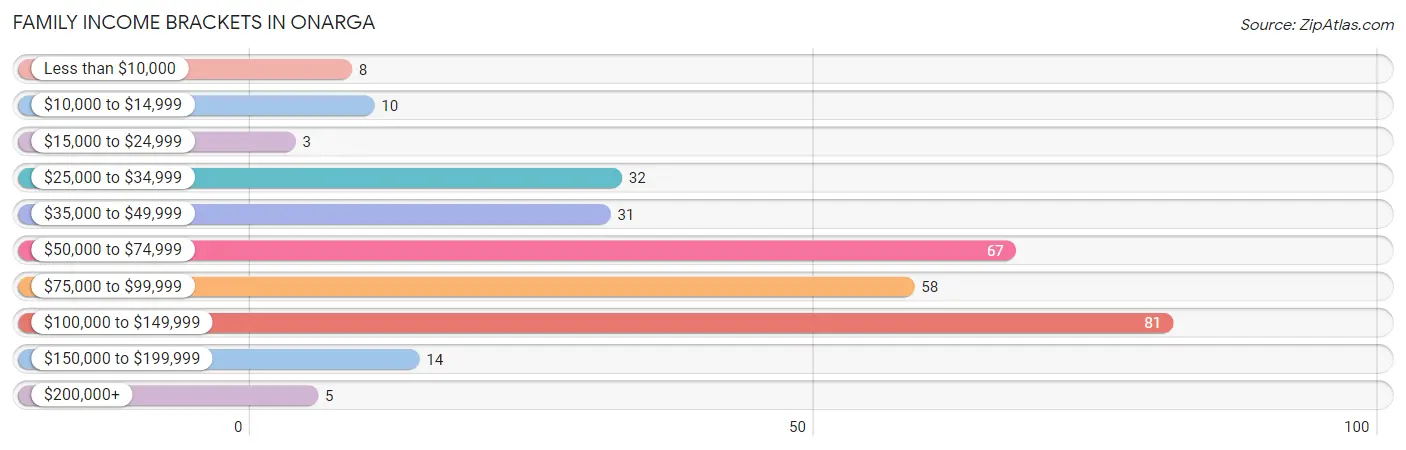
| Income Bracket | # Families | % Families |
| Less than $10,000 | 8 | 2.6% |
| $10,000 to $14,999 | 10 | 3.2% |
| $15,000 to $24,999 | 3 | 1.0% |
| $25,000 to $34,999 | 32 | 10.4% |
| $35,000 to $49,999 | 31 | 10.0% |
| $50,000 to $74,999 | 67 | 21.7% |
| $75,000 to $99,999 | 58 | 18.8% |
| $100,000 to $149,999 | 81 | 26.2% |
| $150,000 to $199,999 | 14 | 4.5% |
| $200,000+ | 5 | 1.6% |
Family Income by Famaliy Size in Onarga
4-person families (83 | 26.9%) account for the highest median family income in Onarga with $106,875 per family, while 2-person families (94 | 30.4%) have the highest median income of $34,166 per family member.
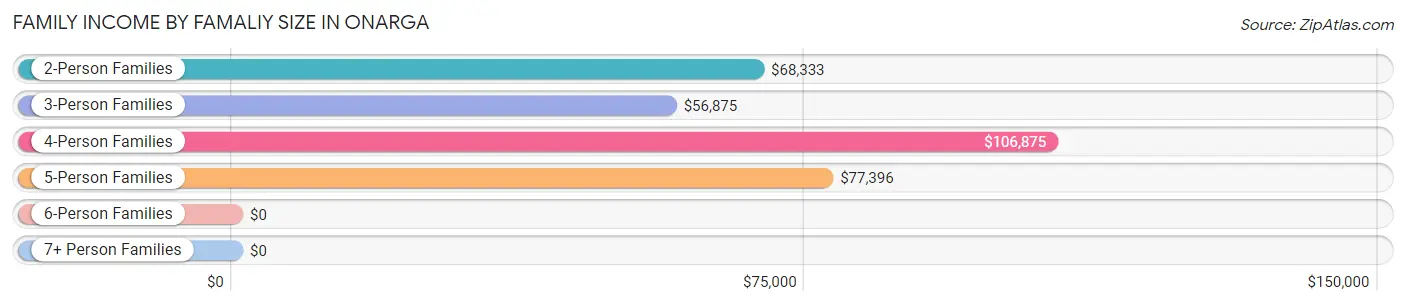
| Income Bracket | # Families | Median Income |
| 2-Person Families | 94 (30.4%) | $68,333 |
| 3-Person Families | 39 (12.6%) | $56,875 |
| 4-Person Families | 83 (26.9%) | $106,875 |
| 5-Person Families | 66 (21.4%) | $77,396 |
| 6-Person Families | 16 (5.2%) | $0 |
| 7+ Person Families | 11 (3.6%) | $0 |
| Total | 309 (100.0%) | $75,337 |
Family Income by Number of Earners in Onarga
The median family income in Onarga is $75,337, with families comprising 3+ earners (87) having the highest median family income of $117,159, while families with 1 earner (81) have the lowest median family income of $43,365, accounting for 28.2% and 26.2% of families, respectively.
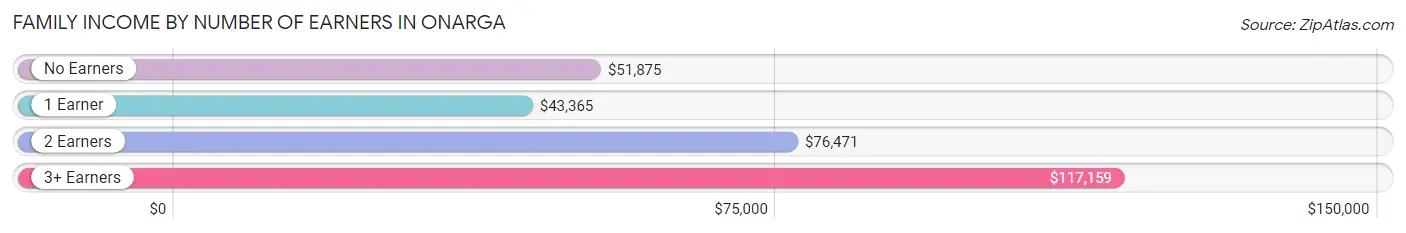
| Number of Earners | # Families | Median Income |
| No Earners | 43 (13.9%) | $51,875 |
| 1 Earner | 81 (26.2%) | $43,365 |
| 2 Earners | 98 (31.7%) | $76,471 |
| 3+ Earners | 87 (28.2%) | $117,159 |
| Total | 309 (100.0%) | $75,337 |
Household Income in Onarga
Household Income Brackets in Onarga
With 98 households falling in the category, the $50,000 to $74,999 income range is the most frequent in Onarga, accounting for 22.1% of all households. In contrast, only 5 households (1.1%) fall into the $200,000+ income bracket, making it the least populous group.
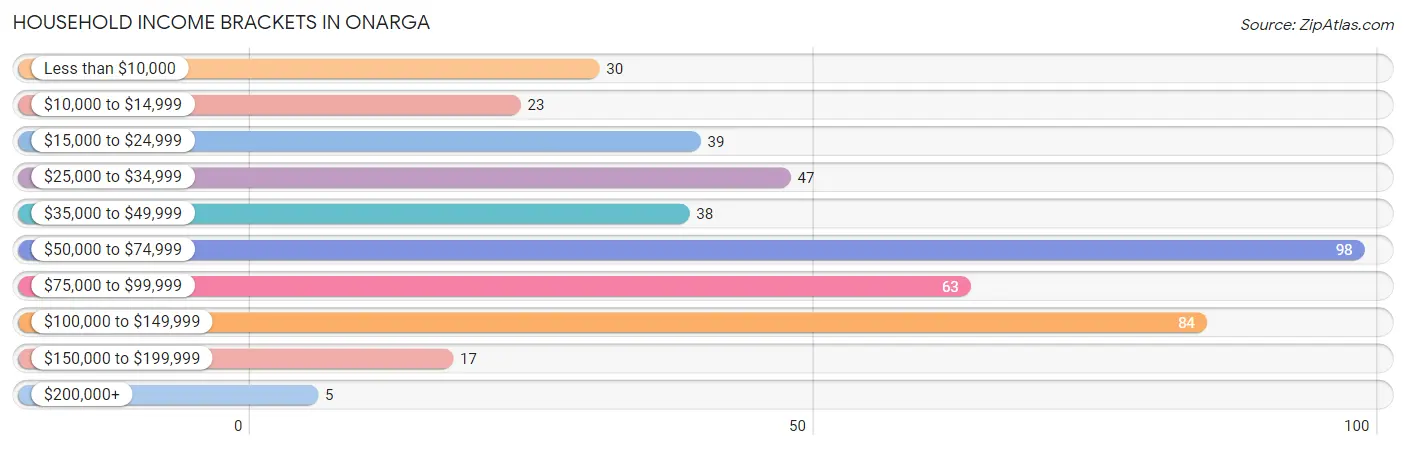
| Income Bracket | # Households | % Households |
| Less than $10,000 | 30 | 6.8% |
| $10,000 to $14,999 | 23 | 5.2% |
| $15,000 to $24,999 | 39 | 8.8% |
| $25,000 to $34,999 | 47 | 10.6% |
| $35,000 to $49,999 | 38 | 8.6% |
| $50,000 to $74,999 | 98 | 22.1% |
| $75,000 to $99,999 | 63 | 14.2% |
| $100,000 to $149,999 | 84 | 18.9% |
| $150,000 to $199,999 | 17 | 3.8% |
| $200,000+ | 5 | 1.1% |
Household Income by Householder Age in Onarga
The median household income in Onarga is $57,188, with the highest median household income of $78,750 found in the 25 to 44 years age bracket for the primary householder. A total of 126 households (28.4%) fall into this category. Meanwhile, the 15 to 24 years age bracket for the primary householder has the lowest median household income of $0, with 4 households (0.9%) in this group.
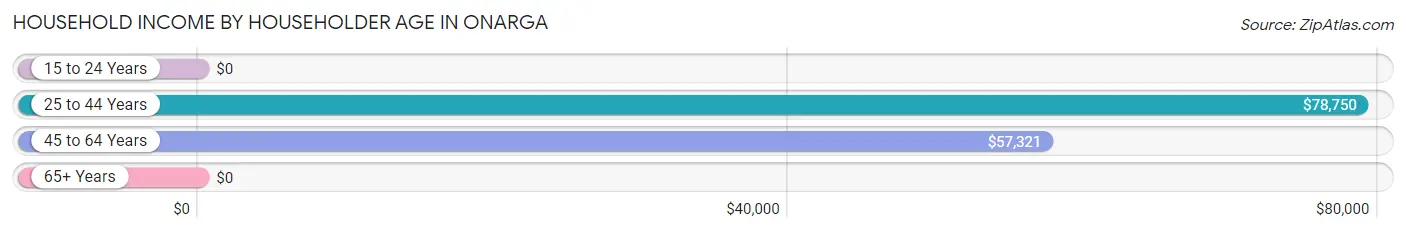
| Income Bracket | # Households | Median Income |
| 15 to 24 Years | 4 (0.9%) | $0 |
| 25 to 44 Years | 126 (28.4%) | $78,750 |
| 45 to 64 Years | 184 (41.4%) | $57,321 |
| 65+ Years | 130 (29.3%) | $0 |
| Total | 444 (100.0%) | $57,188 |
Poverty in Onarga
Income Below Poverty by Sex and Age in Onarga
With 6.1% poverty level for males and 12.7% for females among the residents of Onarga, 65 to 74 year old males and 45 to 54 year old females are the most vulnerable to poverty, with 7 males (20.0%) and 25 females (34.3%) in their respective age groups living below the poverty level.
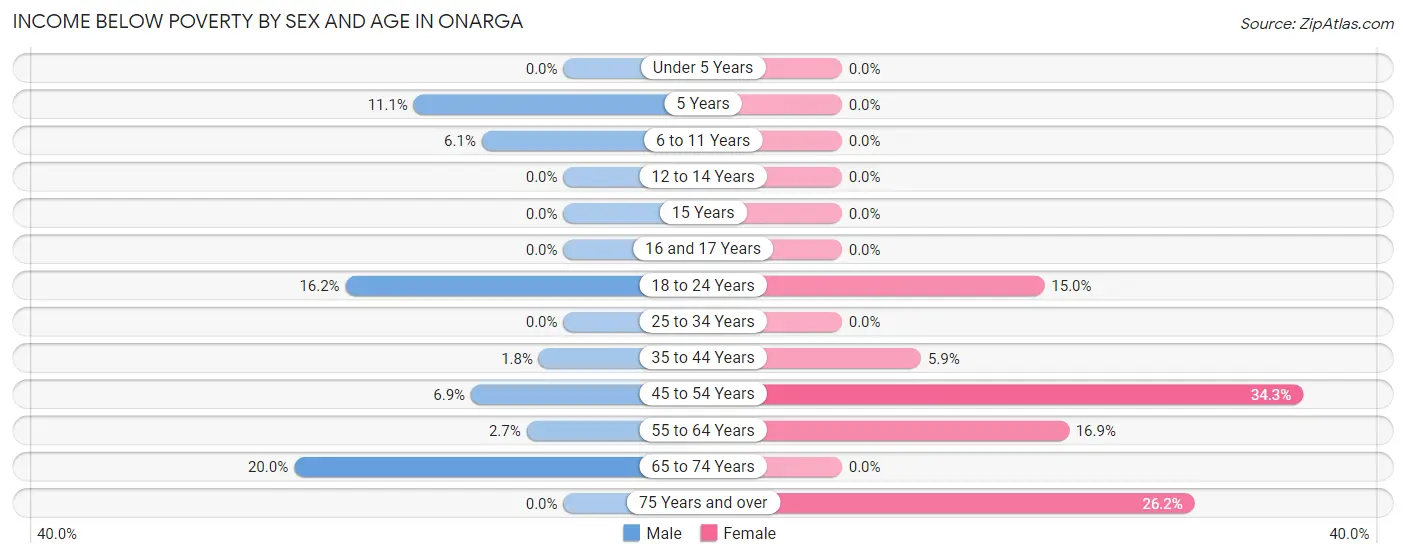
| Age Bracket | Male | Female |
| Under 5 Years | 0 (0.0%) | 0 (0.0%) |
| 5 Years | 3 (11.1%) | 0 (0.0%) |
| 6 to 11 Years | 4 (6.1%) | 0 (0.0%) |
| 12 to 14 Years | 0 (0.0%) | 0 (0.0%) |
| 15 Years | 0 (0.0%) | 0 (0.0%) |
| 16 and 17 Years | 0 (0.0%) | 0 (0.0%) |
| 18 to 24 Years | 11 (16.2%) | 17 (15.0%) |
| 25 to 34 Years | 0 (0.0%) | 0 (0.0%) |
| 35 to 44 Years | 1 (1.8%) | 6 (5.9%) |
| 45 to 54 Years | 7 (6.9%) | 25 (34.3%) |
| 55 to 64 Years | 3 (2.7%) | 15 (16.9%) |
| 65 to 74 Years | 7 (20.0%) | 0 (0.0%) |
| 75 Years and over | 0 (0.0%) | 22 (26.2%) |
| Total | 36 (6.1%) | 85 (12.7%) |
Income Above Poverty by Sex and Age in Onarga
According to the poverty statistics in Onarga, males aged under 5 years and females aged under 5 years are the age groups that are most secure financially, with 100.0% of males and 100.0% of females in these age groups living above the poverty line.
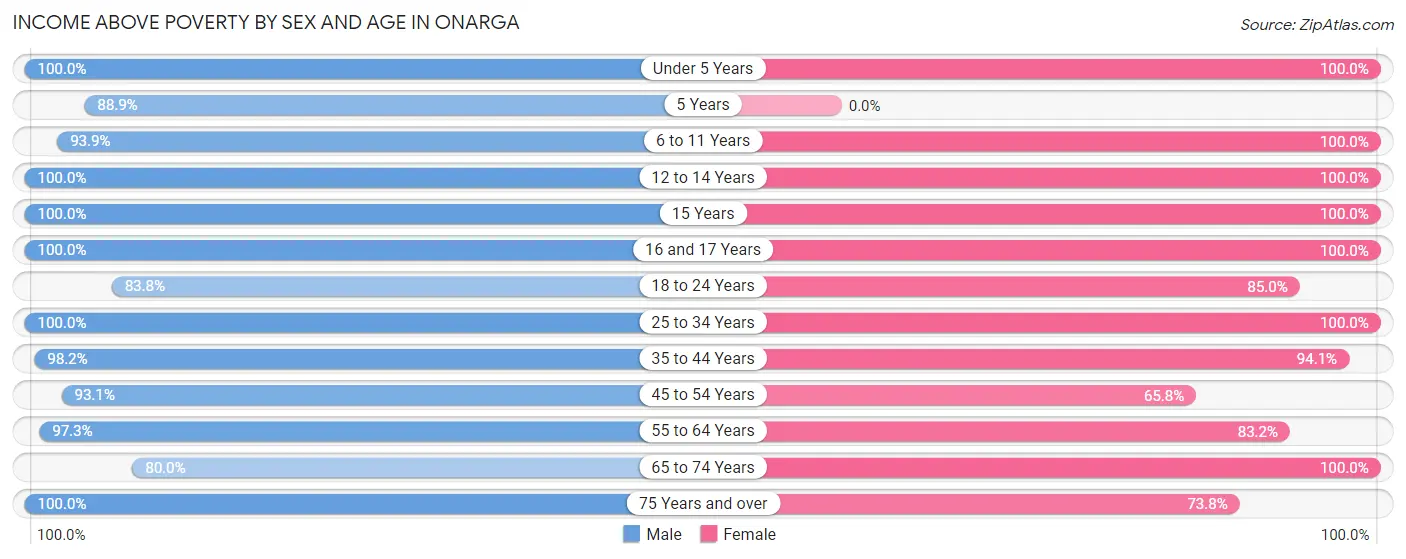
| Age Bracket | Male | Female |
| Under 5 Years | 11 (100.0%) | 33 (100.0%) |
| 5 Years | 24 (88.9%) | 0 (0.0%) |
| 6 to 11 Years | 62 (93.9%) | 52 (100.0%) |
| 12 to 14 Years | 31 (100.0%) | 13 (100.0%) |
| 15 Years | 4 (100.0%) | 12 (100.0%) |
| 16 and 17 Years | 22 (100.0%) | 17 (100.0%) |
| 18 to 24 Years | 57 (83.8%) | 96 (85.0%) |
| 25 to 34 Years | 37 (100.0%) | 48 (100.0%) |
| 35 to 44 Years | 54 (98.2%) | 96 (94.1%) |
| 45 to 54 Years | 95 (93.1%) | 48 (65.7%) |
| 55 to 64 Years | 107 (97.3%) | 74 (83.2%) |
| 65 to 74 Years | 28 (80.0%) | 33 (100.0%) |
| 75 Years and over | 24 (100.0%) | 62 (73.8%) |
| Total | 556 (93.9%) | 584 (87.3%) |
Income Below Poverty Among Married-Couple Families in Onarga
The poverty statistics for married-couple families in Onarga show that 5.3% or 13 of the total 246 families live below the poverty line. Families with 1 or 2 children have the highest poverty rate of 10.5%, comprising of 6 families. On the other hand, families with 3 or 4 children have the lowest poverty rate of 0.0%, which includes 0 families.
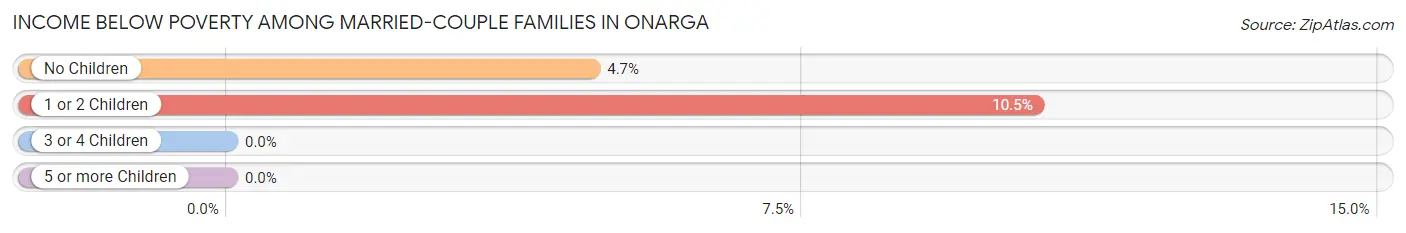
| Children | Above Poverty | Below Poverty |
| No Children | 141 (95.3%) | 7 (4.7%) |
| 1 or 2 Children | 51 (89.5%) | 6 (10.5%) |
| 3 or 4 Children | 41 (100.0%) | 0 (0.0%) |
| 5 or more Children | 0 (0.0%) | 0 (0.0%) |
| Total | 233 (94.7%) | 13 (5.3%) |
Income Below Poverty Among Single-Parent Households in Onarga
According to the poverty data in Onarga, 100.0% or 3 single-father households and 13.3% or 8 single-mother households are living below the poverty line. Among single-father households, those with 1 or 2 children have the highest poverty rate, with 3 households (100.0%) experiencing poverty. Likewise, among single-mother households, those with no children have the highest poverty rate, with 8 households (42.1%) falling below the poverty line.
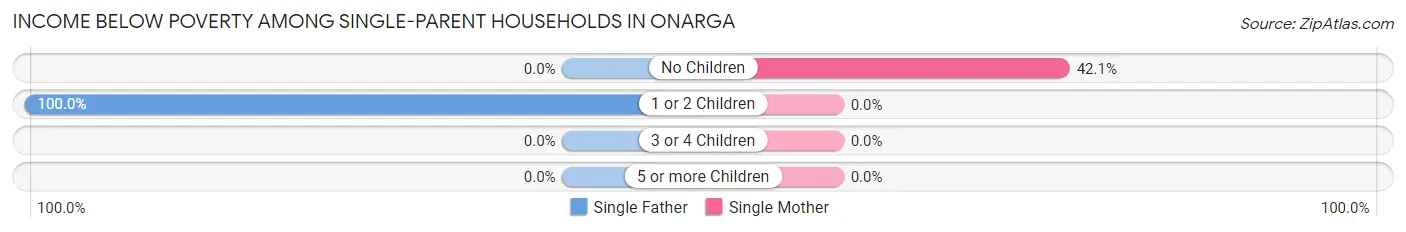
| Children | Single Father | Single Mother |
| No Children | 0 (0.0%) | 8 (42.1%) |
| 1 or 2 Children | 3 (100.0%) | 0 (0.0%) |
| 3 or 4 Children | 0 (0.0%) | 0 (0.0%) |
| 5 or more Children | 0 (0.0%) | 0 (0.0%) |
| Total | 3 (100.0%) | 8 (13.3%) |
Income Below Poverty Among Married-Couple vs Single-Parent Households in Onarga
The poverty data for Onarga shows that 13 of the married-couple family households (5.3%) and 11 of the single-parent households (17.5%) are living below the poverty level. Within the married-couple family households, those with 1 or 2 children have the highest poverty rate, with 6 households (10.5%) falling below the poverty line. Among the single-parent households, those with no children have the highest poverty rate, with 8 household (42.1%) living below poverty.
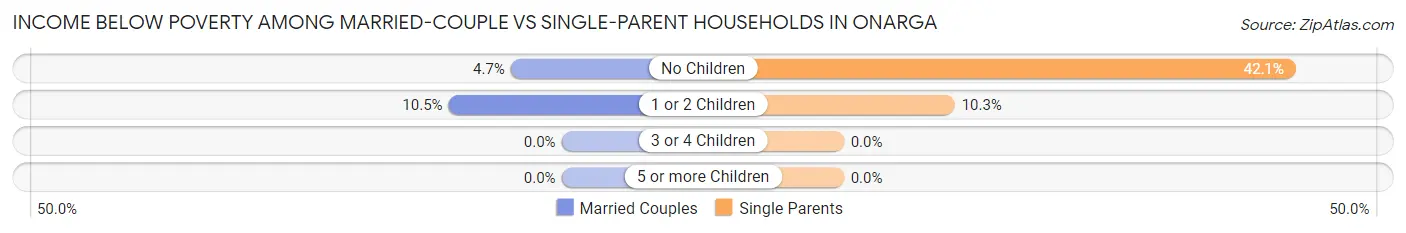
| Children | Married-Couple Families | Single-Parent Households |
| No Children | 7 (4.7%) | 8 (42.1%) |
| 1 or 2 Children | 6 (10.5%) | 3 (10.3%) |
| 3 or 4 Children | 0 (0.0%) | 0 (0.0%) |
| 5 or more Children | 0 (0.0%) | 0 (0.0%) |
| Total | 13 (5.3%) | 11 (17.5%) |
Race in Onarga
The most populous races in Onarga are White / Caucasian (763 | 59.2%), Hispanic or Latino (757 | 58.8%), and Some other Race (384 | 29.8%).
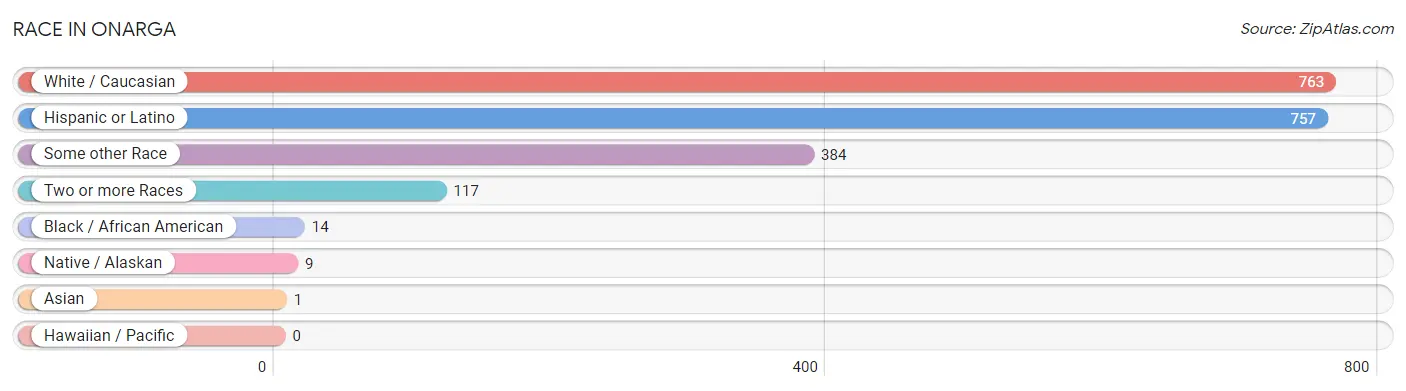
| Race | # Population | % Population |
| Asian | 1 | 0.1% |
| Black / African American | 14 | 1.1% |
| Hawaiian / Pacific | 0 | 0.0% |
| Hispanic or Latino | 757 | 58.8% |
| Native / Alaskan | 9 | 0.7% |
| White / Caucasian | 763 | 59.2% |
| Two or more Races | 117 | 9.1% |
| Some other Race | 384 | 29.8% |
| Total | 1,288 | 100.0% |
Ancestry in Onarga
The most populous ancestries reported in Onarga are Mexican (732 | 56.8%), German (247 | 19.2%), English (107 | 8.3%), Irish (59 | 4.6%), and American (58 | 4.5%), together accounting for 93.4% of all Onarga residents.
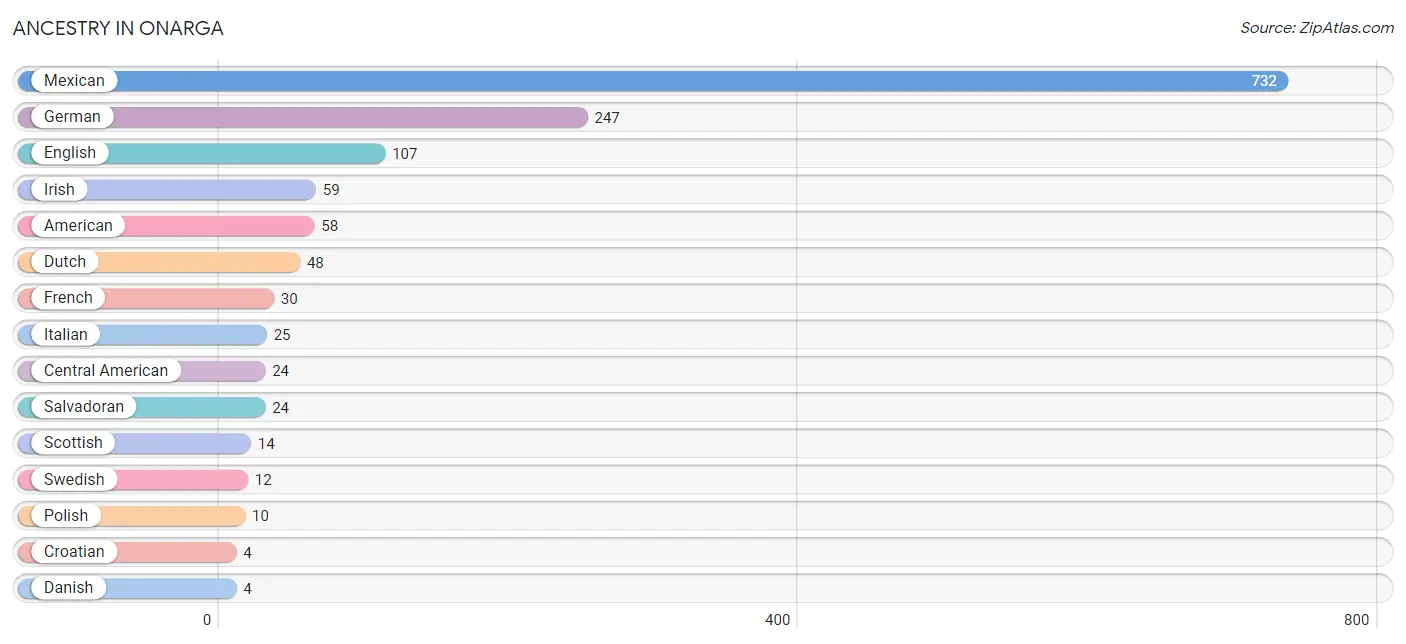
| Ancestry | # Population | % Population |
| American | 58 | 4.5% |
| Bhutanese | 1 | 0.1% |
| Blackfeet | 1 | 0.1% |
| Central American | 24 | 1.9% |
| Cherokee | 1 | 0.1% |
| Croatian | 4 | 0.3% |
| Danish | 4 | 0.3% |
| Dutch | 48 | 3.7% |
| English | 107 | 8.3% |
| French | 30 | 2.3% |
| German | 247 | 19.2% |
| Irish | 59 | 4.6% |
| Italian | 25 | 1.9% |
| Mexican | 732 | 56.8% |
| Mexican American Indian | 4 | 0.3% |
| Polish | 10 | 0.8% |
| Puerto Rican | 1 | 0.1% |
| Salvadoran | 24 | 1.9% |
| Scottish | 14 | 1.1% |
| Swedish | 12 | 0.9% |
| Swiss | 2 | 0.2% | View All 21 Rows |
Immigrants in Onarga
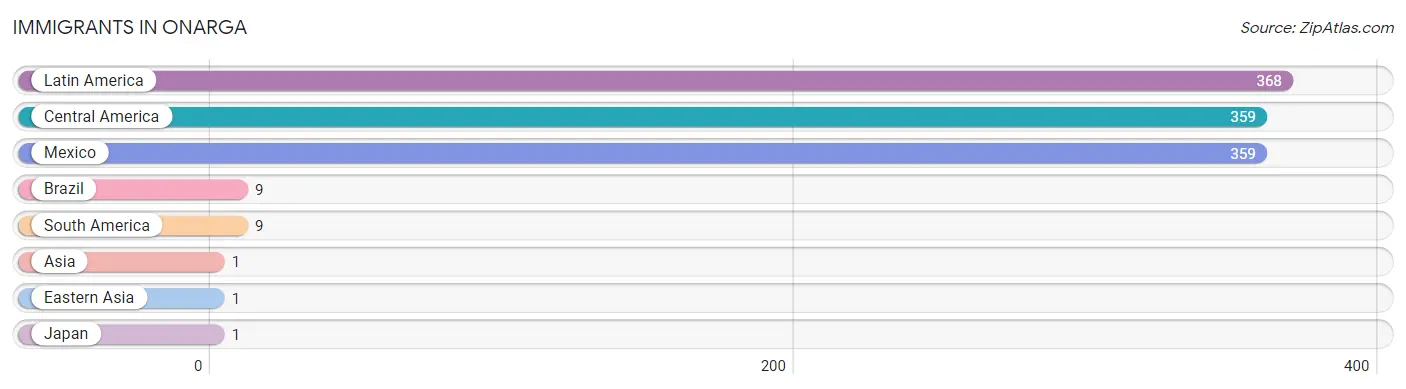
The most numerous immigrant groups reported in Onarga came from Latin America (368 | 28.6%), Central America (359 | 27.9%), Mexico (359 | 27.9%), Brazil (9 | 0.7%), and South America (9 | 0.7%), together accounting for 85.7% of all Onarga residents.
| Immigration Origin | # Population | % Population |
| Asia | 1 | 0.1% |
| Brazil | 9 | 0.7% |
| Central America | 359 | 27.9% |
| Eastern Asia | 1 | 0.1% |
| Japan | 1 | 0.1% |
| Latin America | 368 | 28.6% |
| Mexico | 359 | 27.9% |
| South America | 9 | 0.7% | View All 8 Rows |
Sex and Age in Onarga
Sex and Age in Onarga
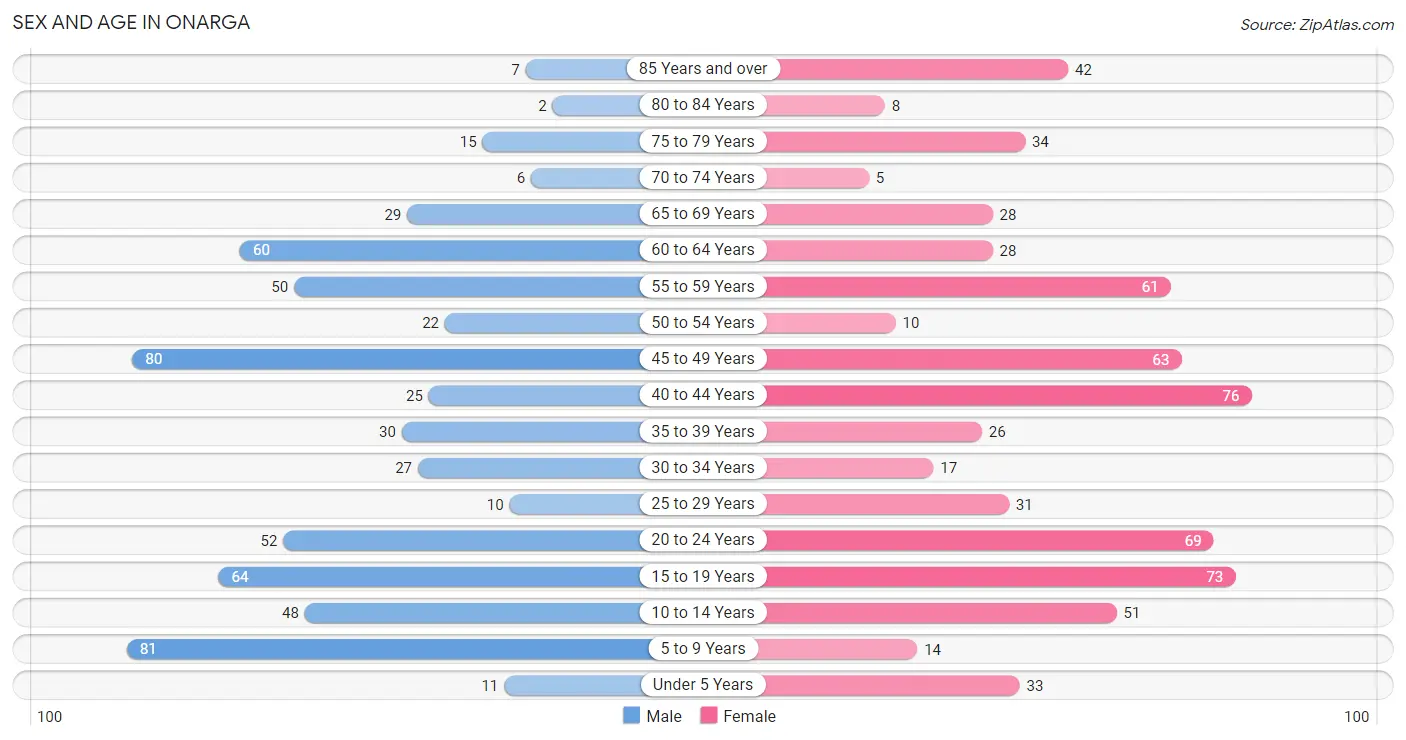
The most populous age groups in Onarga are 5 to 9 Years (81 | 13.1%) for men and 40 to 44 Years (76 | 11.4%) for women.
| Age Bracket | Male | Female |
| Under 5 Years | 11 (1.8%) | 33 (4.9%) |
| 5 to 9 Years | 81 (13.1%) | 14 (2.1%) |
| 10 to 14 Years | 48 (7.7%) | 51 (7.6%) |
| 15 to 19 Years | 64 (10.3%) | 73 (10.9%) |
| 20 to 24 Years | 52 (8.4%) | 69 (10.3%) |
| 25 to 29 Years | 10 (1.6%) | 31 (4.6%) |
| 30 to 34 Years | 27 (4.4%) | 17 (2.5%) |
| 35 to 39 Years | 30 (4.9%) | 26 (3.9%) |
| 40 to 44 Years | 25 (4.0%) | 76 (11.4%) |
| 45 to 49 Years | 80 (12.9%) | 63 (9.4%) |
| 50 to 54 Years | 22 (3.5%) | 10 (1.5%) |
| 55 to 59 Years | 50 (8.1%) | 61 (9.1%) |
| 60 to 64 Years | 60 (9.7%) | 28 (4.2%) |
| 65 to 69 Years | 29 (4.7%) | 28 (4.2%) |
| 70 to 74 Years | 6 (1.0%) | 5 (0.7%) |
| 75 to 79 Years | 15 (2.4%) | 34 (5.1%) |
| 80 to 84 Years | 2 (0.3%) | 8 (1.2%) |
| 85 Years and over | 7 (1.1%) | 42 (6.3%) |
| Total | 619 (100.0%) | 669 (100.0%) |
Families and Households in Onarga
Median Family Size in Onarga
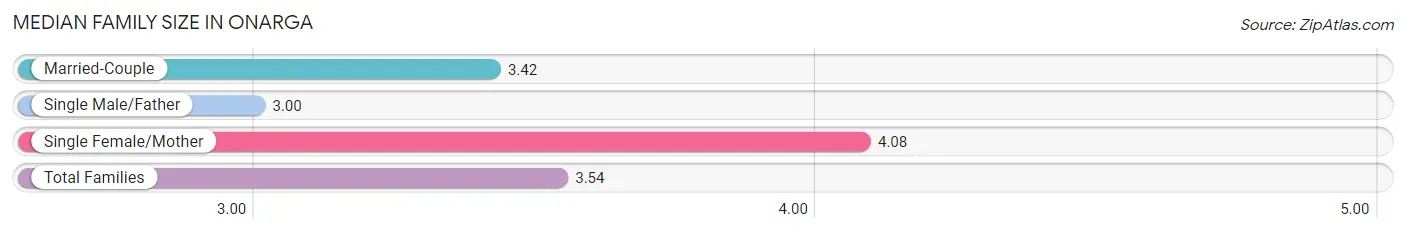
The median family size in Onarga is 3.54 persons per family, with single female/mother families (60 | 19.4%) accounting for the largest median family size of 4.08 persons per family. On the other hand, single male/father families (3 | 1.0%) represent the smallest median family size with 3.00 persons per family.
| Family Type | # Families | Family Size |
| Married-Couple | 246 (79.6%) | 3.42 |
| Single Male/Father | 3 (1.0%) | 3.00 |
| Single Female/Mother | 60 (19.4%) | 4.08 |
| Total Families | 309 (100.0%) | 3.54 |
Median Household Size in Onarga
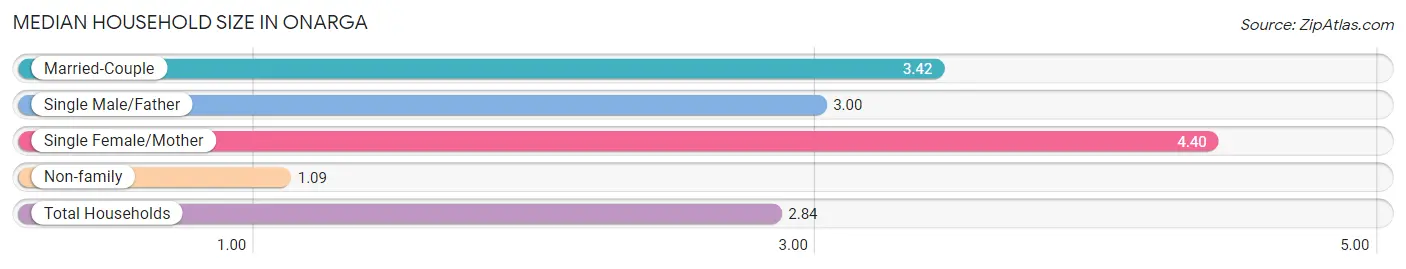
The median household size in Onarga is 2.84 persons per household, with single female/mother households (60 | 13.5%) accounting for the largest median household size of 4.4 persons per household. non-family households (135 | 30.4%) represent the smallest median household size with 1.09 persons per household.
| Household Type | # Households | Household Size |
| Married-Couple | 246 (55.4%) | 3.42 |
| Single Male/Father | 3 (0.7%) | 3.00 |
| Single Female/Mother | 60 (13.5%) | 4.40 |
| Non-family | 135 (30.4%) | 1.09 |
| Total Households | 444 (100.0%) | 2.84 |
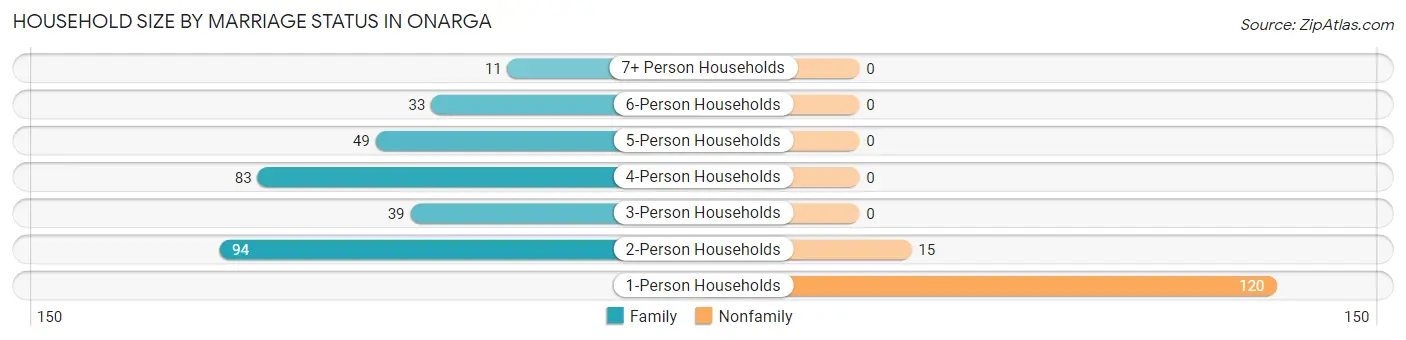
Household Size by Marriage Status in Onarga
Out of a total of 444 households in Onarga, 309 (69.6%) are family households, while 135 (30.4%) are nonfamily households. The most numerous type of family households are 2-person households, comprising 94, and the most common type of nonfamily households are 1-person households, comprising 120.
| Household Size | Family Households | Nonfamily Households |
| 1-Person Households | - | 120 (27.0%) |
| 2-Person Households | 94 (21.2%) | 15 (3.4%) |
| 3-Person Households | 39 (8.8%) | 0 (0.0%) |
| 4-Person Households | 83 (18.7%) | 0 (0.0%) |
| 5-Person Households | 49 (11.0%) | 0 (0.0%) |
| 6-Person Households | 33 (7.4%) | 0 (0.0%) |
| 7+ Person Households | 11 (2.5%) | 0 (0.0%) |
| Total | 309 (69.6%) | 135 (30.4%) |
Female Fertility in Onarga
Fertility by Age in Onarga
| Age Bracket | Women with Births | Births / 1,000 Women |
| 15 to 19 years | 0 (0.0%) | 0.0 |
| 20 to 34 years | 0 (0.0%) | 0.0 |
| 35 to 50 years | 0 (0.0%) | 0.0 |
| Total | 0 (0.0%) | 0.0 |
Fertility by Age by Marriage Status in Onarga
| Age Bracket | Married | Unmarried |
| 15 to 19 years | 0 (0.0%) | 0 (0.0%) |
| 20 to 34 years | 0 (0.0%) | 0 (0.0%) |
| 35 to 50 years | 0 (0.0%) | 0 (0.0%) |
| Total | 0 (0.0%) | 0 (0.0%) |
Fertility by Education in Onarga
| Educational Attainment | Women with Births | Births / 1,000 Women |
| Less than High School | 0 (0.0%) | 0.0 |
| High School Diploma | 0 (0.0%) | 0.0 |
| College or Associate's Degree | 0 (0.0%) | 0.0 |
| Bachelor's Degree | 0 (0.0%) | 0.0 |
| Graduate Degree | 0 (0.0%) | 0.0 |
| Total | 0 (0.0%) | 0.0 |
Fertility by Education by Marriage Status in Onarga
| Educational Attainment | Married | Unmarried |
| Less than High School | 0 (0.0%) | 0 (0.0%) |
| High School Diploma | 0 (0.0%) | 0 (0.0%) |
| College or Associate's Degree | 0 (0.0%) | 0 (0.0%) |
| Bachelor's Degree | 0 (0.0%) | 0 (0.0%) |
| Graduate Degree | 0 (0.0%) | 0 (0.0%) |
| Total | 0 (0.0%) | 0 (0.0%) |
Employment Characteristics in Onarga
Employment by Class of Employer in Onarga
Among the 534 employed individuals in Onarga, private company employees (416 | 77.9%), not-for-profit organizations (46 | 8.6%), and local government employees (25 | 4.7%) make up the most common classes of employment.
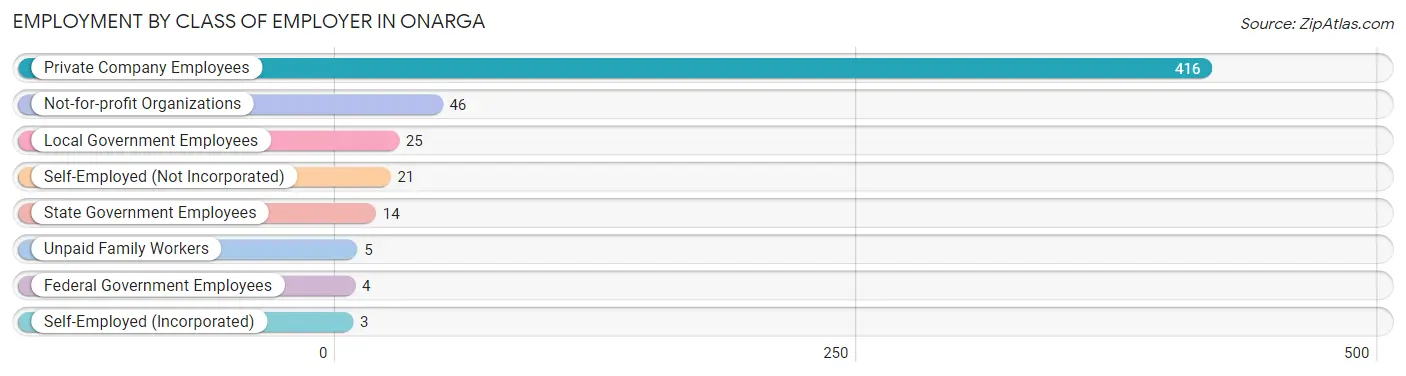
| Employer Class | # Employees | % Employees |
| Private Company Employees | 416 | 77.9% |
| Self-Employed (Incorporated) | 3 | 0.6% |
| Self-Employed (Not Incorporated) | 21 | 3.9% |
| Not-for-profit Organizations | 46 | 8.6% |
| Local Government Employees | 25 | 4.7% |
| State Government Employees | 14 | 2.6% |
| Federal Government Employees | 4 | 0.7% |
| Unpaid Family Workers | 5 | 0.9% |
| Total | 534 | 100.0% |
Employment Status by Age in Onarga
According to the labor force statistics for Onarga, out of the total population over 16 years of age (1,033), 58.8% or 607 individuals are in the labor force, with 10.0% or 61 of them unemployed. The age group with the highest labor force participation rate is 25 to 29 years, with 100.0% or 41 individuals in the labor force. Within the labor force, the 20 to 24 years age range has the highest percentage of unemployed individuals, with 31.0% or 22 of them being unemployed.
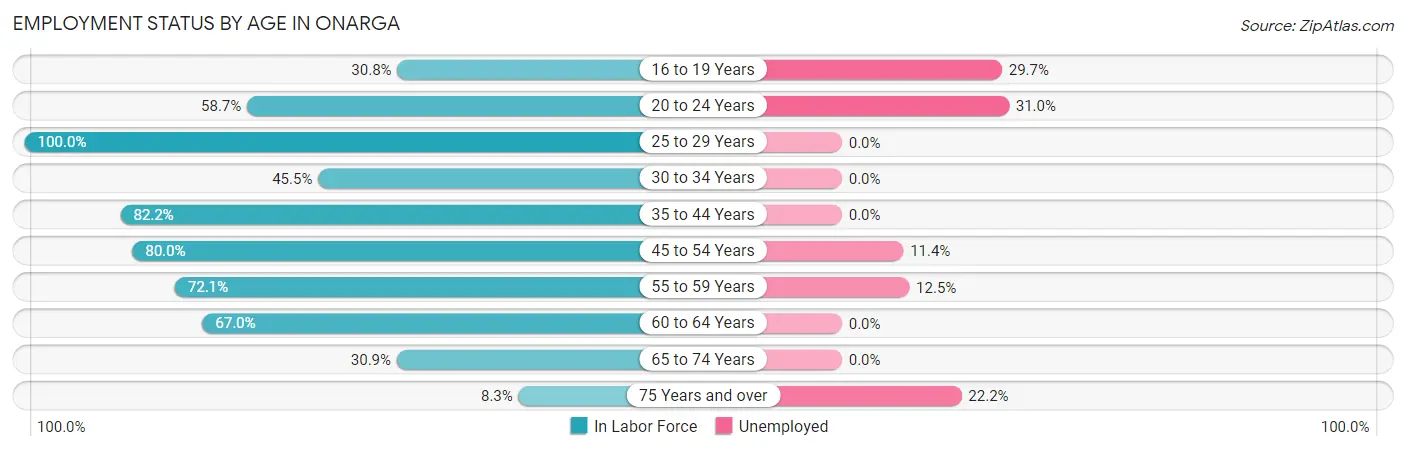
| Age Bracket | In Labor Force | Unemployed |
| 16 to 19 Years | 37 (30.8%) | 11 (29.7%) |
| 20 to 24 Years | 71 (58.7%) | 22 (31.0%) |
| 25 to 29 Years | 41 (100.0%) | 0 (0.0%) |
| 30 to 34 Years | 20 (45.5%) | 0 (0.0%) |
| 35 to 44 Years | 129 (82.2%) | 0 (0.0%) |
| 45 to 54 Years | 140 (80.0%) | 16 (11.4%) |
| 55 to 59 Years | 80 (72.1%) | 10 (12.5%) |
| 60 to 64 Years | 59 (67.0%) | 0 (0.0%) |
| 65 to 74 Years | 21 (30.9%) | 0 (0.0%) |
| 75 Years and over | 9 (8.3%) | 2 (22.2%) |
| Total | 607 (58.8%) | 61 (10.0%) |
Employment Status by Educational Attainment in Onarga
According to labor force statistics for Onarga, 76.1% of individuals (469) out of the total population between 25 and 64 years of age (616) are in the labor force, with 5.5% or 26 of them being unemployed. The group with the highest labor force participation rate are those with the educational attainment of bachelor's degree or higher, with 93.1% or 27 individuals in the labor force. Within the labor force, individuals with high school diploma education have the highest percentage of unemployment, with 9.8% or 12 of them being unemployed.
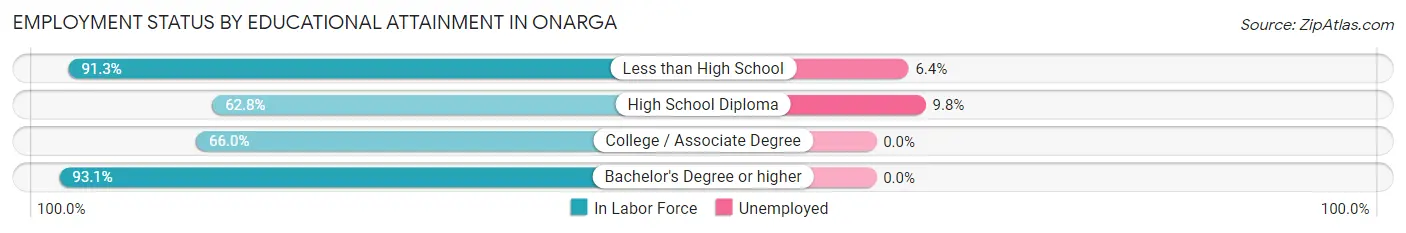
| Educational Attainment | In Labor Force | Unemployed |
| Less than High School | 220 (91.3%) | 15 (6.4%) |
| High School Diploma | 123 (62.8%) | 19 (9.8%) |
| College / Associate Degree | 99 (66.0%) | 0 (0.0%) |
| Bachelor's Degree or higher | 27 (93.1%) | 0 (0.0%) |
| Total | 469 (76.1%) | 34 (5.5%) |
Employment Occupations by Sex in Onarga
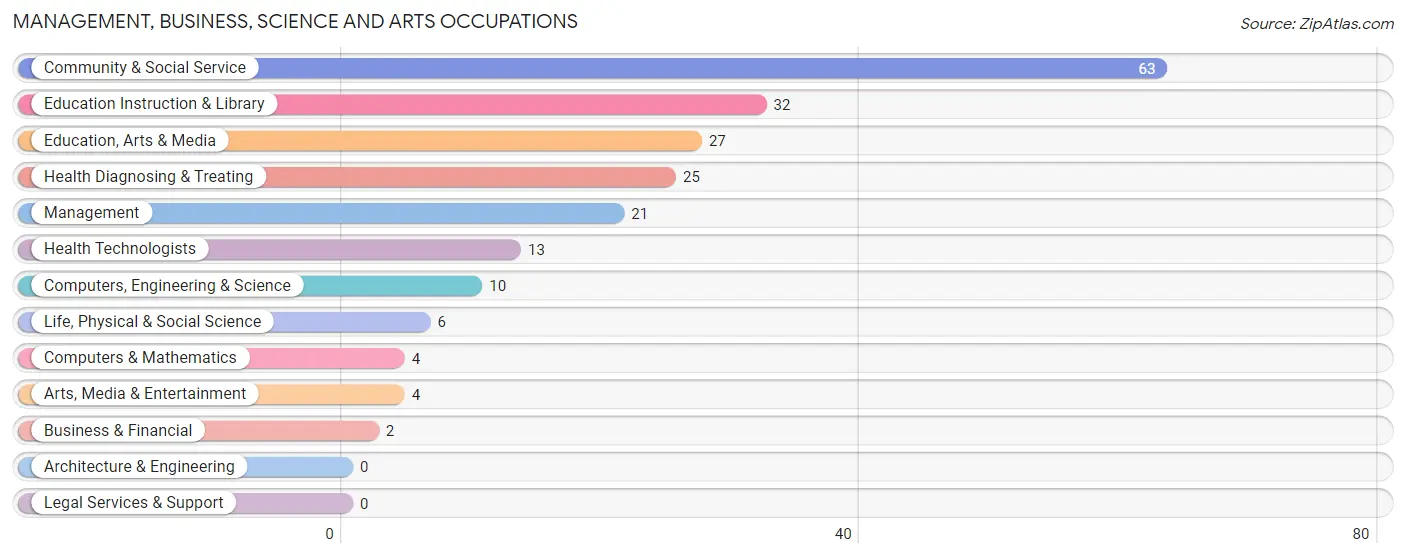
Management, Business, Science and Arts Occupations
The most common Management, Business, Science and Arts occupations in Onarga are Community & Social Service (63 | 11.5%), Education Instruction & Library (32 | 5.9%), Education, Arts & Media (27 | 5.0%), Health Diagnosing & Treating (25 | 4.6%), and Management (21 | 3.8%).
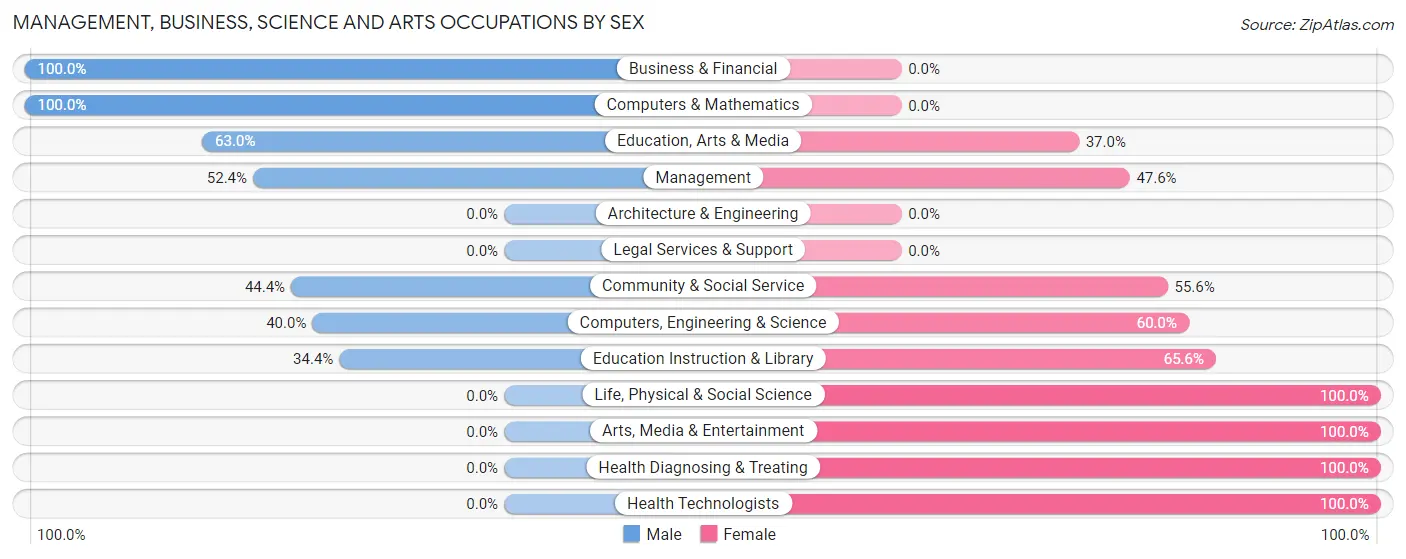
Management, Business, Science and Arts Occupations by Sex
Within the Management, Business, Science and Arts occupations in Onarga, the most male-oriented occupations are Business & Financial (100.0%), Computers & Mathematics (100.0%), and Education, Arts & Media (63.0%), while the most female-oriented occupations are Life, Physical & Social Science (100.0%), Arts, Media & Entertainment (100.0%), and Health Diagnosing & Treating (100.0%).
| Occupation | Male | Female |
| Management | 11 (52.4%) | 10 (47.6%) |
| Business & Financial | 2 (100.0%) | 0 (0.0%) |
| Computers, Engineering & Science | 4 (40.0%) | 6 (60.0%) |
| Computers & Mathematics | 4 (100.0%) | 0 (0.0%) |
| Architecture & Engineering | 0 (0.0%) | 0 (0.0%) |
| Life, Physical & Social Science | 0 (0.0%) | 6 (100.0%) |
| Community & Social Service | 28 (44.4%) | 35 (55.6%) |
| Education, Arts & Media | 17 (63.0%) | 10 (37.0%) |
| Legal Services & Support | 0 (0.0%) | 0 (0.0%) |
| Education Instruction & Library | 11 (34.4%) | 21 (65.6%) |
| Arts, Media & Entertainment | 0 (0.0%) | 4 (100.0%) |
| Health Diagnosing & Treating | 0 (0.0%) | 25 (100.0%) |
| Health Technologists | 0 (0.0%) | 13 (100.0%) |
| Total (Category) | 45 (37.2%) | 76 (62.8%) |
| Total (Overall) | 310 (56.8%) | 236 (43.2%) |
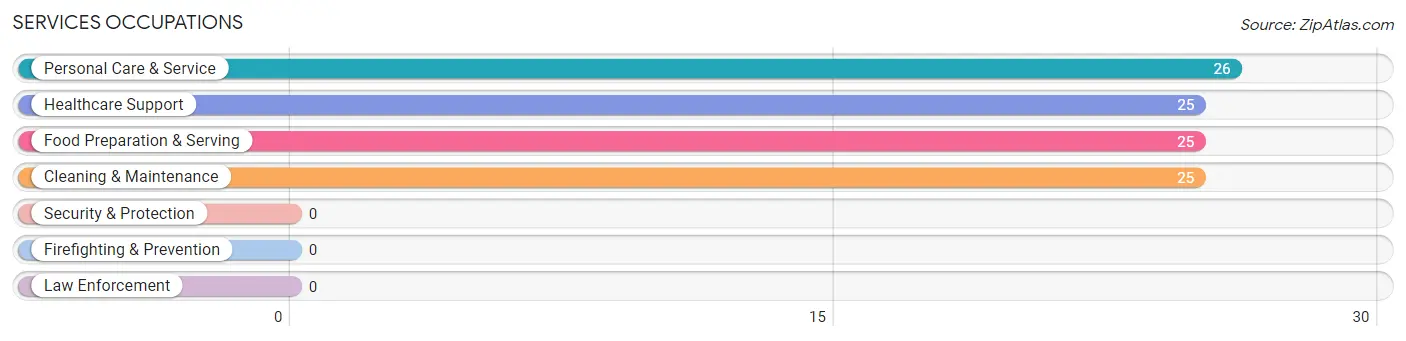
Services Occupations
The most common Services occupations in Onarga are Personal Care & Service (26 | 4.8%), Healthcare Support (25 | 4.6%), Food Preparation & Serving (25 | 4.6%), and Cleaning & Maintenance (25 | 4.6%).
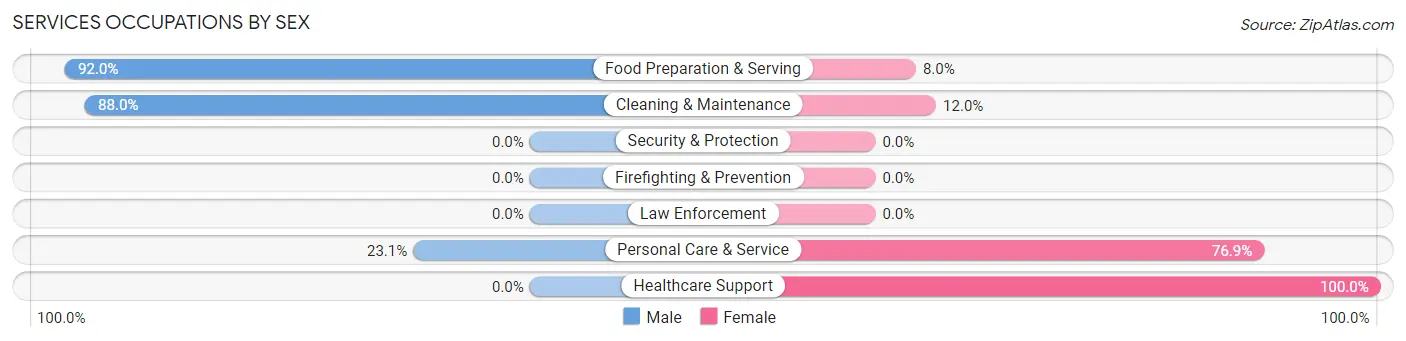
Services Occupations by Sex
Within the Services occupations in Onarga, the most male-oriented occupations are Food Preparation & Serving (92.0%), Cleaning & Maintenance (88.0%), and Personal Care & Service (23.1%), while the most female-oriented occupations are Healthcare Support (100.0%), Personal Care & Service (76.9%), and Cleaning & Maintenance (12.0%).
| Occupation | Male | Female |
| Healthcare Support | 0 (0.0%) | 25 (100.0%) |
| Security & Protection | 0 (0.0%) | 0 (0.0%) |
| Firefighting & Prevention | 0 (0.0%) | 0 (0.0%) |
| Law Enforcement | 0 (0.0%) | 0 (0.0%) |
| Food Preparation & Serving | 23 (92.0%) | 2 (8.0%) |
| Cleaning & Maintenance | 22 (88.0%) | 3 (12.0%) |
| Personal Care & Service | 6 (23.1%) | 20 (76.9%) |
| Total (Category) | 51 (50.5%) | 50 (49.5%) |
| Total (Overall) | 310 (56.8%) | 236 (43.2%) |
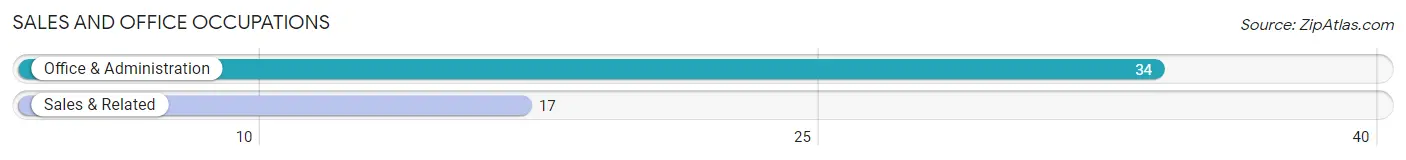
Sales and Office Occupations
The most common Sales and Office occupations in Onarga are Office & Administration (34 | 6.2%), and Sales & Related (17 | 3.1%).
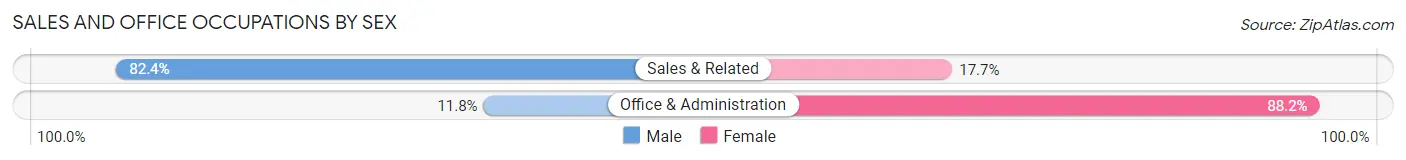
Sales and Office Occupations by Sex
| Occupation | Male | Female |
| Sales & Related | 14 (82.4%) | 3 (17.6%) |
| Office & Administration | 4 (11.8%) | 30 (88.2%) |
| Total (Category) | 18 (35.3%) | 33 (64.7%) |
| Total (Overall) | 310 (56.8%) | 236 (43.2%) |
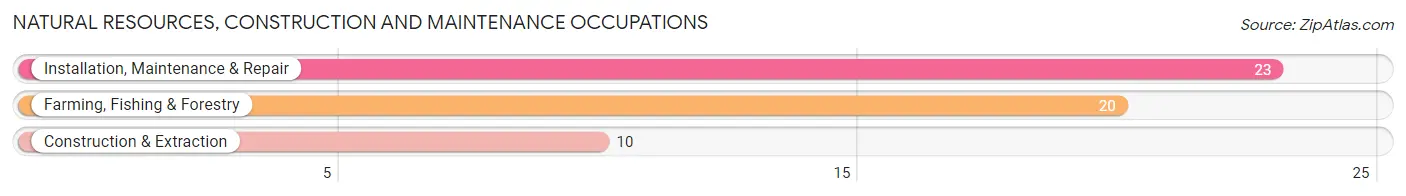
Natural Resources, Construction and Maintenance Occupations
The most common Natural Resources, Construction and Maintenance occupations in Onarga are Installation, Maintenance & Repair (23 | 4.2%), Farming, Fishing & Forestry (20 | 3.7%), and Construction & Extraction (10 | 1.8%).
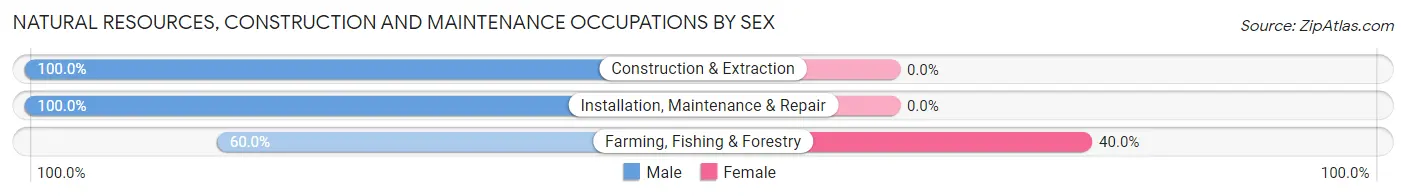
Natural Resources, Construction and Maintenance Occupations by Sex
| Occupation | Male | Female |
| Farming, Fishing & Forestry | 12 (60.0%) | 8 (40.0%) |
| Construction & Extraction | 10 (100.0%) | 0 (0.0%) |
| Installation, Maintenance & Repair | 23 (100.0%) | 0 (0.0%) |
| Total (Category) | 45 (84.9%) | 8 (15.1%) |
| Total (Overall) | 310 (56.8%) | 236 (43.2%) |
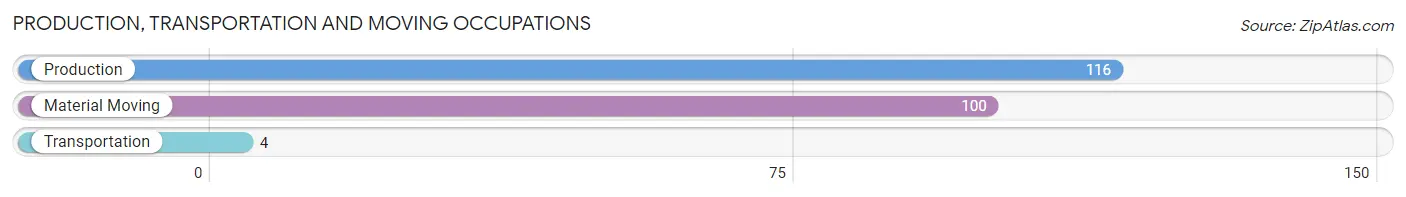
Production, Transportation and Moving Occupations
The most common Production, Transportation and Moving occupations in Onarga are Production (116 | 21.2%), Material Moving (100 | 18.3%), and Transportation (4 | 0.7%).
Production, Transportation and Moving Occupations by Sex
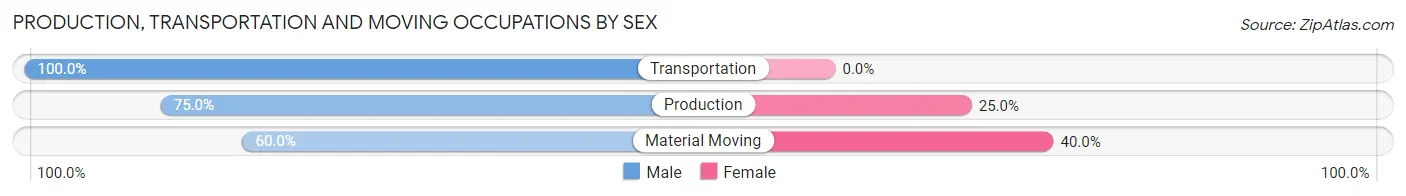
| Occupation | Male | Female |
| Production | 87 (75.0%) | 29 (25.0%) |
| Transportation | 4 (100.0%) | 0 (0.0%) |
| Material Moving | 60 (60.0%) | 40 (40.0%) |
| Total (Category) | 151 (68.6%) | 69 (31.4%) |
| Total (Overall) | 310 (56.8%) | 236 (43.2%) |
Employment Industries by Sex in Onarga
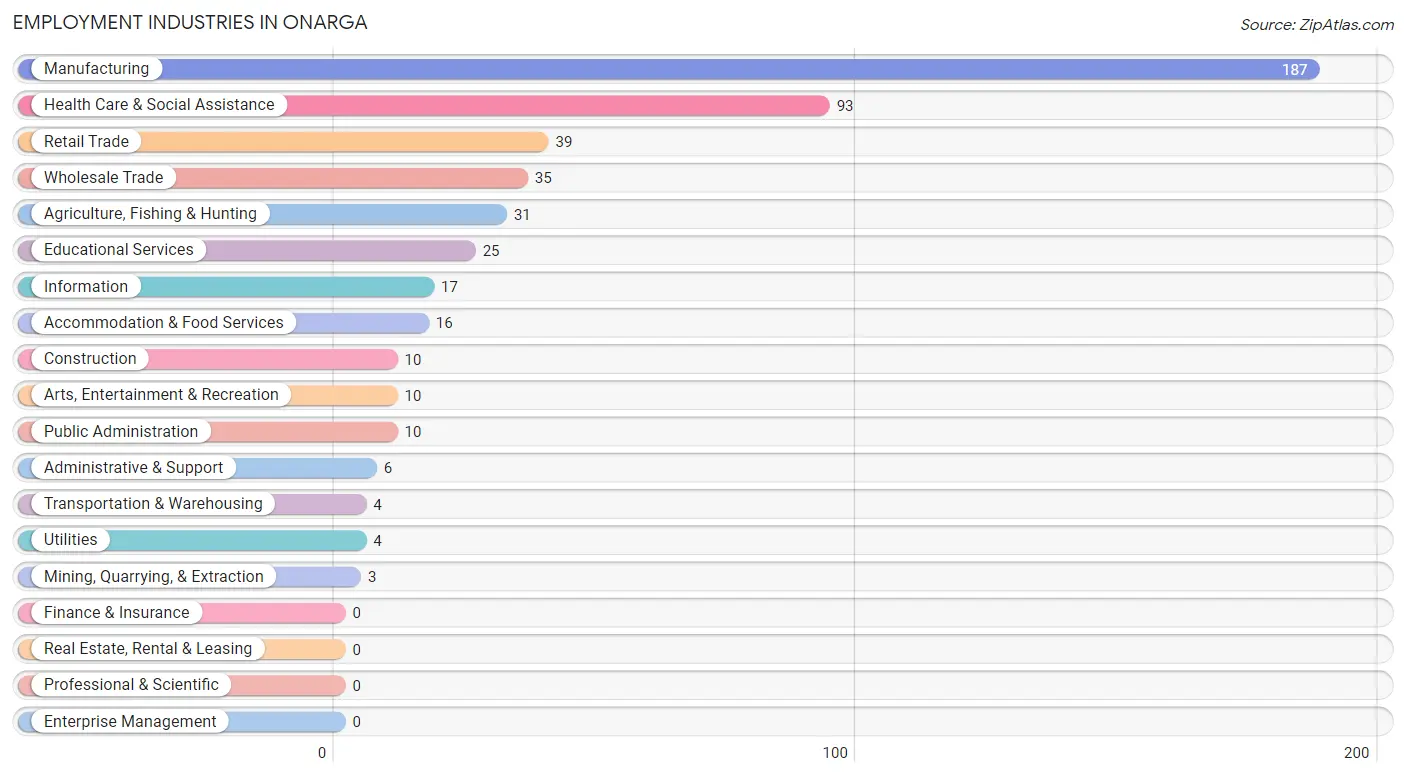
Employment Industries in Onarga
The major employment industries in Onarga include Manufacturing (187 | 34.3%), Health Care & Social Assistance (93 | 17.0%), Retail Trade (39 | 7.1%), Wholesale Trade (35 | 6.4%), and Agriculture, Fishing & Hunting (31 | 5.7%).
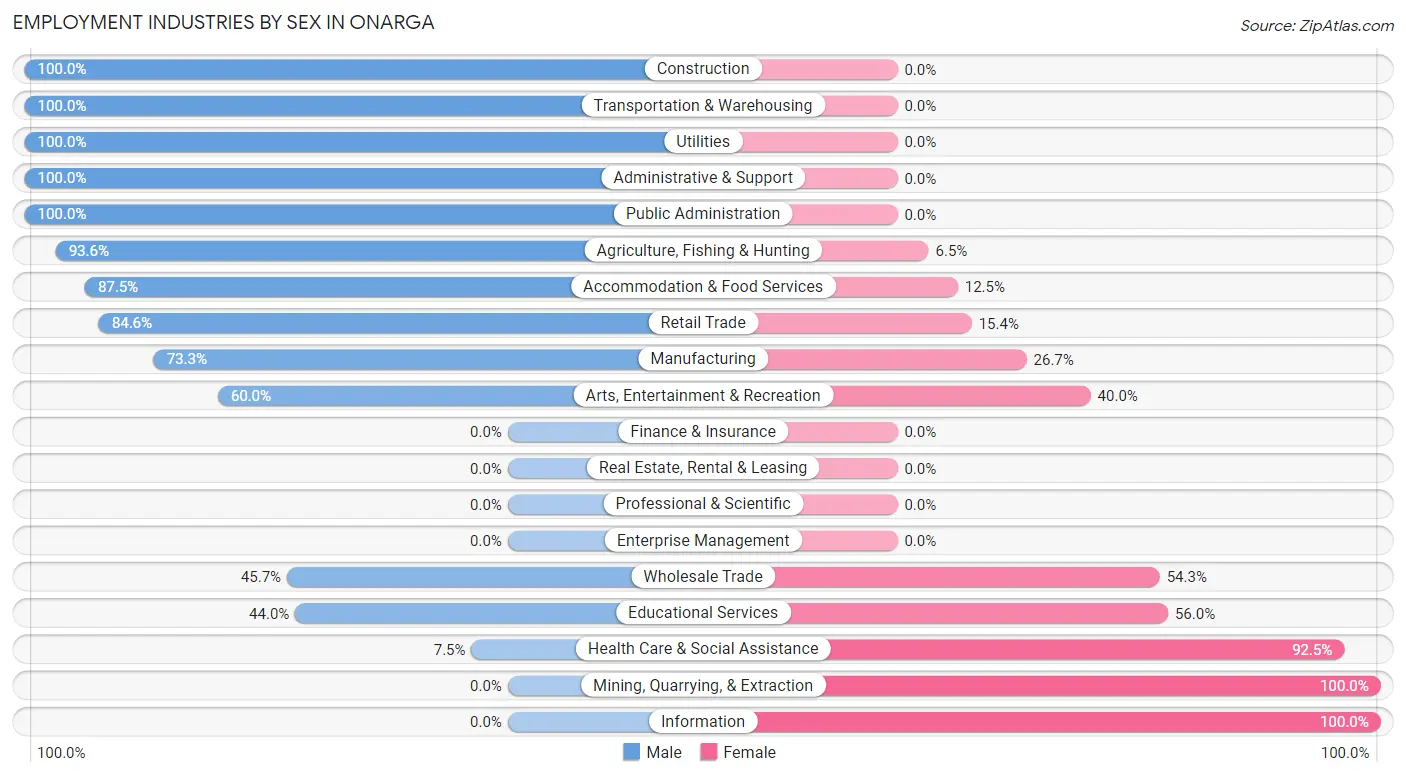
Employment Industries by Sex in Onarga
The Onarga industries that see more men than women are Construction (100.0%), Transportation & Warehousing (100.0%), and Utilities (100.0%), whereas the industries that tend to have a higher number of women are Mining, Quarrying, & Extraction (100.0%), Information (100.0%), and Health Care & Social Assistance (92.5%).
| Industry | Male | Female |
| Agriculture, Fishing & Hunting | 29 (93.5%) | 2 (6.5%) |
| Mining, Quarrying, & Extraction | 0 (0.0%) | 3 (100.0%) |
| Construction | 10 (100.0%) | 0 (0.0%) |
| Manufacturing | 137 (73.3%) | 50 (26.7%) |
| Wholesale Trade | 16 (45.7%) | 19 (54.3%) |
| Retail Trade | 33 (84.6%) | 6 (15.4%) |
| Transportation & Warehousing | 4 (100.0%) | 0 (0.0%) |
| Utilities | 4 (100.0%) | 0 (0.0%) |
| Information | 0 (0.0%) | 17 (100.0%) |
| Finance & Insurance | 0 (0.0%) | 0 (0.0%) |
| Real Estate, Rental & Leasing | 0 (0.0%) | 0 (0.0%) |
| Professional & Scientific | 0 (0.0%) | 0 (0.0%) |
| Enterprise Management | 0 (0.0%) | 0 (0.0%) |
| Administrative & Support | 6 (100.0%) | 0 (0.0%) |
| Educational Services | 11 (44.0%) | 14 (56.0%) |
| Health Care & Social Assistance | 7 (7.5%) | 86 (92.5%) |
| Arts, Entertainment & Recreation | 6 (60.0%) | 4 (40.0%) |
| Accommodation & Food Services | 14 (87.5%) | 2 (12.5%) |
| Public Administration | 10 (100.0%) | 0 (0.0%) |
| Total | 310 (56.8%) | 236 (43.2%) |
Education in Onarga
School Enrollment in Onarga
The most common levels of schooling among the 349 students in Onarga are high school (144 | 41.3%), elementary school (88 | 25.2%), and middle school (56 | 16.1%).
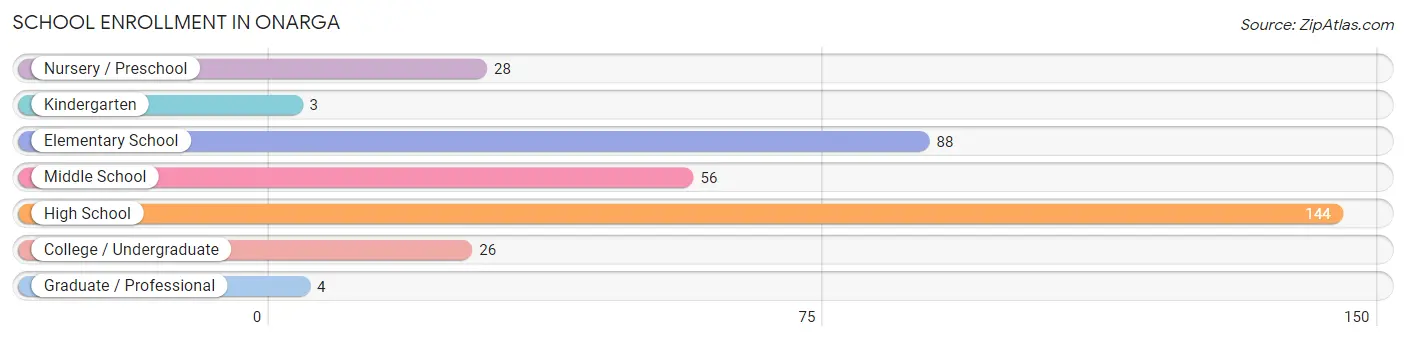
| School Level | # Students | % Students |
| Nursery / Preschool | 28 | 8.0% |
| Kindergarten | 3 | 0.9% |
| Elementary School | 88 | 25.2% |
| Middle School | 56 | 16.1% |
| High School | 144 | 41.3% |
| College / Undergraduate | 26 | 7.4% |
| Graduate / Professional | 4 | 1.1% |
| Total | 349 | 100.0% |
School Enrollment by Age by Funding Source in Onarga
Out of a total of 349 students who are enrolled in schools in Onarga, 48 (13.8%) attend a private institution, while the remaining 301 (86.2%) are enrolled in public schools. The age group of 20 to 24 year olds has the highest likelihood of being enrolled in private schools, with 8 (47.1% in the age bracket) enrolled. Conversely, the age group of 3 to 4 year olds has the lowest likelihood of being enrolled in a private school, with 4 (100.0% in the age bracket) attending a public institution.
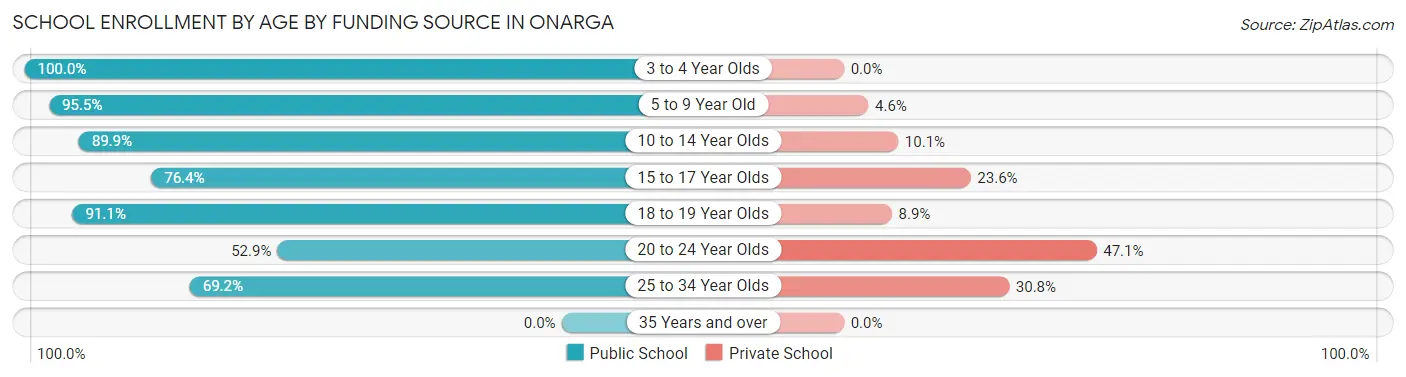
| Age Bracket | Public School | Private School |
| 3 to 4 Year Olds | 4 (100.0%) | 0 (0.0%) |
| 5 to 9 Year Old | 84 (95.5%) | 4 (4.5%) |
| 10 to 14 Year Olds | 89 (89.9%) | 10 (10.1%) |
| 15 to 17 Year Olds | 55 (76.4%) | 17 (23.6%) |
| 18 to 19 Year Olds | 51 (91.1%) | 5 (8.9%) |
| 20 to 24 Year Olds | 9 (52.9%) | 8 (47.1%) |
| 25 to 34 Year Olds | 9 (69.2%) | 4 (30.8%) |
| 35 Years and over | 0 (0.0%) | 0 (0.0%) |
| Total | 301 (86.2%) | 48 (13.8%) |
Educational Attainment by Field of Study in Onarga
Education (40 | 52.6%), business (7 | 9.2%), communications (7 | 9.2%), social sciences (5 | 6.6%), and computers & mathematics (4 | 5.3%) are the most common fields of study among 76 individuals in Onarga who have obtained a bachelor's degree or higher.
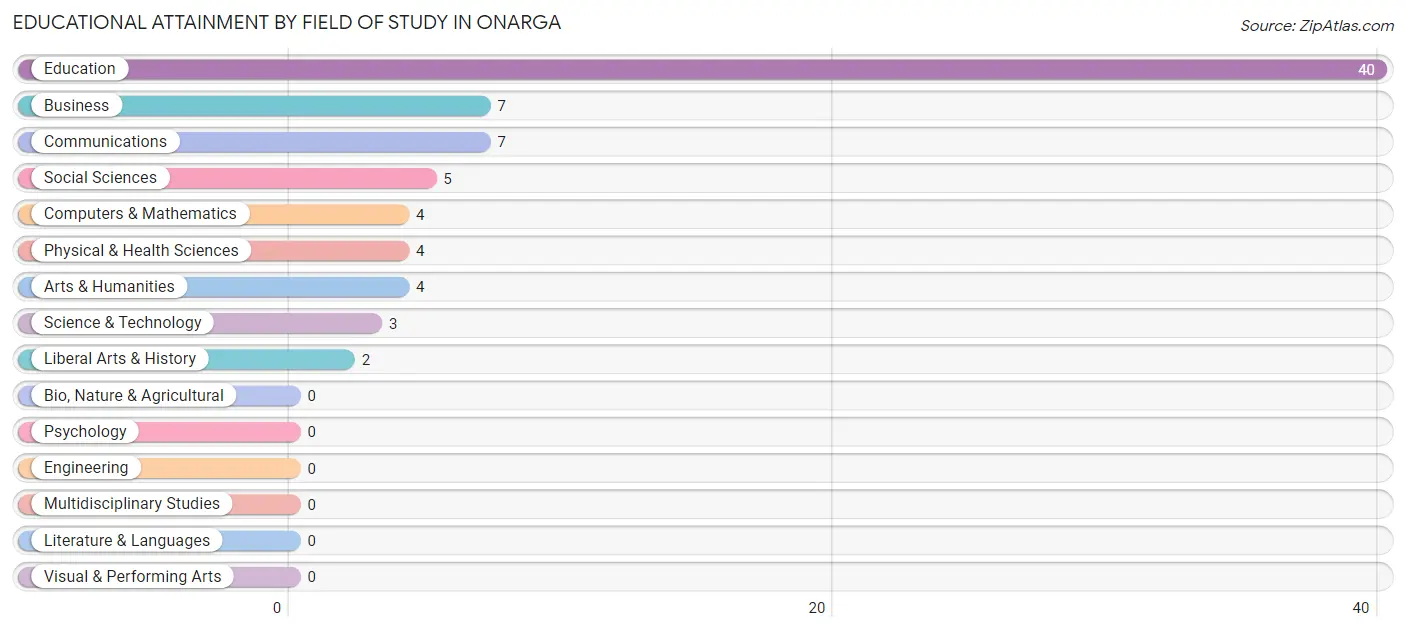
| Field of Study | # Graduates | % Graduates |
| Computers & Mathematics | 4 | 5.3% |
| Bio, Nature & Agricultural | 0 | 0.0% |
| Physical & Health Sciences | 4 | 5.3% |
| Psychology | 0 | 0.0% |
| Social Sciences | 5 | 6.6% |
| Engineering | 0 | 0.0% |
| Multidisciplinary Studies | 0 | 0.0% |
| Science & Technology | 3 | 4.0% |
| Business | 7 | 9.2% |
| Education | 40 | 52.6% |
| Literature & Languages | 0 | 0.0% |
| Liberal Arts & History | 2 | 2.6% |
| Visual & Performing Arts | 0 | 0.0% |
| Communications | 7 | 9.2% |
| Arts & Humanities | 4 | 5.3% |
| Total | 76 | 100.0% |
Transportation & Commute in Onarga
Vehicle Availability by Sex in Onarga
The most prevalent vehicle ownership categories in Onarga are males with 3 vehicles (116, accounting for 38.9%) and females with 3 vehicles (111, making up 49.1%).
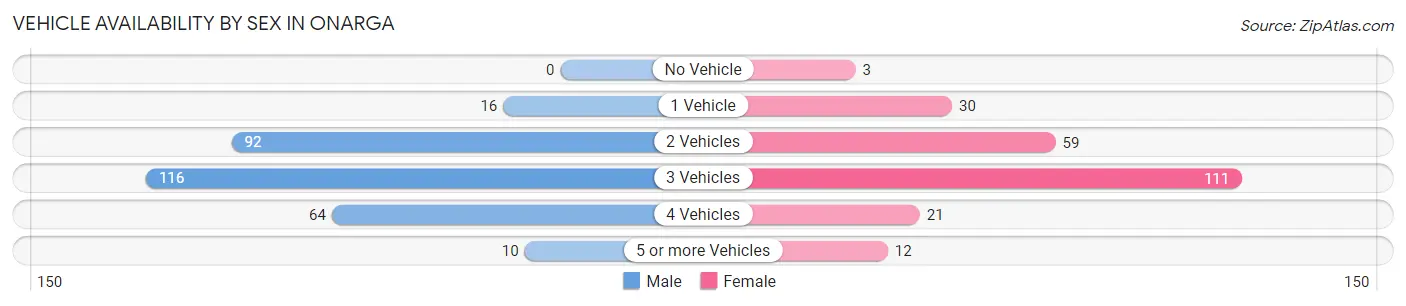
| Vehicles Available | Male | Female |
| No Vehicle | 0 (0.0%) | 3 (1.3%) |
| 1 Vehicle | 16 (5.4%) | 30 (12.7%) |
| 2 Vehicles | 92 (30.9%) | 59 (25.0%) |
| 3 Vehicles | 116 (38.9%) | 111 (47.0%) |
| 4 Vehicles | 64 (21.5%) | 21 (8.9%) |
| 5 or more Vehicles | 10 (3.4%) | 12 (5.1%) |
| Total | 298 (100.0%) | 236 (100.0%) |
Commute Time in Onarga
The most frequently occuring commute durations in Onarga are 10 to 14 minutes (116 commuters, 22.5%), 5 to 9 minutes (75 commuters, 14.6%), and 45 to 59 minutes (61 commuters, 11.8%).
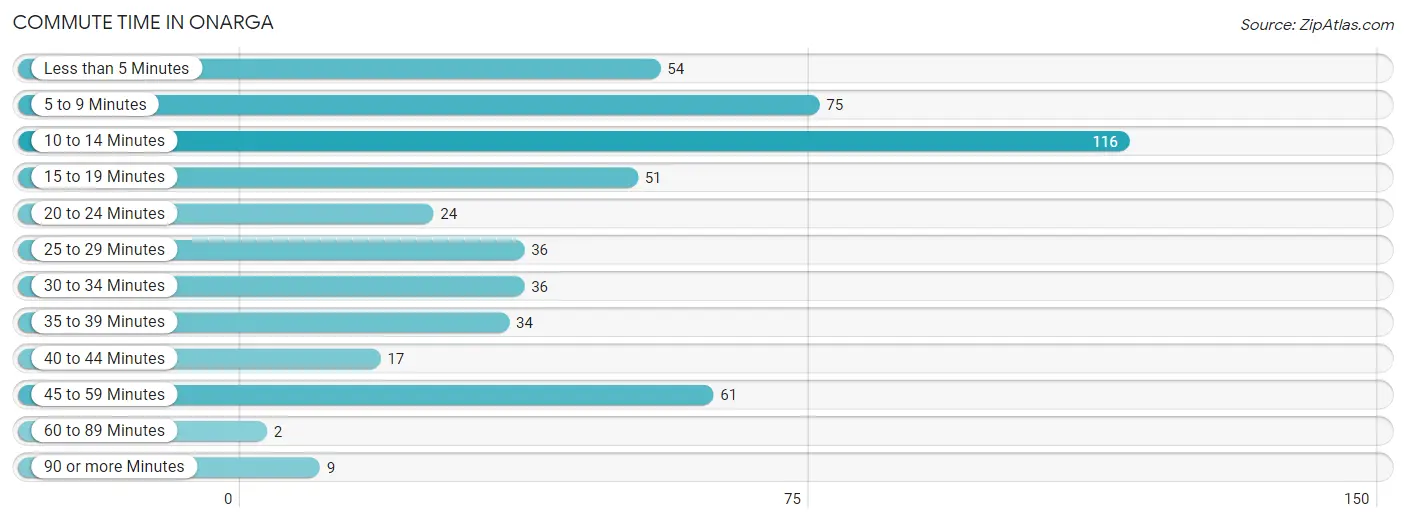
| Commute Time | # Commuters | % Commuters |
| Less than 5 Minutes | 54 | 10.5% |
| 5 to 9 Minutes | 75 | 14.6% |
| 10 to 14 Minutes | 116 | 22.5% |
| 15 to 19 Minutes | 51 | 9.9% |
| 20 to 24 Minutes | 24 | 4.7% |
| 25 to 29 Minutes | 36 | 7.0% |
| 30 to 34 Minutes | 36 | 7.0% |
| 35 to 39 Minutes | 34 | 6.6% |
| 40 to 44 Minutes | 17 | 3.3% |
| 45 to 59 Minutes | 61 | 11.8% |
| 60 to 89 Minutes | 2 | 0.4% |
| 90 or more Minutes | 9 | 1.8% |
Commute Time by Sex in Onarga
The most common commute times in Onarga are 10 to 14 minutes (63 commuters, 22.6%) for males and 10 to 14 minutes (53 commuters, 22.5%) for females.
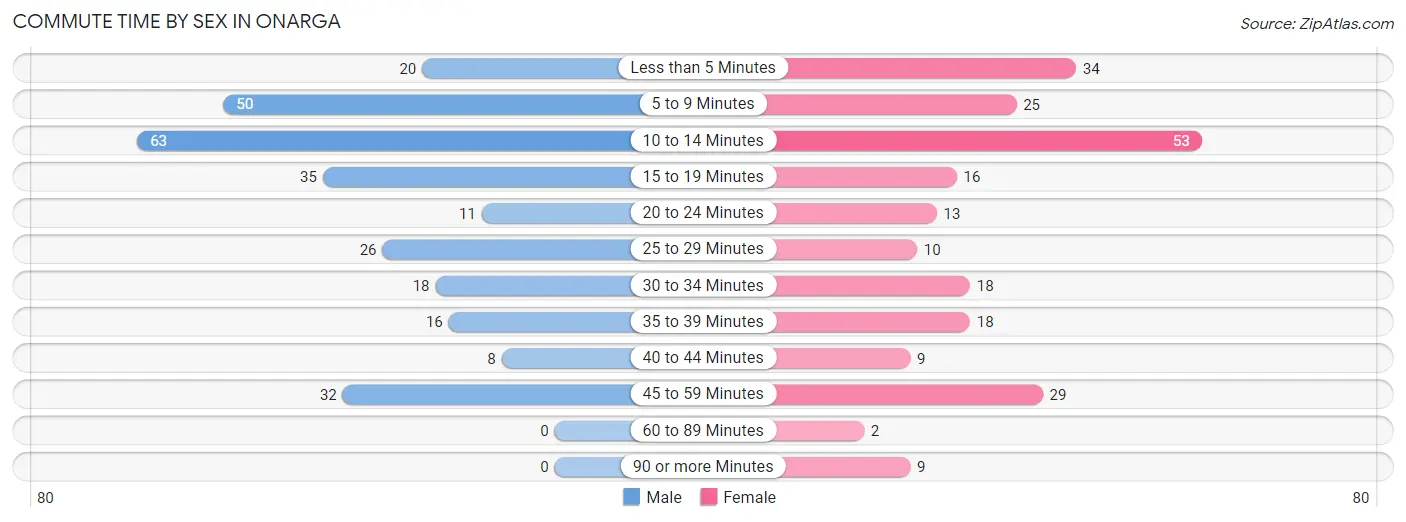
| Commute Time | Male | Female |
| Less than 5 Minutes | 20 (7.2%) | 34 (14.4%) |
| 5 to 9 Minutes | 50 (17.9%) | 25 (10.6%) |
| 10 to 14 Minutes | 63 (22.6%) | 53 (22.5%) |
| 15 to 19 Minutes | 35 (12.5%) | 16 (6.8%) |
| 20 to 24 Minutes | 11 (3.9%) | 13 (5.5%) |
| 25 to 29 Minutes | 26 (9.3%) | 10 (4.2%) |
| 30 to 34 Minutes | 18 (6.5%) | 18 (7.6%) |
| 35 to 39 Minutes | 16 (5.7%) | 18 (7.6%) |
| 40 to 44 Minutes | 8 (2.9%) | 9 (3.8%) |
| 45 to 59 Minutes | 32 (11.5%) | 29 (12.3%) |
| 60 to 89 Minutes | 0 (0.0%) | 2 (0.9%) |
| 90 or more Minutes | 0 (0.0%) | 9 (3.8%) |
Time of Departure to Work by Sex in Onarga
The most frequent times of departure to work in Onarga are 6:30 AM to 6:59 AM (57, 20.4%) for males and 8:00 AM to 8:29 AM (45, 19.1%) for females.
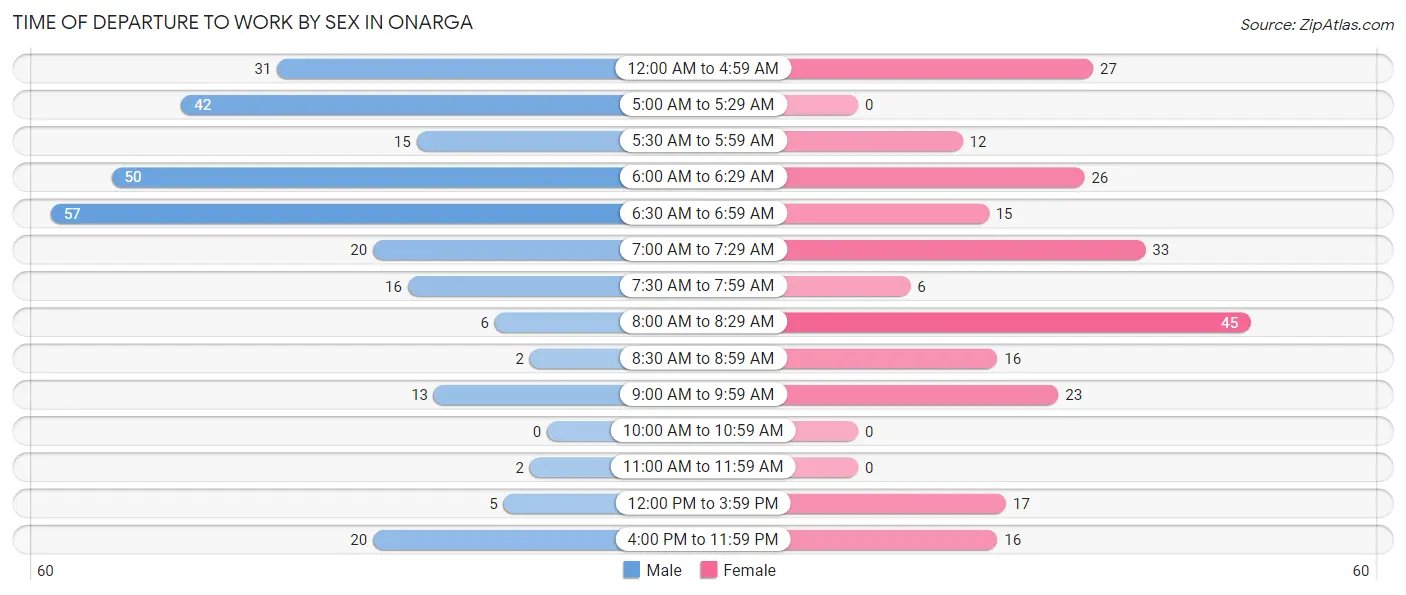
| Time of Departure | Male | Female |
| 12:00 AM to 4:59 AM | 31 (11.1%) | 27 (11.4%) |
| 5:00 AM to 5:29 AM | 42 (15.0%) | 0 (0.0%) |
| 5:30 AM to 5:59 AM | 15 (5.4%) | 12 (5.1%) |
| 6:00 AM to 6:29 AM | 50 (17.9%) | 26 (11.0%) |
| 6:30 AM to 6:59 AM | 57 (20.4%) | 15 (6.4%) |
| 7:00 AM to 7:29 AM | 20 (7.2%) | 33 (14.0%) |
| 7:30 AM to 7:59 AM | 16 (5.7%) | 6 (2.5%) |
| 8:00 AM to 8:29 AM | 6 (2.1%) | 45 (19.1%) |
| 8:30 AM to 8:59 AM | 2 (0.7%) | 16 (6.8%) |
| 9:00 AM to 9:59 AM | 13 (4.7%) | 23 (9.8%) |
| 10:00 AM to 10:59 AM | 0 (0.0%) | 0 (0.0%) |
| 11:00 AM to 11:59 AM | 2 (0.7%) | 0 (0.0%) |
| 12:00 PM to 3:59 PM | 5 (1.8%) | 17 (7.2%) |
| 4:00 PM to 11:59 PM | 20 (7.2%) | 16 (6.8%) |
| Total | 279 (100.0%) | 236 (100.0%) |
Housing Occupancy in Onarga
Occupancy by Ownership in Onarga
Of the total 444 dwellings in Onarga, owner-occupied units account for 384 (86.5%), while renter-occupied units make up 60 (13.5%).
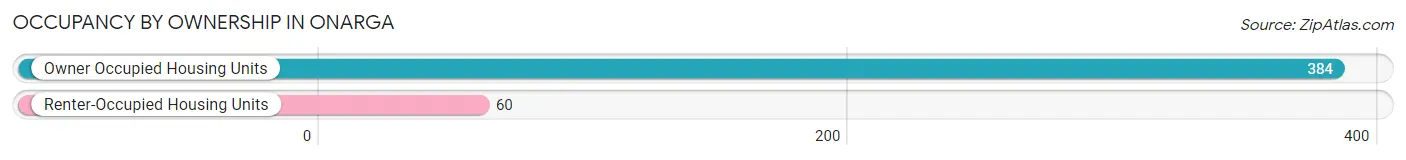
| Occupancy | # Housing Units | % Housing Units |
| Owner Occupied Housing Units | 384 | 86.5% |
| Renter-Occupied Housing Units | 60 | 13.5% |
| Total Occupied Housing Units | 444 | 100.0% |
Occupancy by Household Size in Onarga
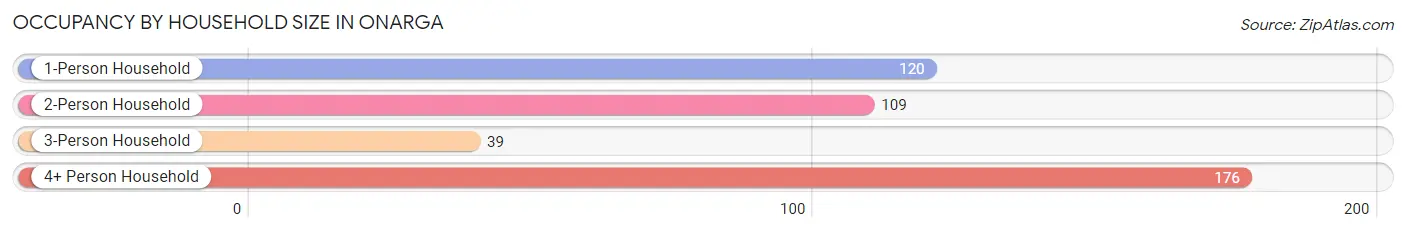
| Household Size | # Housing Units | % Housing Units |
| 1-Person Household | 120 | 27.0% |
| 2-Person Household | 109 | 24.5% |
| 3-Person Household | 39 | 8.8% |
| 4+ Person Household | 176 | 39.6% |
| Total Housing Units | 444 | 100.0% |
Occupancy by Ownership by Household Size in Onarga
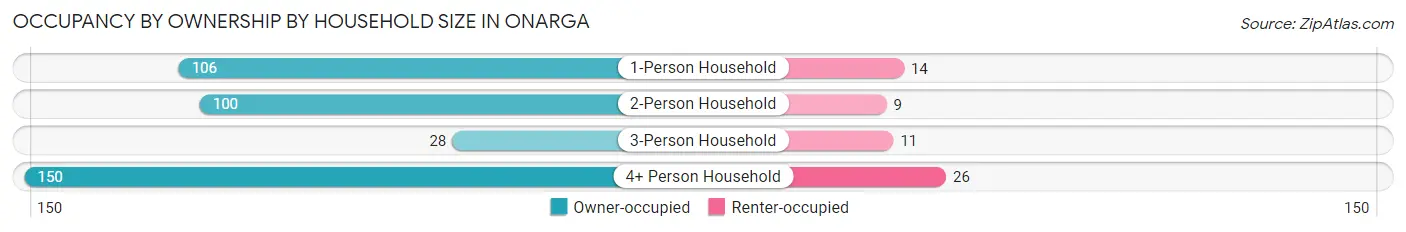
| Household Size | Owner-occupied | Renter-occupied |
| 1-Person Household | 106 (88.3%) | 14 (11.7%) |
| 2-Person Household | 100 (91.7%) | 9 (8.3%) |
| 3-Person Household | 28 (71.8%) | 11 (28.2%) |
| 4+ Person Household | 150 (85.2%) | 26 (14.8%) |
| Total Housing Units | 384 (86.5%) | 60 (13.5%) |
Occupancy by Educational Attainment in Onarga
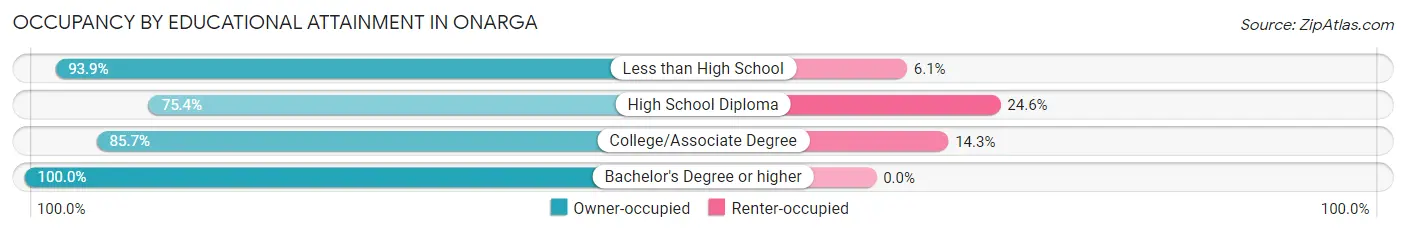
| Household Size | Owner-occupied | Renter-occupied |
| Less than High School | 139 (93.9%) | 9 (6.1%) |
| High School Diploma | 101 (75.4%) | 33 (24.6%) |
| College/Associate Degree | 108 (85.7%) | 18 (14.3%) |
| Bachelor's Degree or higher | 36 (100.0%) | 0 (0.0%) |
Occupancy by Age of Householder in Onarga
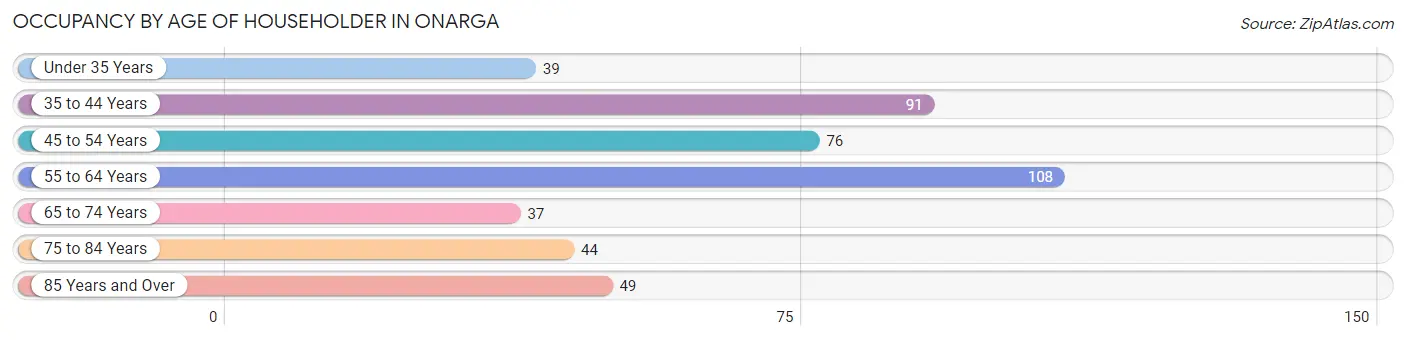
| Age Bracket | # Households | % Households |
| Under 35 Years | 39 | 8.8% |
| 35 to 44 Years | 91 | 20.5% |
| 45 to 54 Years | 76 | 17.1% |
| 55 to 64 Years | 108 | 24.3% |
| 65 to 74 Years | 37 | 8.3% |
| 75 to 84 Years | 44 | 9.9% |
| 85 Years and Over | 49 | 11.0% |
| Total | 444 | 100.0% |
Housing Finances in Onarga
Median Income by Occupancy in Onarga
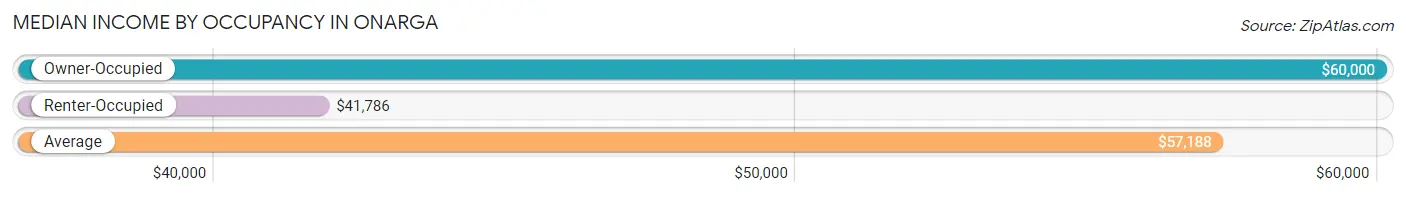
| Occupancy Type | # Households | Median Income |
| Owner-Occupied | 384 (86.5%) | $60,000 |
| Renter-Occupied | 60 (13.5%) | $41,786 |
| Average | 444 (100.0%) | $57,188 |
Occupancy by Householder Income Bracket in Onarga
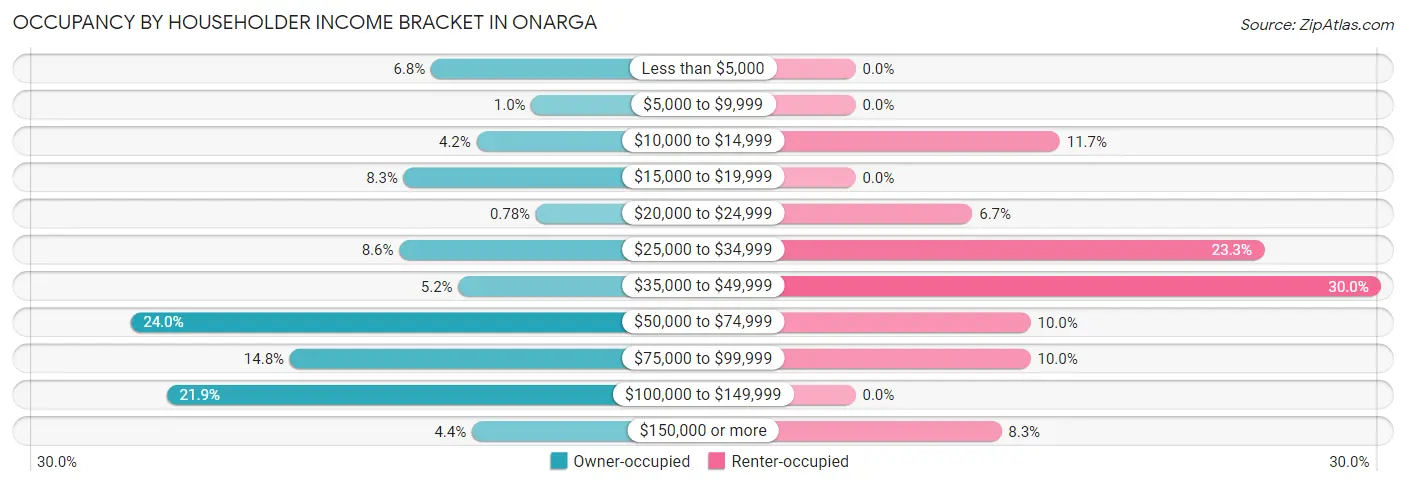
| Income Bracket | Owner-occupied | Renter-occupied |
| Less than $5,000 | 26 (6.8%) | 0 (0.0%) |
| $5,000 to $9,999 | 4 (1.0%) | 0 (0.0%) |
| $10,000 to $14,999 | 16 (4.2%) | 7 (11.7%) |
| $15,000 to $19,999 | 32 (8.3%) | 0 (0.0%) |
| $20,000 to $24,999 | 3 (0.8%) | 4 (6.7%) |
| $25,000 to $34,999 | 33 (8.6%) | 14 (23.3%) |
| $35,000 to $49,999 | 20 (5.2%) | 18 (30.0%) |
| $50,000 to $74,999 | 92 (24.0%) | 6 (10.0%) |
| $75,000 to $99,999 | 57 (14.8%) | 6 (10.0%) |
| $100,000 to $149,999 | 84 (21.9%) | 0 (0.0%) |
| $150,000 or more | 17 (4.4%) | 5 (8.3%) |
| Total | 384 (100.0%) | 60 (100.0%) |
Monthly Housing Cost Tiers in Onarga
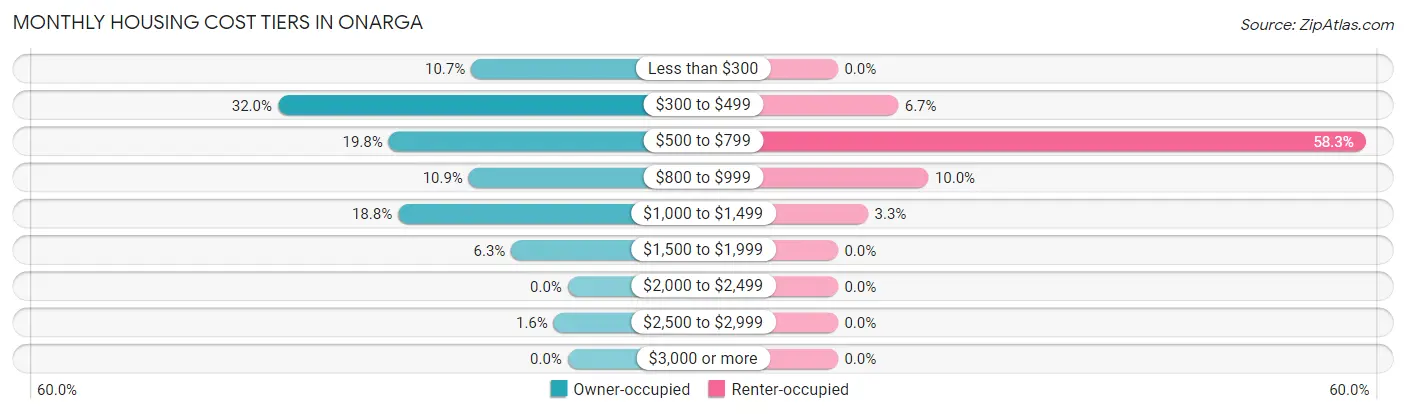
| Monthly Cost | Owner-occupied | Renter-occupied |
| Less than $300 | 41 (10.7%) | 0 (0.0%) |
| $300 to $499 | 123 (32.0%) | 4 (6.7%) |
| $500 to $799 | 76 (19.8%) | 35 (58.3%) |
| $800 to $999 | 42 (10.9%) | 6 (10.0%) |
| $1,000 to $1,499 | 72 (18.8%) | 2 (3.3%) |
| $1,500 to $1,999 | 24 (6.2%) | 0 (0.0%) |
| $2,000 to $2,499 | 0 (0.0%) | 0 (0.0%) |
| $2,500 to $2,999 | 6 (1.6%) | 0 (0.0%) |
| $3,000 or more | 0 (0.0%) | 0 (0.0%) |
| Total | 384 (100.0%) | 60 (100.0%) |
Physical Housing Characteristics in Onarga
Housing Structures in Onarga
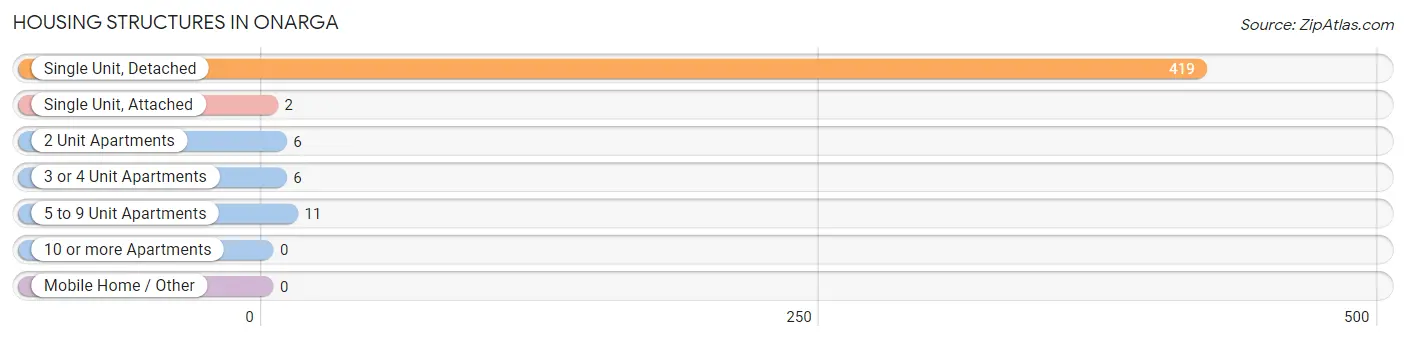
| Structure Type | # Housing Units | % Housing Units |
| Single Unit, Detached | 419 | 94.4% |
| Single Unit, Attached | 2 | 0.4% |
| 2 Unit Apartments | 6 | 1.3% |
| 3 or 4 Unit Apartments | 6 | 1.3% |
| 5 to 9 Unit Apartments | 11 | 2.5% |
| 10 or more Apartments | 0 | 0.0% |
| Mobile Home / Other | 0 | 0.0% |
| Total | 444 | 100.0% |
Housing Structures by Occupancy in Onarga
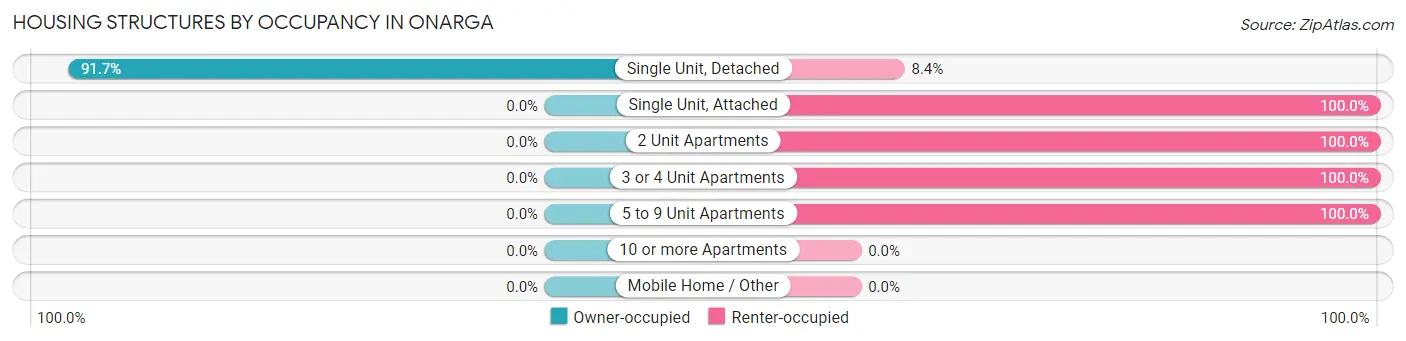
| Structure Type | Owner-occupied | Renter-occupied |
| Single Unit, Detached | 384 (91.6%) | 35 (8.4%) |
| Single Unit, Attached | 0 (0.0%) | 2 (100.0%) |
| 2 Unit Apartments | 0 (0.0%) | 6 (100.0%) |
| 3 or 4 Unit Apartments | 0 (0.0%) | 6 (100.0%) |
| 5 to 9 Unit Apartments | 0 (0.0%) | 11 (100.0%) |
| 10 or more Apartments | 0 (0.0%) | 0 (0.0%) |
| Mobile Home / Other | 0 (0.0%) | 0 (0.0%) |
| Total | 384 (86.5%) | 60 (13.5%) |
Housing Structures by Number of Rooms in Onarga
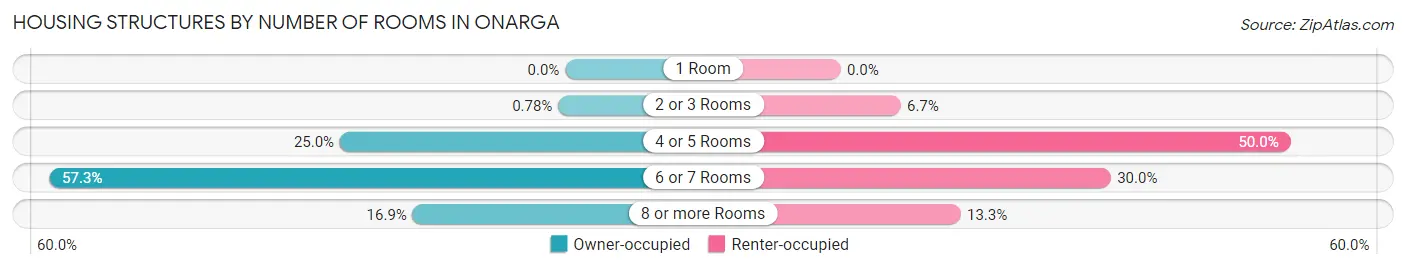
| Number of Rooms | Owner-occupied | Renter-occupied |
| 1 Room | 0 (0.0%) | 0 (0.0%) |
| 2 or 3 Rooms | 3 (0.8%) | 4 (6.7%) |
| 4 or 5 Rooms | 96 (25.0%) | 30 (50.0%) |
| 6 or 7 Rooms | 220 (57.3%) | 18 (30.0%) |
| 8 or more Rooms | 65 (16.9%) | 8 (13.3%) |
| Total | 384 (100.0%) | 60 (100.0%) |
Housing Structure by Heating Type in Onarga
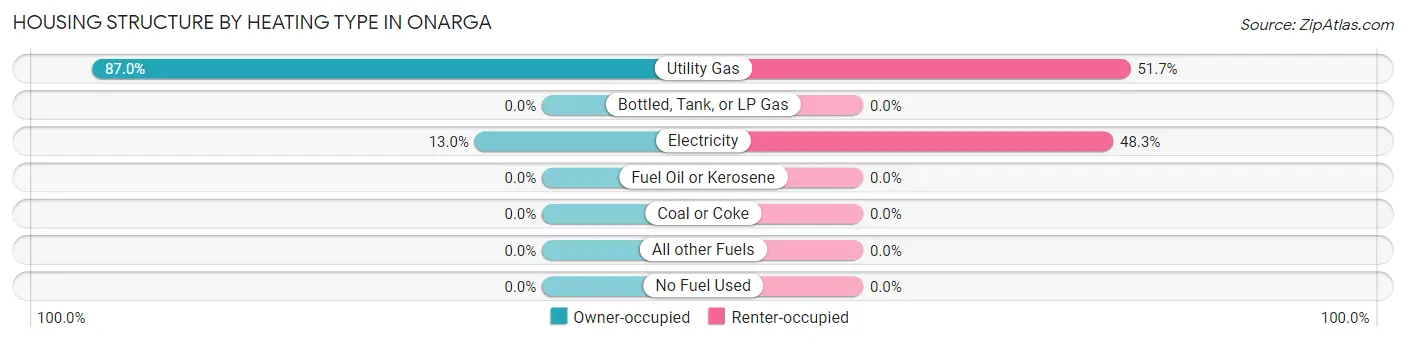
| Heating Type | Owner-occupied | Renter-occupied |
| Utility Gas | 334 (87.0%) | 31 (51.7%) |
| Bottled, Tank, or LP Gas | 0 (0.0%) | 0 (0.0%) |
| Electricity | 50 (13.0%) | 29 (48.3%) |
| Fuel Oil or Kerosene | 0 (0.0%) | 0 (0.0%) |
| Coal or Coke | 0 (0.0%) | 0 (0.0%) |
| All other Fuels | 0 (0.0%) | 0 (0.0%) |
| No Fuel Used | 0 (0.0%) | 0 (0.0%) |
| Total | 384 (100.0%) | 60 (100.0%) |
Household Vehicle Usage in Onarga
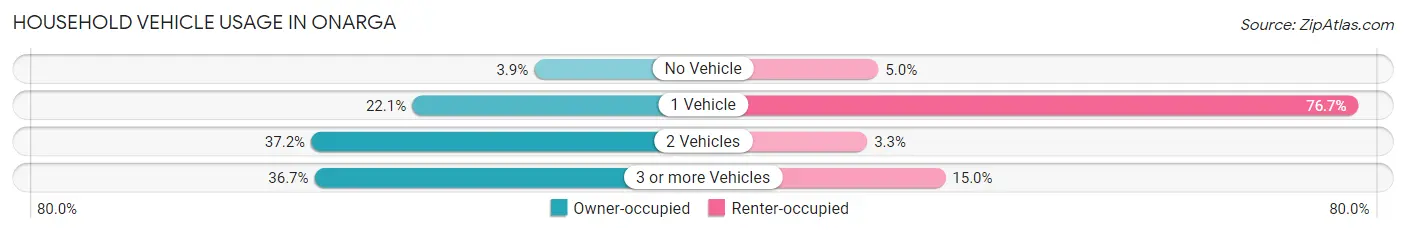
| Vehicles per Household | Owner-occupied | Renter-occupied |
| No Vehicle | 15 (3.9%) | 3 (5.0%) |
| 1 Vehicle | 85 (22.1%) | 46 (76.7%) |
| 2 Vehicles | 143 (37.2%) | 2 (3.3%) |
| 3 or more Vehicles | 141 (36.7%) | 9 (15.0%) |
| Total | 384 (100.0%) | 60 (100.0%) |
Real Estate & Mortgages in Onarga
Real Estate and Mortgage Overview in Onarga
| Characteristic | Without Mortgage | With Mortgage |
| Housing Units | 235 | 149 |
| Median Property Value | $91,900 | $105,900 |
| Median Household Income | $54,135 | $11 |
| Monthly Housing Costs | $435 | $0 |
| Real Estate Taxes | $1,557 | $0 |
Property Value by Mortgage Status in Onarga
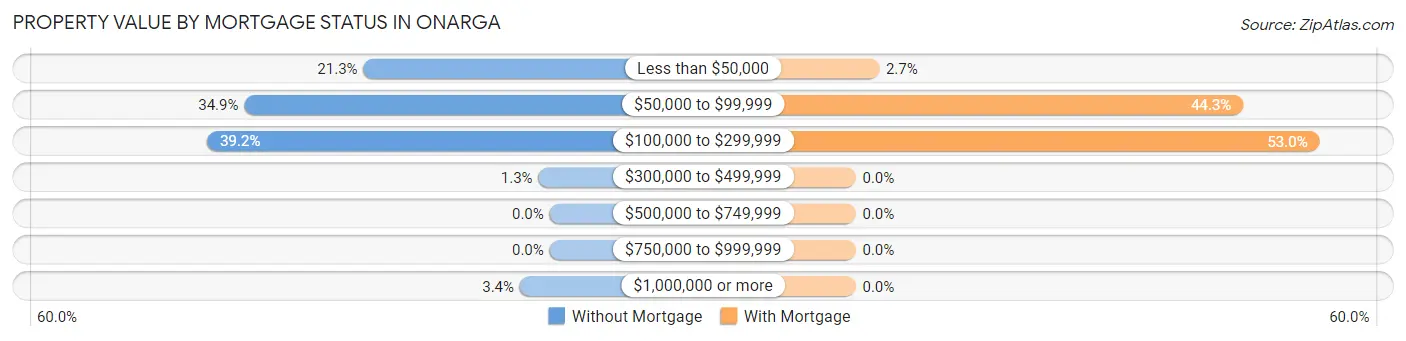
| Property Value | Without Mortgage | With Mortgage |
| Less than $50,000 | 50 (21.3%) | 4 (2.7%) |
| $50,000 to $99,999 | 82 (34.9%) | 66 (44.3%) |
| $100,000 to $299,999 | 92 (39.2%) | 79 (53.0%) |
| $300,000 to $499,999 | 3 (1.3%) | 0 (0.0%) |
| $500,000 to $749,999 | 0 (0.0%) | 0 (0.0%) |
| $750,000 to $999,999 | 0 (0.0%) | 0 (0.0%) |
| $1,000,000 or more | 8 (3.4%) | 0 (0.0%) |
| Total | 235 (100.0%) | 149 (100.0%) |
Household Income by Mortgage Status in Onarga
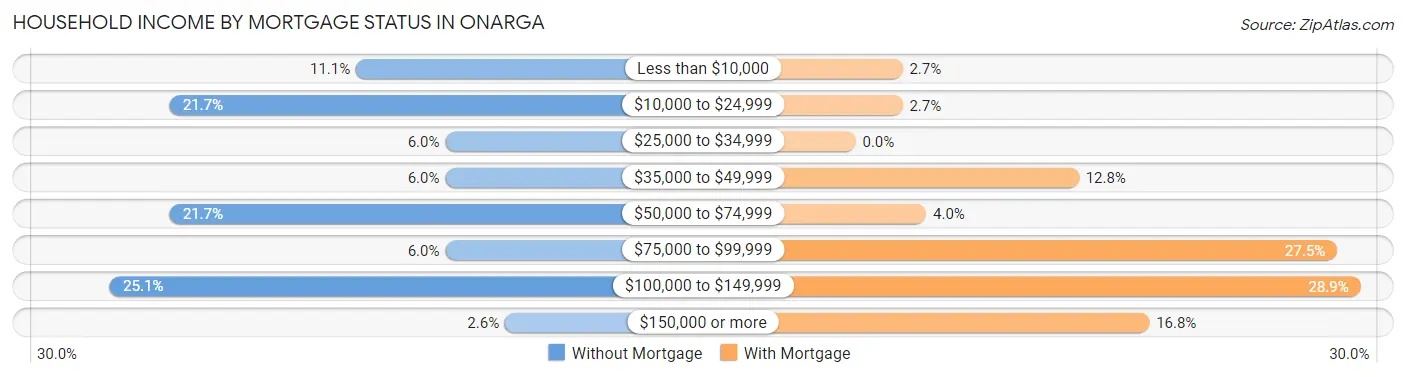
| Household Income | Without Mortgage | With Mortgage |
| Less than $10,000 | 26 (11.1%) | 4 (2.7%) |
| $10,000 to $24,999 | 51 (21.7%) | 4 (2.7%) |
| $25,000 to $34,999 | 14 (6.0%) | 0 (0.0%) |
| $35,000 to $49,999 | 14 (6.0%) | 19 (12.8%) |
| $50,000 to $74,999 | 51 (21.7%) | 6 (4.0%) |
| $75,000 to $99,999 | 14 (6.0%) | 41 (27.5%) |
| $100,000 to $149,999 | 59 (25.1%) | 43 (28.9%) |
| $150,000 or more | 6 (2.5%) | 25 (16.8%) |
| Total | 235 (100.0%) | 149 (100.0%) |
Property Value to Household Income Ratio in Onarga
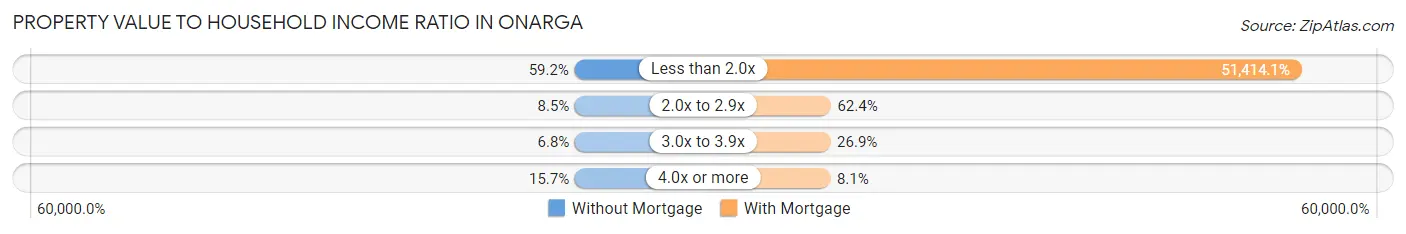
| Value-to-Income Ratio | Without Mortgage | With Mortgage |
| Less than 2.0x | 139 (59.2%) | 76,607 (51,414.1%) |
| 2.0x to 2.9x | 20 (8.5%) | 93 (62.4%) |
| 3.0x to 3.9x | 16 (6.8%) | 40 (26.9%) |
| 4.0x or more | 37 (15.7%) | 12 (8.1%) |
| Total | 235 (100.0%) | 149 (100.0%) |
Real Estate Taxes by Mortgage Status in Onarga
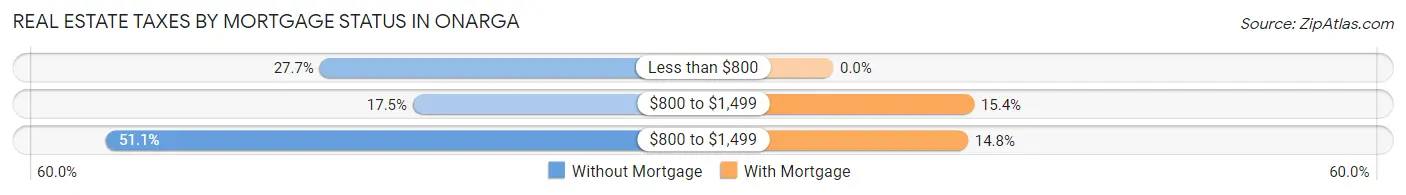
| Property Taxes | Without Mortgage | With Mortgage |
| Less than $800 | 65 (27.7%) | 0 (0.0%) |
| $800 to $1,499 | 41 (17.4%) | 23 (15.4%) |
| $800 to $1,499 | 120 (51.1%) | 22 (14.8%) |
| Total | 235 (100.0%) | 149 (100.0%) |
Health & Disability in Onarga
Health Insurance Coverage by Age in Onarga
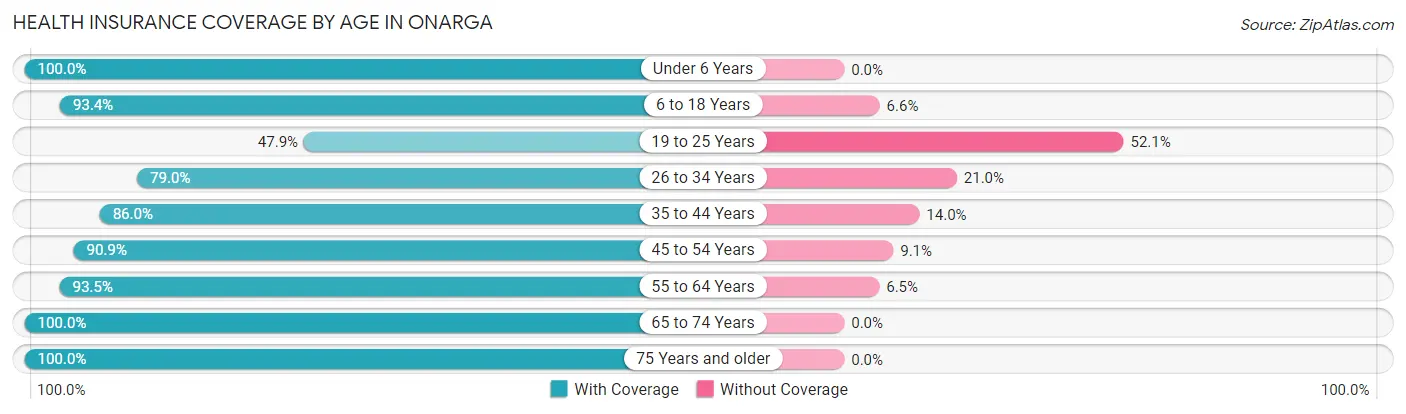
| Age Bracket | With Coverage | Without Coverage |
| Under 6 Years | 71 (100.0%) | 0 (0.0%) |
| 6 to 18 Years | 241 (93.4%) | 17 (6.6%) |
| 19 to 25 Years | 69 (47.9%) | 75 (52.1%) |
| 26 to 34 Years | 64 (79.0%) | 17 (21.0%) |
| 35 to 44 Years | 135 (86.0%) | 22 (14.0%) |
| 45 to 54 Years | 159 (90.9%) | 16 (9.1%) |
| 55 to 64 Years | 186 (93.5%) | 13 (6.5%) |
| 65 to 74 Years | 68 (100.0%) | 0 (0.0%) |
| 75 Years and older | 108 (100.0%) | 0 (0.0%) |
| Total | 1,101 (87.3%) | 160 (12.7%) |
Health Insurance Coverage by Citizenship Status in Onarga
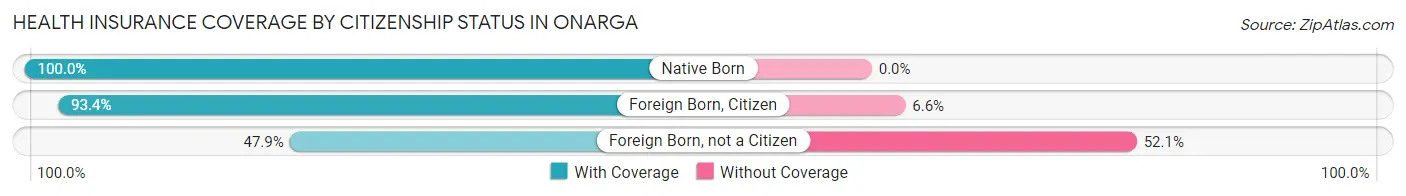
| Citizenship Status | With Coverage | Without Coverage |
| Native Born | 71 (100.0%) | 0 (0.0%) |
| Foreign Born, Citizen | 241 (93.4%) | 17 (6.6%) |
| Foreign Born, not a Citizen | 69 (47.9%) | 75 (52.1%) |
Health Insurance Coverage by Household Income in Onarga
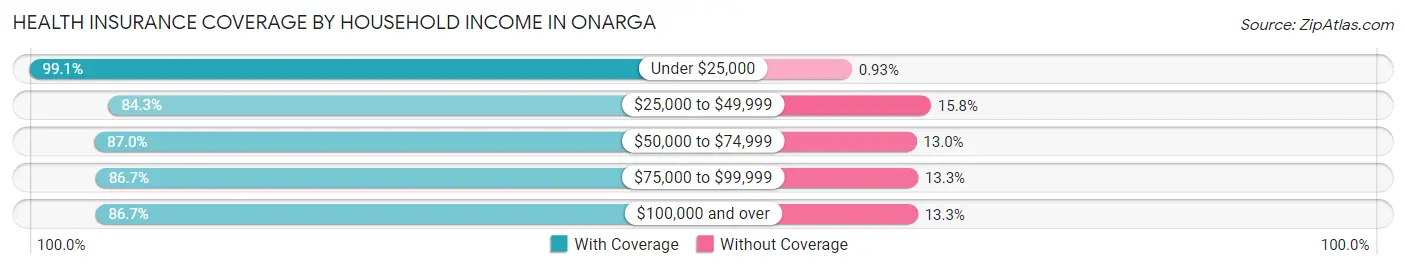
| Household Income | With Coverage | Without Coverage |
| Under $25,000 | 107 (99.1%) | 1 (0.9%) |
| $25,000 to $49,999 | 214 (84.3%) | 40 (15.8%) |
| $50,000 to $74,999 | 200 (87.0%) | 30 (13.0%) |
| $75,000 to $99,999 | 247 (86.7%) | 38 (13.3%) |
| $100,000 and over | 333 (86.7%) | 51 (13.3%) |
Public vs Private Health Insurance Coverage by Age in Onarga
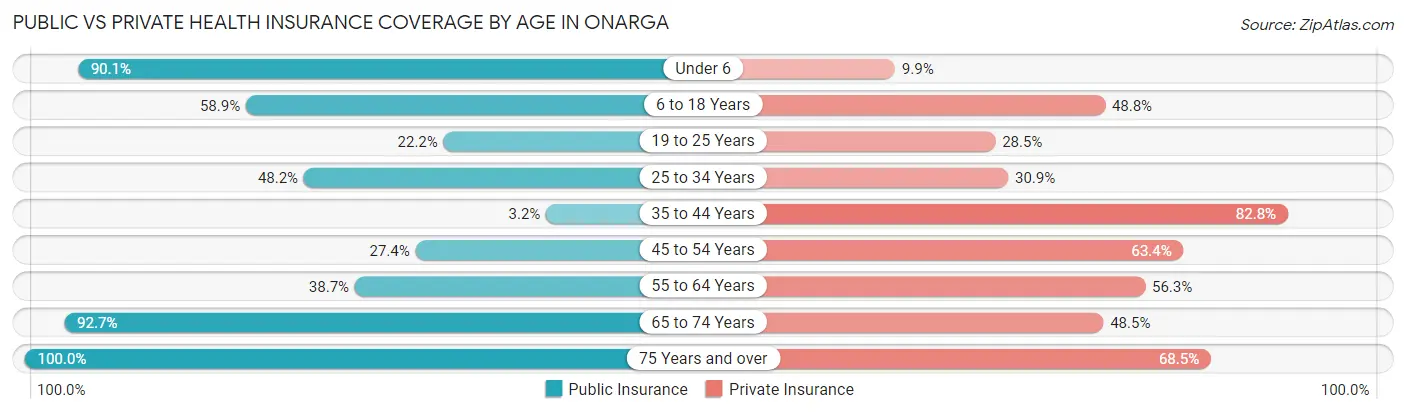
| Age Bracket | Public Insurance | Private Insurance |
| Under 6 | 64 (90.1%) | 7 (9.9%) |
| 6 to 18 Years | 152 (58.9%) | 126 (48.8%) |
| 19 to 25 Years | 32 (22.2%) | 41 (28.5%) |
| 25 to 34 Years | 39 (48.1%) | 25 (30.9%) |
| 35 to 44 Years | 5 (3.2%) | 130 (82.8%) |
| 45 to 54 Years | 48 (27.4%) | 111 (63.4%) |
| 55 to 64 Years | 77 (38.7%) | 112 (56.3%) |
| 65 to 74 Years | 63 (92.6%) | 33 (48.5%) |
| 75 Years and over | 108 (100.0%) | 74 (68.5%) |
| Total | 588 (46.6%) | 659 (52.3%) |
Disability Status by Sex by Age in Onarga
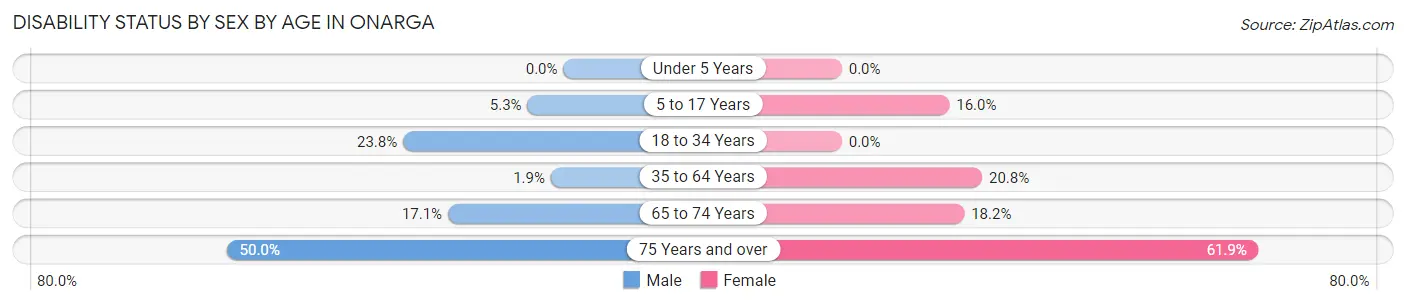
| Age Bracket | Male | Female |
| Under 5 Years | 0 (0.0%) | 0 (0.0%) |
| 5 to 17 Years | 8 (5.3%) | 15 (16.0%) |
| 18 to 34 Years | 25 (23.8%) | 0 (0.0%) |
| 35 to 64 Years | 5 (1.9%) | 55 (20.8%) |
| 65 to 74 Years | 6 (17.1%) | 6 (18.2%) |
| 75 Years and over | 12 (50.0%) | 52 (61.9%) |
Disability Class by Sex by Age in Onarga
Disability Class: Hearing Difficulty
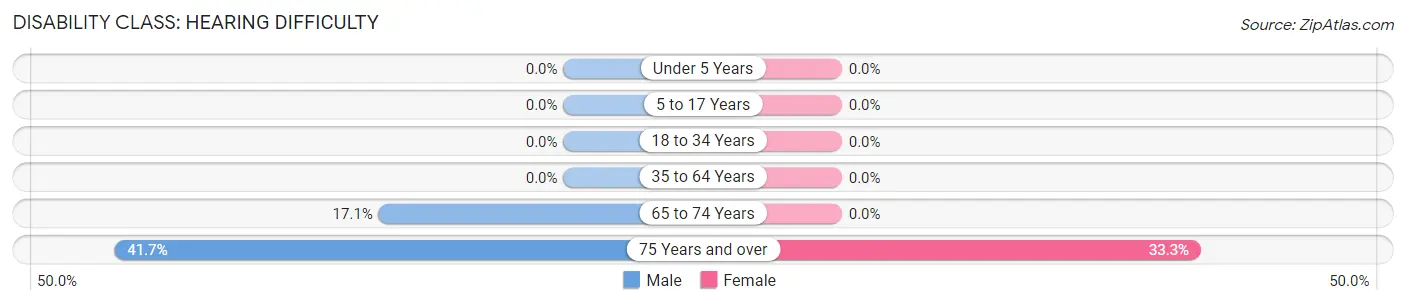
| Age Bracket | Male | Female |
| Under 5 Years | 0 (0.0%) | 0 (0.0%) |
| 5 to 17 Years | 0 (0.0%) | 0 (0.0%) |
| 18 to 34 Years | 0 (0.0%) | 0 (0.0%) |
| 35 to 64 Years | 0 (0.0%) | 0 (0.0%) |
| 65 to 74 Years | 6 (17.1%) | 0 (0.0%) |
| 75 Years and over | 10 (41.7%) | 28 (33.3%) |
Disability Class: Vision Difficulty
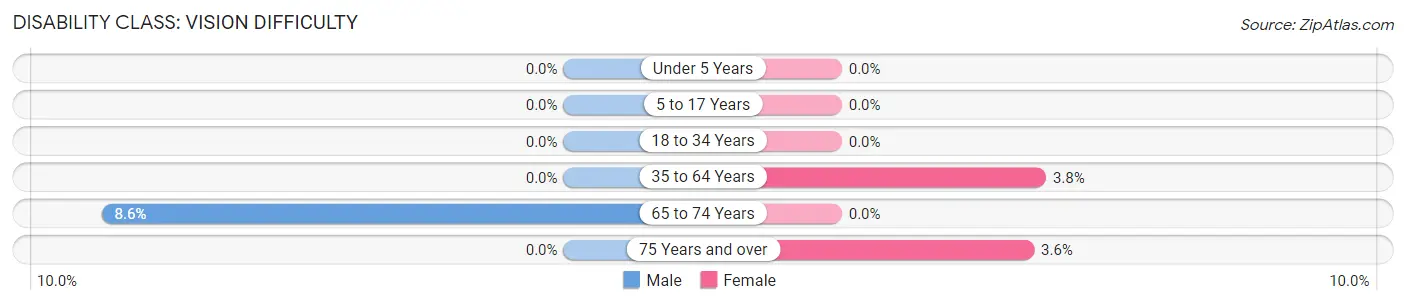
| Age Bracket | Male | Female |
| Under 5 Years | 0 (0.0%) | 0 (0.0%) |
| 5 to 17 Years | 0 (0.0%) | 0 (0.0%) |
| 18 to 34 Years | 0 (0.0%) | 0 (0.0%) |
| 35 to 64 Years | 0 (0.0%) | 10 (3.8%) |
| 65 to 74 Years | 3 (8.6%) | 0 (0.0%) |
| 75 Years and over | 0 (0.0%) | 3 (3.6%) |
Disability Class: Cognitive Difficulty
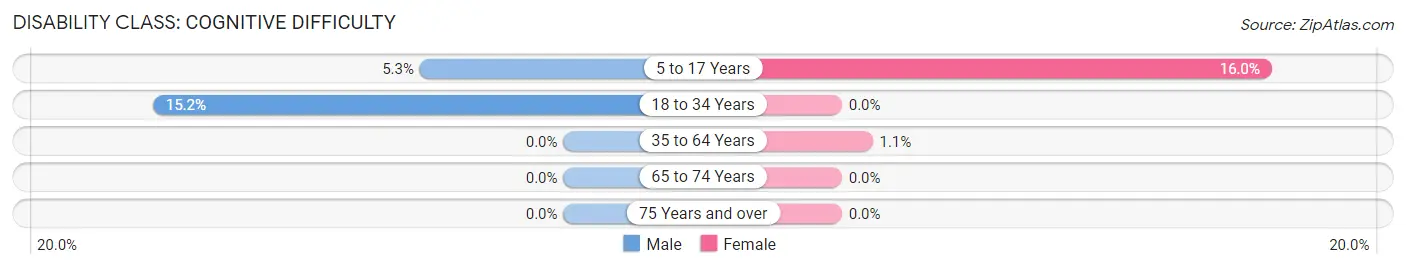
| Age Bracket | Male | Female |
| 5 to 17 Years | 8 (5.3%) | 15 (16.0%) |
| 18 to 34 Years | 16 (15.2%) | 0 (0.0%) |
| 35 to 64 Years | 0 (0.0%) | 3 (1.1%) |
| 65 to 74 Years | 0 (0.0%) | 0 (0.0%) |
| 75 Years and over | 0 (0.0%) | 0 (0.0%) |
Disability Class: Ambulatory Difficulty
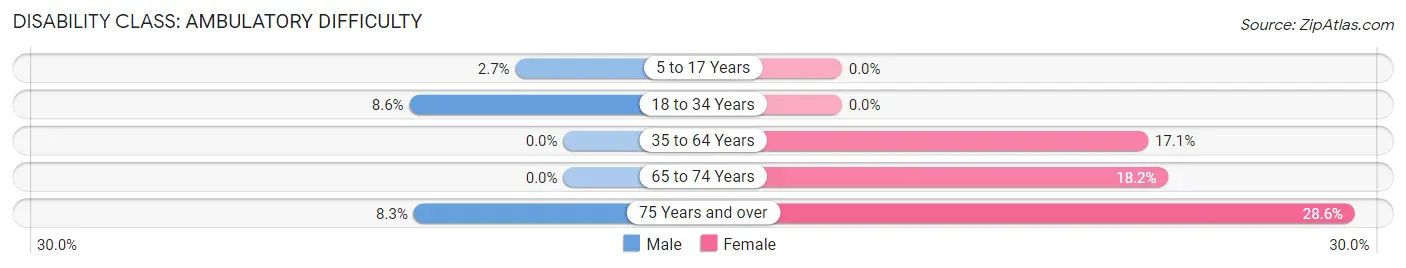
| Age Bracket | Male | Female |
| 5 to 17 Years | 4 (2.7%) | 0 (0.0%) |
| 18 to 34 Years | 9 (8.6%) | 0 (0.0%) |
| 35 to 64 Years | 0 (0.0%) | 45 (17.1%) |
| 65 to 74 Years | 0 (0.0%) | 6 (18.2%) |
| 75 Years and over | 2 (8.3%) | 24 (28.6%) |
Disability Class: Self-Care Difficulty
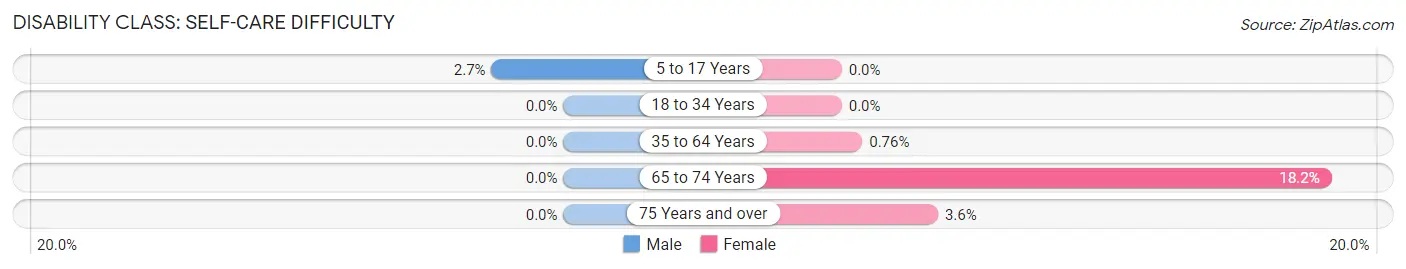
| Age Bracket | Male | Female |
| 5 to 17 Years | 4 (2.7%) | 0 (0.0%) |
| 18 to 34 Years | 0 (0.0%) | 0 (0.0%) |
| 35 to 64 Years | 0 (0.0%) | 2 (0.8%) |
| 65 to 74 Years | 0 (0.0%) | 6 (18.2%) |
| 75 Years and over | 0 (0.0%) | 3 (3.6%) |
Technology Access in Onarga
Computing Device Access in Onarga
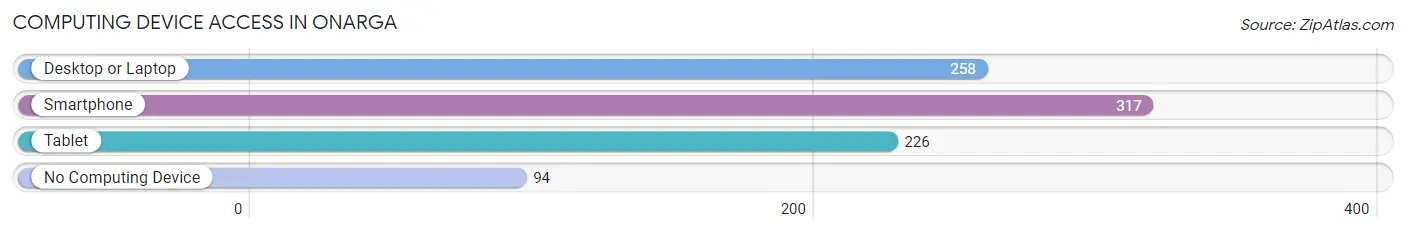
| Device Type | # Households | % Households |
| Desktop or Laptop | 258 | 58.1% |
| Smartphone | 317 | 71.4% |
| Tablet | 226 | 50.9% |
| No Computing Device | 94 | 21.2% |
| Total | 444 | 100.0% |
Internet Access in Onarga
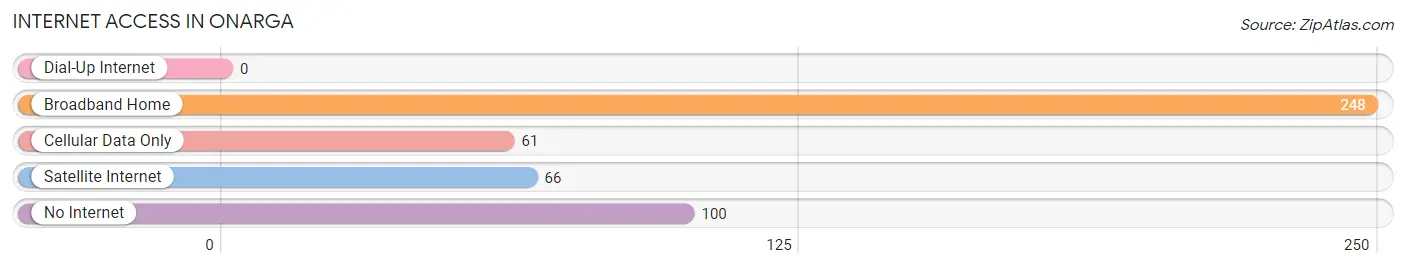
| Internet Type | # Households | % Households |
| Dial-Up Internet | 0 | 0.0% |
| Broadband Home | 248 | 55.9% |
| Cellular Data Only | 61 | 13.7% |
| Satellite Internet | 66 | 14.9% |
| No Internet | 100 | 22.5% |
| Total | 444 | 100.0% |
Onarga Summary
Onarga, Illinois is a small village located in Iroquois County, Illinois. It is situated in the eastern part of the state, about 50 miles south of Chicago. The village has a population of 1,717 people, according to the 2010 census.
Geography
Onarga is located in the eastern part of Iroquois County, Illinois. It is situated on the Iroquois River, which flows through the village. The village is surrounded by farmland and is located in the Kankakee River Valley. The village is located at an elevation of 690 feet above sea level.
The climate in Onarga is classified as humid continental, with hot summers and cold winters. The average annual temperature is around 50 degrees Fahrenheit. The average annual precipitation is around 37 inches.
Economy
Onarga's economy is largely based on agriculture. The village is home to several farms, including dairy farms, grain farms, and vegetable farms. The village also has a few small businesses, including a grocery store, a hardware store, and a few restaurants.
The village is also home to a few manufacturing companies, including a plastics manufacturer and a metal fabrication company. The village is also home to a few small service businesses, such as a barber shop and a beauty salon.
Demographics
As of the 2010 census, the population of Onarga was 1,717 people. The racial makeup of the village was 97.2% White, 0.7% African American, 0.2% Native American, 0.2% Asian, 0.1% Pacific Islander, 0.7% from other races, and 0.9% from two or more races. Hispanic or Latino of any race were 2.2% of the population.
The median income for a household in Onarga was $45,938, and the median income for a family was $51,250. The per capita income for the village was $20,945. About 8.2% of families and 10.2% of the population were below the poverty line, including 14.2% of those under age 18 and 5.2% of those age 65 or over.
Conclusion
Onarga, Illinois is a small village located in Iroquois County, Illinois. It is situated in the eastern part of the state, about 50 miles south of Chicago. The village has a population of 1,717 people, according to the 2010 census. Onarga's economy is largely based on agriculture, with several farms and a few small businesses. The racial makeup of the village is mostly White, with a small percentage of African American, Native American, Asian, and Pacific Islander residents. The median income for a household in Onarga was $45,938, and the median income for a family was $51,250. The per capita income for the village was $20,945.
Common Questions
What is Per Capita Income in Onarga?
Per Capita income in Onarga is $23,258.
What is the Median Family Income in Onarga?
Median Family Income in Onarga is $75,337.
What is the Median Household income in Onarga?
Median Household Income in Onarga is $57,188.
What is Income or Wage Gap in Onarga?
Income or Wage Gap in Onarga is 20.8%.
Women in Onarga earn 79.2 cents for every dollar earned by a man.
What is Inequality or Gini Index in Onarga?
Inequality or Gini Index in Onarga is 0.40.
What is the Total Population of Onarga?
Total Population of Onarga is 1,288.
What is the Total Male Population of Onarga?
Total Male Population of Onarga is 619.
What is the Total Female Population of Onarga?
Total Female Population of Onarga is 669.
What is the Ratio of Males per 100 Females in Onarga?
There are 92.53 Males per 100 Females in Onarga.
What is the Ratio of Females per 100 Males in Onarga?
There are 108.08 Females per 100 Males in Onarga.
What is the Median Population Age in Onarga?
Median Population Age in Onarga is 40.5 Years.
What is the Average Family Size in Onarga
Average Family Size in Onarga is 3.5 People.
What is the Average Household Size in Onarga
Average Household Size in Onarga is 2.8 People.
How Large is the Labor Force in Onarga?
There are 607 People in the Labor Forcein in Onarga.
What is the Percentage of People in the Labor Force in Onarga?
58.8% of People are in the Labor Force in Onarga.
What is the Unemployment Rate in Onarga?
Unemployment Rate in Onarga is 10.0%.