Cities with the Highest Percentage of Renter-Occupied Units in Illinois
RELATED REPORTS & OPTIONS
Highest Renter-Occupied
Illinois
Compare Cities
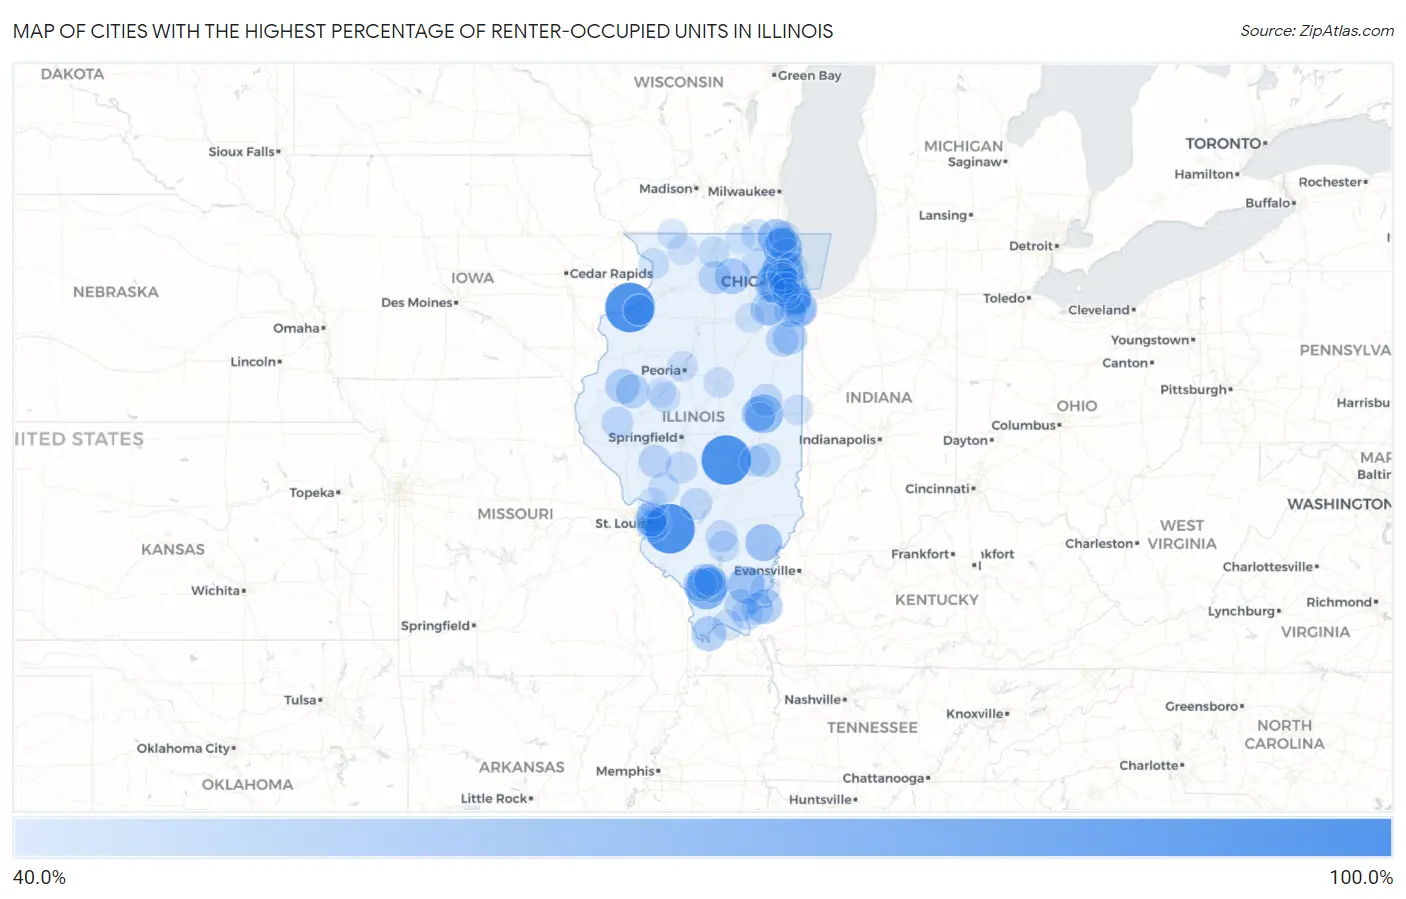
Map of Cities with the Highest Percentage of Renter-Occupied Units in Illinois
0.0%
100.0%
Cities with the Highest Percentage of Renter-Occupied Units in Illinois
| City | % Renter-Occupied | vs State | vs National | |
| 1. | Scott Afb | 100.0% | 33.3%(+66.7)#1 | 35.2%(+64.8)#18 |
| 2. | Rock Island Arsenal | 100.0% | 33.3%(+66.7)#2 | 35.2%(+64.8)#75 |
| 3. | Alden | 100.0% | 33.3%(+66.7)#3 | 35.2%(+64.8)#92 |
| 4. | Harding | 100.0% | 33.3%(+66.7)#4 | 35.2%(+64.8)#113 |
| 5. | Triumph | 100.0% | 33.3%(+66.7)#5 | 35.2%(+64.8)#126 |
| 6. | Andres | 100.0% | 33.3%(+66.7)#6 | 35.2%(+64.8)#167 |
| 7. | Westervelt | 100.0% | 33.3%(+66.7)#7 | 35.2%(+64.8)#176 |
| 8. | Lane | 90.7% | 33.3%(+57.4)#8 | 35.2%(+55.5)#319 |
| 9. | Janesville | 83.3% | 33.3%(+50.0)#9 | 35.2%(+48.1)#392 |
| 10. | Serena | 78.3% | 33.3%(+44.9)#10 | 35.2%(+43.1)#480 |
| 11. | Rosemont | 77.9% | 33.3%(+44.5)#11 | 35.2%(+42.7)#489 |
| 12. | Carbondale | 74.3% | 33.3%(+41.0)#12 | 35.2%(+39.2)#566 |
| 13. | Oakbrook Terrace | 72.4% | 33.3%(+39.1)#13 | 35.2%(+37.2)#619 |
| 14. | North Chicago | 68.3% | 33.3%(+35.0)#14 | 35.2%(+33.1)#789 |
| 15. | Urbana | 67.2% | 33.3%(+33.8)#15 | 35.2%(+32.0)#838 |
| 16. | Custer Park | 65.2% | 33.3%(+31.9)#16 | 35.2%(+30.0)#936 |
| 17. | Muddy | 62.5% | 33.3%(+29.2)#17 | 35.2%(+27.3)#1,153 |
| 18. | Golden Gate | 62.1% | 33.3%(+28.7)#18 | 35.2%(+26.9)#1,182 |
| 19. | Ford Heights | 62.0% | 33.3%(+28.7)#19 | 35.2%(+26.9)#1,183 |
| 20. | Old Mill Creek | 61.8% | 33.3%(+28.5)#20 | 35.2%(+26.6)#1,200 |
| 21. | Cambria | 58.2% | 33.3%(+24.9)#21 | 35.2%(+23.0)#1,564 |
| 22. | Dekalb | 57.9% | 33.3%(+24.6)#22 | 35.2%(+22.7)#1,600 |
| 23. | Cave In Rock | 56.7% | 33.3%(+23.4)#23 | 35.2%(+21.5)#1,763 |
| 24. | De Soto | 56.2% | 33.3%(+22.8)#24 | 35.2%(+21.0)#1,848 |
| 25. | Cahokia Heights | 55.6% | 33.3%(+22.3)#25 | 35.2%(+20.4)#1,923 |
| 26. | Mound City | 55.6% | 33.3%(+22.3)#26 | 35.2%(+20.4)#1,925 |
| 27. | Champaign | 54.6% | 33.3%(+21.3)#27 | 35.2%(+19.4)#2,088 |
| 28. | Macomb | 54.6% | 33.3%(+21.3)#28 | 35.2%(+19.4)#2,092 |
| 29. | Chicago | 54.4% | 33.3%(+21.1)#29 | 35.2%(+19.2)#2,123 |
| 30. | Sun River Terrace | 53.8% | 33.3%(+20.5)#30 | 35.2%(+18.7)#2,208 |
| 31. | Rockdale | 53.3% | 33.3%(+20.0)#31 | 35.2%(+18.1)#2,317 |
| 32. | Cameron | 53.2% | 33.3%(+19.9)#32 | 35.2%(+18.1)#2,330 |
| 33. | Adair | 53.0% | 33.3%(+19.7)#33 | 35.2%(+17.8)#2,376 |
| 34. | Calumet Park | 53.0% | 33.3%(+19.7)#34 | 35.2%(+17.8)#2,385 |
| 35. | Venice | 52.9% | 33.3%(+19.6)#35 | 35.2%(+17.7)#2,405 |
| 36. | Charleston | 52.6% | 33.3%(+19.3)#36 | 35.2%(+17.5)#2,446 |
| 37. | Murphysboro | 52.3% | 33.3%(+19.0)#37 | 35.2%(+17.1)#2,527 |
| 38. | Blue Island | 51.3% | 33.3%(+18.0)#38 | 35.2%(+16.2)#2,742 |
| 39. | Waukegan | 51.1% | 33.3%(+17.8)#39 | 35.2%(+15.9)#2,807 |
| 40. | Kankakee | 51.1% | 33.3%(+17.8)#40 | 35.2%(+15.9)#2,818 |
| 41. | Riverdale | 50.8% | 33.3%(+17.4)#41 | 35.2%(+15.6)#2,904 |
| 42. | Rochelle | 50.6% | 33.3%(+17.2)#42 | 35.2%(+15.4)#2,952 |
| 43. | Harvey | 50.3% | 33.3%(+17.0)#43 | 35.2%(+15.2)#3,005 |
| 44. | Scottville | 50.0% | 33.3%(+16.7)#44 | 35.2%(+14.8)#3,118 |
| 45. | Eddyville | 50.0% | 33.3%(+16.7)#45 | 35.2%(+14.8)#3,122 |
| 46. | Highwood | 49.7% | 33.3%(+16.4)#46 | 35.2%(+14.5)#3,195 |
| 47. | Richton Park | 49.5% | 33.3%(+16.2)#47 | 35.2%(+14.3)#3,254 |
| 48. | Elizabethtown | 48.0% | 33.3%(+14.7)#48 | 35.2%(+12.9)#3,666 |
| 49. | Mount Sterling | 47.9% | 33.3%(+14.6)#49 | 35.2%(+12.7)#3,710 |
| 50. | Rantoul | 47.8% | 33.3%(+14.5)#50 | 35.2%(+12.6)#3,747 |
| 51. | Westmont | 47.7% | 33.3%(+14.4)#51 | 35.2%(+12.5)#3,777 |
| 52. | Madison | 47.7% | 33.3%(+14.3)#52 | 35.2%(+12.5)#3,789 |
| 53. | Hurst | 47.7% | 33.3%(+14.3)#53 | 35.2%(+12.5)#3,790 |
| 54. | East St Louis | 47.6% | 33.3%(+14.3)#54 | 35.2%(+12.5)#3,800 |
| 55. | Greenville | 47.5% | 33.3%(+14.2)#55 | 35.2%(+12.3)#3,843 |
| 56. | Dix | 47.3% | 33.3%(+14.0)#56 | 35.2%(+12.1)#3,909 |
| 57. | Waggoner | 47.3% | 33.3%(+14.0)#57 | 35.2%(+12.1)#3,913 |
| 58. | Justice | 47.2% | 33.3%(+13.9)#58 | 35.2%(+12.0)#3,944 |
| 59. | Sauget | 47.1% | 33.3%(+13.7)#59 | 35.2%(+11.9)#4,003 |
| 60. | Bensenville | 46.9% | 33.3%(+13.6)#60 | 35.2%(+11.8)#4,040 |
| 61. | Golconda | 46.8% | 33.3%(+13.4)#61 | 35.2%(+11.6)#4,095 |
| 62. | Richmond | 46.7% | 33.3%(+13.4)#62 | 35.2%(+11.5)#4,112 |
| 63. | Edgington | 45.9% | 33.3%(+12.6)#63 | 35.2%(+10.8)#4,365 |
| 64. | Rockford | 45.9% | 33.3%(+12.6)#64 | 35.2%(+10.7)#4,382 |
| 65. | Mount Vernon | 45.9% | 33.3%(+12.5)#65 | 35.2%(+10.7)#4,387 |
| 66. | Stone Park | 45.8% | 33.3%(+12.4)#66 | 35.2%(+10.6)#4,415 |
| 67. | Park City | 45.7% | 33.3%(+12.4)#67 | 35.2%(+10.6)#4,428 |
| 68. | Ridgewood | 45.7% | 33.3%(+12.3)#68 | 35.2%(+10.5)#4,455 |
| 69. | Carbon Cliff | 45.5% | 33.3%(+12.2)#69 | 35.2%(+10.3)#4,494 |
| 70. | Joppa | 45.5% | 33.3%(+12.1)#70 | 35.2%(+10.3)#4,515 |
| 71. | Cicero | 45.4% | 33.3%(+12.1)#71 | 35.2%(+10.2)#4,545 |
| 72. | West Dundee | 45.0% | 33.3%(+11.7)#72 | 35.2%(+9.82)#4,682 |
| 73. | Mattoon | 45.0% | 33.3%(+11.7)#73 | 35.2%(+9.82)#4,683 |
| 74. | Melrose Park | 44.9% | 33.3%(+11.6)#74 | 35.2%(+9.74)#4,711 |
| 75. | Forest Park | 44.8% | 33.3%(+11.5)#75 | 35.2%(+9.63)#4,757 |
| 76. | Savanna | 44.7% | 33.3%(+11.4)#76 | 35.2%(+9.55)#4,784 |
| 77. | Royal Lakes | 44.6% | 33.3%(+11.2)#77 | 35.2%(+9.37)#4,852 |
| 78. | Normal | 44.2% | 33.3%(+10.9)#78 | 35.2%(+9.02)#4,988 |
| 79. | Zion | 44.1% | 33.3%(+10.8)#79 | 35.2%(+8.90)#5,020 |
| 80. | Evanston | 44.1% | 33.3%(+10.8)#80 | 35.2%(+8.89)#5,022 |
| 81. | Marley | 44.0% | 33.3%(+10.7)#81 | 35.2%(+8.82)#5,055 |
| 82. | Danville | 44.0% | 33.3%(+10.7)#82 | 35.2%(+8.80)#5,058 |
| 83. | Topeka | 43.8% | 33.3%(+10.4)#83 | 35.2%(+8.57)#5,156 |
| 84. | Peoria | 43.7% | 33.3%(+10.4)#84 | 35.2%(+8.54)#5,166 |
| 85. | Sauk Village | 43.7% | 33.3%(+10.4)#85 | 35.2%(+8.52)#5,173 |
| 86. | Preston Heights | 43.7% | 33.3%(+10.4)#86 | 35.2%(+8.52)#5,176 |
| 87. | Brooklyn | 43.6% | 33.3%(+10.3)#87 | 35.2%(+8.44)#5,214 |
| 88. | Silvis | 43.3% | 33.3%(+9.98)#88 | 35.2%(+8.12)#5,338 |
| 89. | Lisle | 43.3% | 33.3%(+9.96)#89 | 35.2%(+8.10)#5,346 |
| 90. | Freeport | 43.1% | 33.3%(+9.79)#90 | 35.2%(+7.93)#5,409 |
| 91. | Winslow | 42.9% | 33.3%(+9.53)#91 | 35.2%(+7.67)#5,515 |
| 92. | Schiller Park | 42.8% | 33.3%(+9.52)#92 | 35.2%(+7.66)#5,539 |
| 93. | Alton | 42.7% | 33.3%(+9.33)#93 | 35.2%(+7.47)#5,611 |
| 94. | Savoy | 42.6% | 33.3%(+9.27)#94 | 35.2%(+7.41)#5,632 |
| 95. | Shawneetown | 42.6% | 33.3%(+9.25)#95 | 35.2%(+7.39)#5,648 |
| 96. | Summit | 42.4% | 33.3%(+9.12)#96 | 35.2%(+7.26)#5,695 |
| 97. | Harvard | 42.4% | 33.3%(+9.11)#97 | 35.2%(+7.25)#5,701 |
| 98. | Liverpool | 42.3% | 33.3%(+8.98)#98 | 35.2%(+7.12)#5,755 |
| 99. | Morris | 42.1% | 33.3%(+8.79)#99 | 35.2%(+6.94)#5,836 |
| 100. | Chicago Ridge | 42.1% | 33.3%(+8.76)#100 | 35.2%(+6.90)#5,858 |
Common Questions
What are the Top 10 Cities with the Highest Percentage of Renter-Occupied Units in Illinois?
Top 10 Cities with the Highest Percentage of Renter-Occupied Units in Illinois are:
#1
100.0%
#2
100.0%
#3
100.0%
#4
77.9%
#5
74.3%
#6
72.4%
#7
68.3%
#8
67.2%
#9
62.5%
#10
62.1%
What city has the Highest Percentage of Renter-Occupied Units in Illinois?
Scott AFB has the Highest Percentage of Renter-Occupied Units in Illinois with 100.0%.
What is the Percentage of Renter-Occupied Units in the State of Illinois?
Percentage of Renter-Occupied Units in Illinois is 33.3%.
What is the Percentage of Renter-Occupied Units in the United States?
Percentage of Renter-Occupied Units in the United States is 35.2%.