Richton Park, IL Map & Demographics
Richton Park Map
Richton Park Overview
$32,604
PER CAPITA INCOME
$97,852
AVG FAMILY INCOME
$69,691
AVG HOUSEHOLD INCOME
12.2%
WAGE / INCOME GAP [ % ]
87.8¢/ $1
WAGE / INCOME GAP [ $ ]
0.43
INEQUALITY / GINI INDEX
12,721
TOTAL POPULATION
5,716
MALE POPULATION
7,005
FEMALE POPULATION
81.60
MALES / 100 FEMALES
122.55
FEMALES / 100 MALES
39.7
MEDIAN AGE
3.4
AVG FAMILY SIZE
2.5
AVG HOUSEHOLD SIZE
6,786
LABOR FORCE [ PEOPLE ]
65.9%
PERCENT IN LABOR FORCE
12.3%
UNEMPLOYMENT RATE
Richton Park Zip Codes
Richton Park Area Codes
Income in Richton Park
Income Overview in Richton Park
Per Capita Income in Richton Park is $32,604, while median incomes of families and households are $97,852 and $69,691 respectively.
| Characteristic | Number | Measure |
| Per Capita Income | 12,721 | $32,604 |
| Median Family Income | 3,064 | $97,852 |
| Mean Family Income | 3,064 | $105,260 |
| Median Household Income | 5,075 | $69,691 |
| Mean Household Income | 5,075 | $80,467 |
| Income Deficit | 3,064 | $0 |
| Wage / Income Gap (%) | 12,721 | 12.21% |
| Wage / Income Gap ($) | 12,721 | 87.79¢ per $1 |
| Gini / Inequality Index | 12,721 | 0.43 |
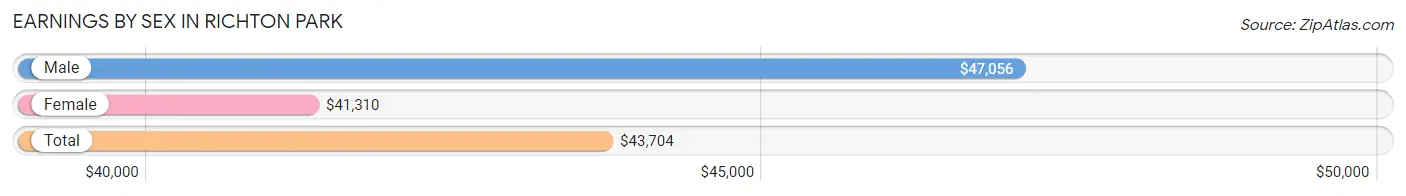
Earnings by Sex in Richton Park
Average Earnings in Richton Park are $43,704, $47,056 for men and $41,310 for women, a difference of 12.2%.
| Sex | Number | Average Earnings |
| Male | 2,816 (44.4%) | $47,056 |
| Female | 3,520 (55.6%) | $41,310 |
| Total | 6,336 (100.0%) | $43,704 |
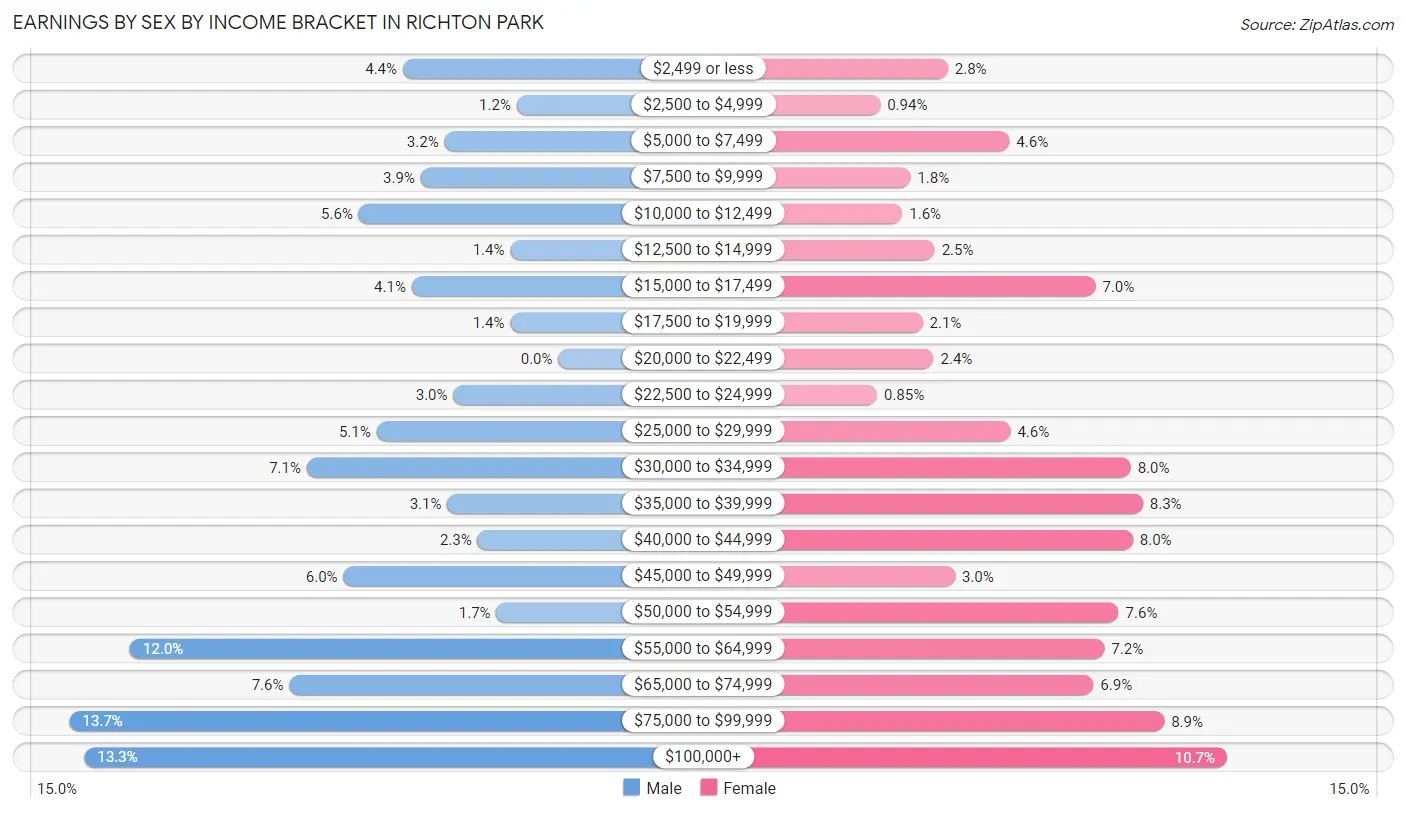
Earnings by Sex by Income Bracket in Richton Park
The most common earnings brackets in Richton Park are $75,000 to $99,999 for men (387 | 13.7%) and $100,000+ for women (376 | 10.7%).
| Income | Male | Female |
| $2,499 or less | 123 (4.4%) | 100 (2.8%) |
| $2,500 to $4,999 | 33 (1.2%) | 33 (0.9%) |
| $5,000 to $7,499 | 90 (3.2%) | 161 (4.6%) |
| $7,500 to $9,999 | 109 (3.9%) | 63 (1.8%) |
| $10,000 to $12,499 | 158 (5.6%) | 55 (1.6%) |
| $12,500 to $14,999 | 38 (1.3%) | 87 (2.5%) |
| $15,000 to $17,499 | 116 (4.1%) | 246 (7.0%) |
| $17,500 to $19,999 | 38 (1.3%) | 75 (2.1%) |
| $20,000 to $22,499 | 0 (0.0%) | 86 (2.4%) |
| $22,500 to $24,999 | 83 (2.9%) | 30 (0.9%) |
| $25,000 to $29,999 | 144 (5.1%) | 162 (4.6%) |
| $30,000 to $34,999 | 199 (7.1%) | 281 (8.0%) |
| $35,000 to $39,999 | 88 (3.1%) | 293 (8.3%) |
| $40,000 to $44,999 | 64 (2.3%) | 283 (8.0%) |
| $45,000 to $49,999 | 170 (6.0%) | 107 (3.0%) |
| $50,000 to $54,999 | 49 (1.7%) | 269 (7.6%) |
| $55,000 to $64,999 | 339 (12.0%) | 255 (7.2%) |
| $65,000 to $74,999 | 213 (7.6%) | 244 (6.9%) |
| $75,000 to $99,999 | 387 (13.7%) | 314 (8.9%) |
| $100,000+ | 375 (13.3%) | 376 (10.7%) |
| Total | 2,816 (100.0%) | 3,520 (100.0%) |
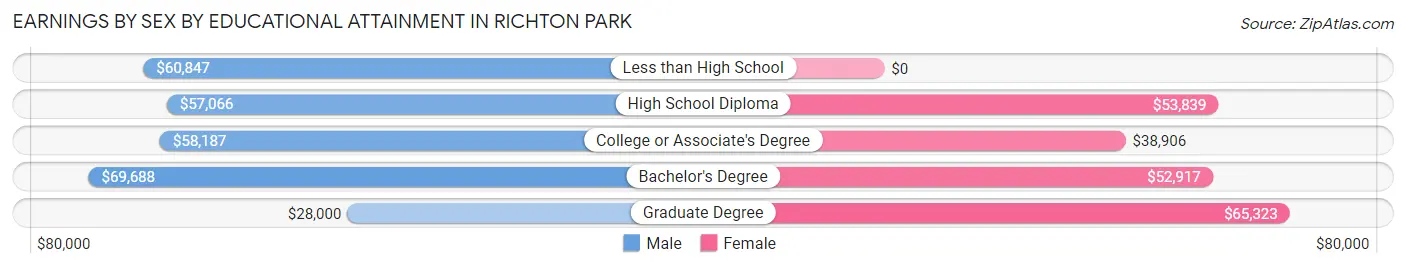
Earnings by Sex by Educational Attainment in Richton Park
Average earnings in Richton Park are $57,778 for men and $44,109 for women, a difference of 23.7%. Men with an educational attainment of bachelor's degree enjoy the highest average annual earnings of $69,688, while those with graduate degree education earn the least with $28,000. Women with an educational attainment of graduate degree earn the most with the average annual earnings of $65,323, while those with college or associate's degree education have the smallest earnings of $38,906.
| Educational Attainment | Male Income | Female Income |
| Less than High School | $60,847 | $0 |
| High School Diploma | $57,066 | $53,839 |
| College or Associate's Degree | $58,187 | $38,906 |
| Bachelor's Degree | $69,688 | $52,917 |
| Graduate Degree | $28,000 | $65,323 |
| Total | $57,778 | $44,109 |
Family Income in Richton Park
Family Income Brackets in Richton Park
According to the Richton Park family income data, there are 751 families falling into the $100,000 to $149,999 income range, which is the most common income bracket and makes up 24.5% of all families. Conversely, the $10,000 to $14,999 income bracket is the least frequent group with only 25 families (0.8%) belonging to this category.
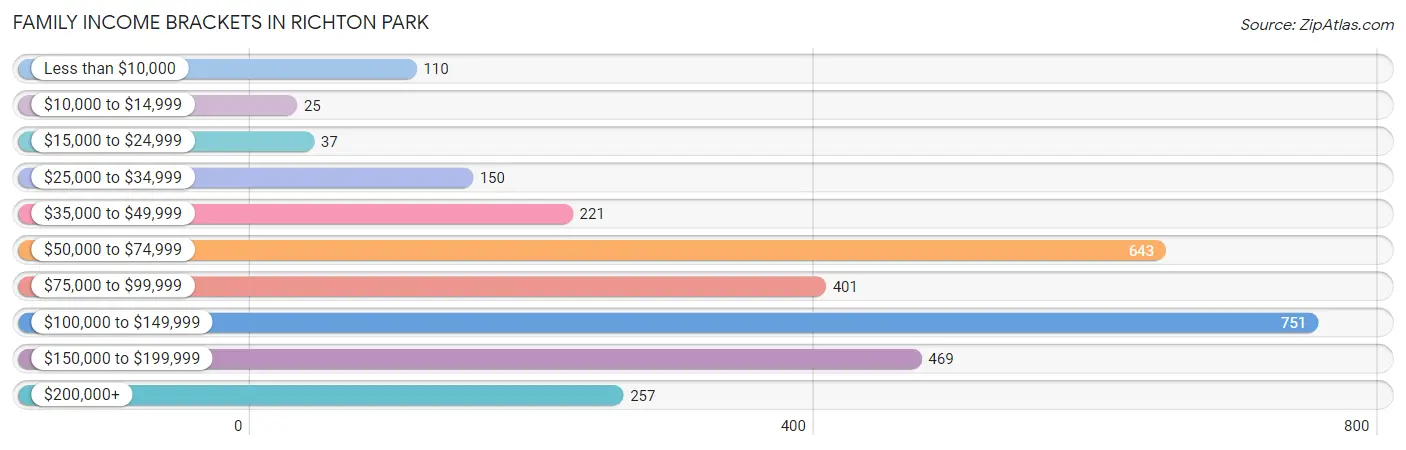
| Income Bracket | # Families | % Families |
| Less than $10,000 | 110 | 3.6% |
| $10,000 to $14,999 | 25 | 0.8% |
| $15,000 to $24,999 | 37 | 1.2% |
| $25,000 to $34,999 | 150 | 4.9% |
| $35,000 to $49,999 | 221 | 7.2% |
| $50,000 to $74,999 | 643 | 21.0% |
| $75,000 to $99,999 | 401 | 13.1% |
| $100,000 to $149,999 | 751 | 24.5% |
| $150,000 to $199,999 | 469 | 15.3% |
| $200,000+ | 257 | 8.4% |
Family Income by Famaliy Size in Richton Park
6-person families (48 | 1.6%) account for the highest median family income in Richton Park with $212,143 per family, while 2-person families (1,142 | 37.3%) have the highest median income of $37,614 per family member.
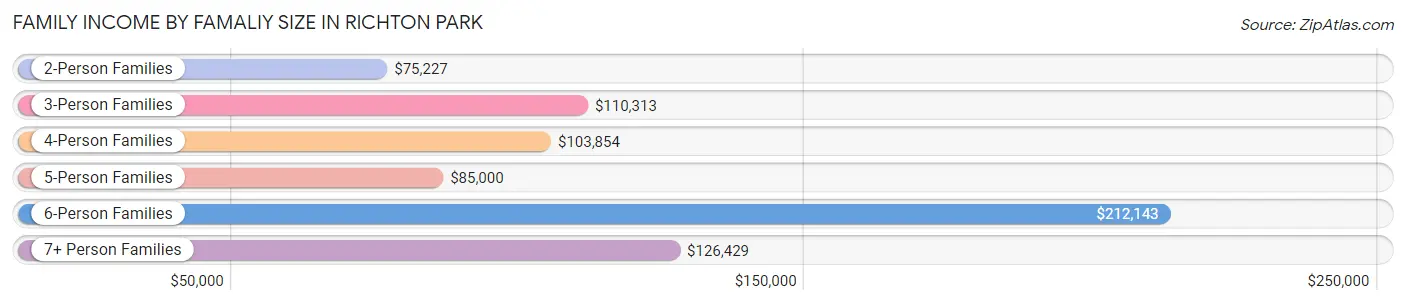
| Income Bracket | # Families | Median Income |
| 2-Person Families | 1,142 (37.3%) | $75,227 |
| 3-Person Families | 904 (29.5%) | $110,313 |
| 4-Person Families | 652 (21.3%) | $103,854 |
| 5-Person Families | 260 (8.5%) | $85,000 |
| 6-Person Families | 48 (1.6%) | $212,143 |
| 7+ Person Families | 58 (1.9%) | $126,429 |
| Total | 3,064 (100.0%) | $97,852 |
Family Income by Number of Earners in Richton Park
The median family income in Richton Park is $97,852, with families comprising 3+ earners (482) having the highest median family income of $163,304, while families with no earners (319) have the lowest median family income of $39,896, accounting for 15.7% and 10.4% of families, respectively.
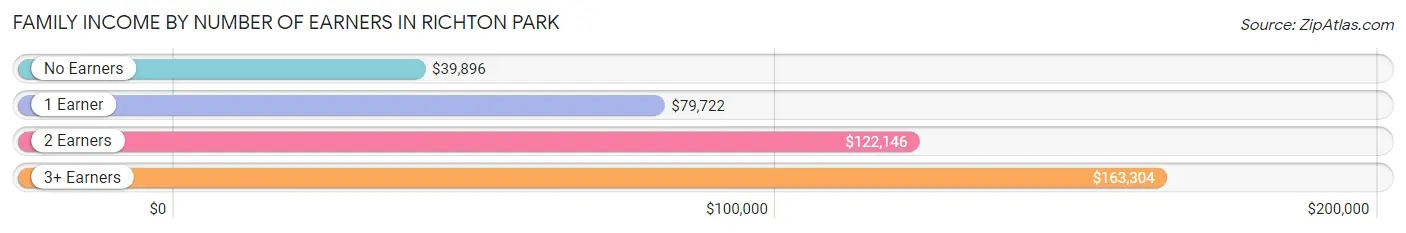
| Number of Earners | # Families | Median Income |
| No Earners | 319 (10.4%) | $39,896 |
| 1 Earner | 1,194 (39.0%) | $79,722 |
| 2 Earners | 1,069 (34.9%) | $122,146 |
| 3+ Earners | 482 (15.7%) | $163,304 |
| Total | 3,064 (100.0%) | $97,852 |
Household Income in Richton Park
Household Income Brackets in Richton Park
With 934 households falling in the category, the $100,000 to $149,999 income range is the most frequent in Richton Park, accounting for 18.4% of all households. In contrast, only 274 households (5.4%) fall into the $35,000 to $49,999 income bracket, making it the least populous group.
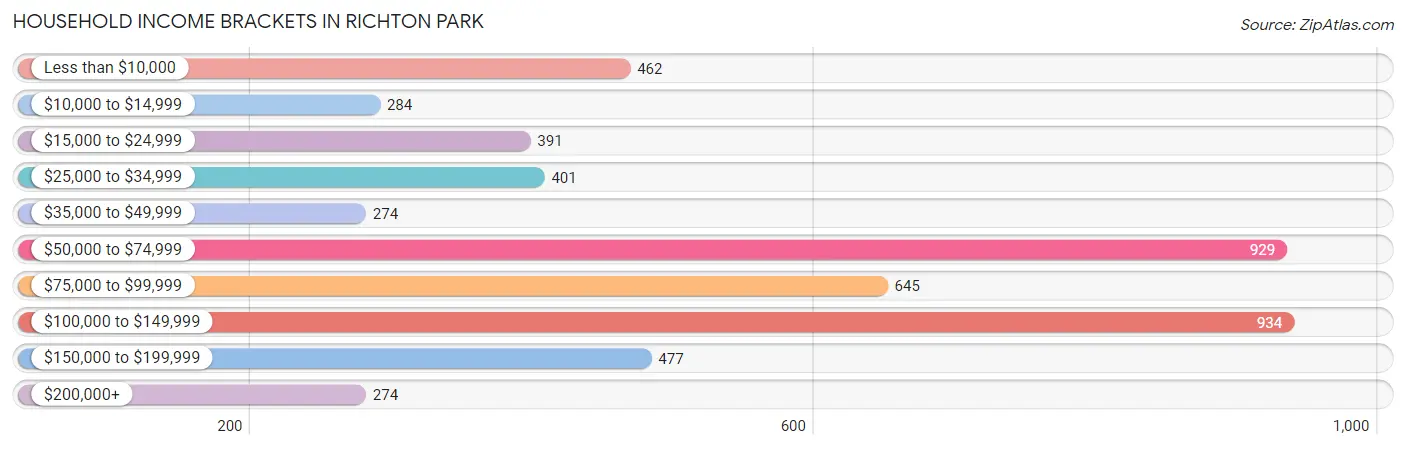
| Income Bracket | # Households | % Households |
| Less than $10,000 | 462 | 9.1% |
| $10,000 to $14,999 | 284 | 5.6% |
| $15,000 to $24,999 | 391 | 7.7% |
| $25,000 to $34,999 | 401 | 7.9% |
| $35,000 to $49,999 | 274 | 5.4% |
| $50,000 to $74,999 | 929 | 18.3% |
| $75,000 to $99,999 | 645 | 12.7% |
| $100,000 to $149,999 | 934 | 18.4% |
| $150,000 to $199,999 | 477 | 9.4% |
| $200,000+ | 274 | 5.4% |
Household Income by Householder Age in Richton Park
The median household income in Richton Park is $69,691, with the highest median household income of $89,761 found in the 25 to 44 years age bracket for the primary householder. A total of 1,267 households (25.0%) fall into this category. Meanwhile, the 15 to 24 years age bracket for the primary householder has the lowest median household income of $0, with 60 households (1.2%) in this group.
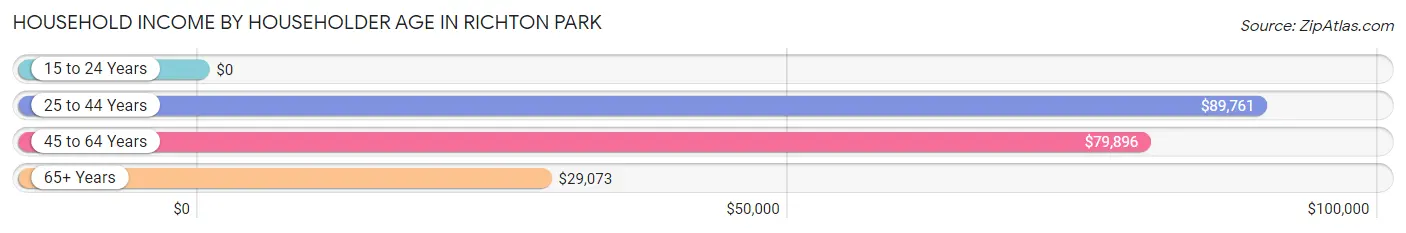
| Income Bracket | # Households | Median Income |
| 15 to 24 Years | 60 (1.2%) | $0 |
| 25 to 44 Years | 1,267 (25.0%) | $89,761 |
| 45 to 64 Years | 2,311 (45.5%) | $79,896 |
| 65+ Years | 1,437 (28.3%) | $29,073 |
| Total | 5,075 (100.0%) | $69,691 |
Poverty in Richton Park
Income Below Poverty by Sex and Age in Richton Park
With 7.9% poverty level for males and 11.3% for females among the residents of Richton Park, 65 to 74 year old males and 65 to 74 year old females are the most vulnerable to poverty, with 88 males (22.3%) and 192 females (26.3%) in their respective age groups living below the poverty level.
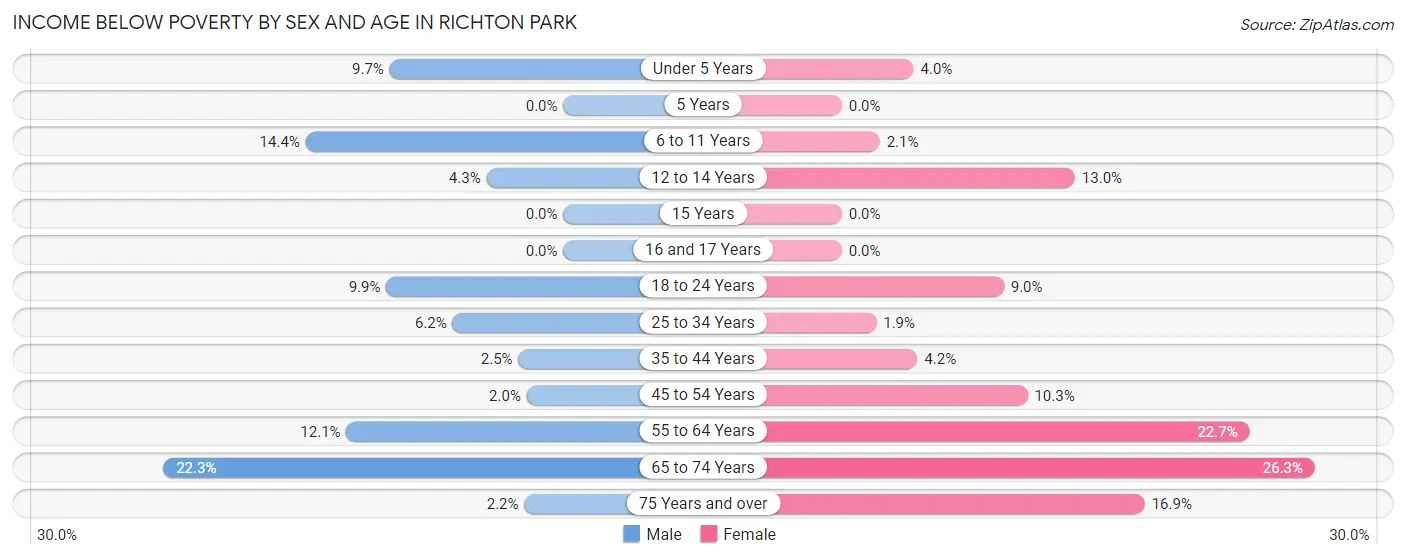
| Age Bracket | Male | Female |
| Under 5 Years | 26 (9.7%) | 11 (4.0%) |
| 5 Years | 0 (0.0%) | 0 (0.0%) |
| 6 to 11 Years | 65 (14.3%) | 11 (2.1%) |
| 12 to 14 Years | 11 (4.3%) | 37 (13.0%) |
| 15 Years | 0 (0.0%) | 0 (0.0%) |
| 16 and 17 Years | 0 (0.0%) | 0 (0.0%) |
| 18 to 24 Years | 102 (9.9%) | 46 (9.0%) |
| 25 to 34 Years | 42 (6.2%) | 14 (1.9%) |
| 35 to 44 Years | 10 (2.5%) | 38 (4.2%) |
| 45 to 54 Years | 16 (2.0%) | 112 (10.3%) |
| 55 to 64 Years | 75 (12.1%) | 225 (22.7%) |
| 65 to 74 Years | 88 (22.3%) | 192 (26.3%) |
| 75 Years and over | 8 (2.2%) | 96 (16.9%) |
| Total | 443 (7.9%) | 782 (11.3%) |
Income Above Poverty by Sex and Age in Richton Park
According to the poverty statistics in Richton Park, males aged 5 years and females aged 5 years are the age groups that are most secure financially, with 100.0% of males and 100.0% of females in these age groups living above the poverty line.
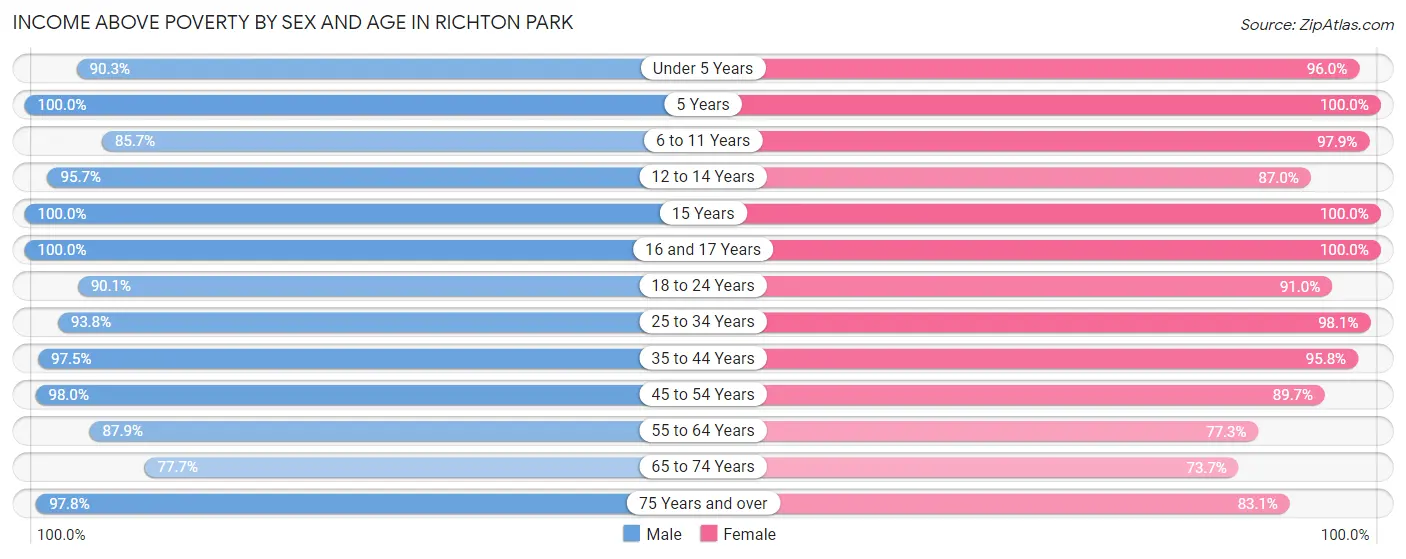
| Age Bracket | Male | Female |
| Under 5 Years | 243 (90.3%) | 264 (96.0%) |
| 5 Years | 60 (100.0%) | 56 (100.0%) |
| 6 to 11 Years | 388 (85.7%) | 510 (97.9%) |
| 12 to 14 Years | 246 (95.7%) | 248 (87.0%) |
| 15 Years | 117 (100.0%) | 131 (100.0%) |
| 16 and 17 Years | 190 (100.0%) | 158 (100.0%) |
| 18 to 24 Years | 932 (90.1%) | 464 (91.0%) |
| 25 to 34 Years | 639 (93.8%) | 717 (98.1%) |
| 35 to 44 Years | 390 (97.5%) | 864 (95.8%) |
| 45 to 54 Years | 769 (98.0%) | 971 (89.7%) |
| 55 to 64 Years | 546 (87.9%) | 766 (77.3%) |
| 65 to 74 Years | 307 (77.7%) | 537 (73.7%) |
| 75 Years and over | 360 (97.8%) | 473 (83.1%) |
| Total | 5,187 (92.1%) | 6,159 (88.7%) |
Income Below Poverty Among Married-Couple Families in Richton Park
The poverty statistics for married-couple families in Richton Park show that 1.2% or 21 of the total 1,814 families live below the poverty line. Families with 1 or 2 children have the highest poverty rate of 1.8%, comprising of 7 families. On the other hand, families with 3 or 4 children have the lowest poverty rate of 0.0%, which includes 0 families.
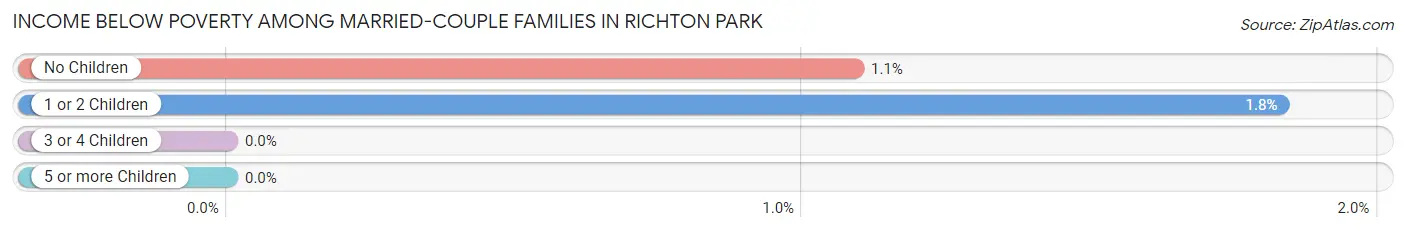
| Children | Above Poverty | Below Poverty |
| No Children | 1,272 (98.9%) | 14 (1.1%) |
| 1 or 2 Children | 376 (98.2%) | 7 (1.8%) |
| 3 or 4 Children | 110 (100.0%) | 0 (0.0%) |
| 5 or more Children | 35 (100.0%) | 0 (0.0%) |
| Total | 1,793 (98.8%) | 21 (1.2%) |
Income Below Poverty Among Single-Parent Households in Richton Park
According to the poverty data in Richton Park, 6.2% or 10 single-father households and 11.6% or 126 single-mother households are living below the poverty line. Among single-father households, those with 1 or 2 children have the highest poverty rate, with 10 households (7.2%) experiencing poverty. Likewise, among single-mother households, those with no children have the highest poverty rate, with 66 households (17.8%) falling below the poverty line.
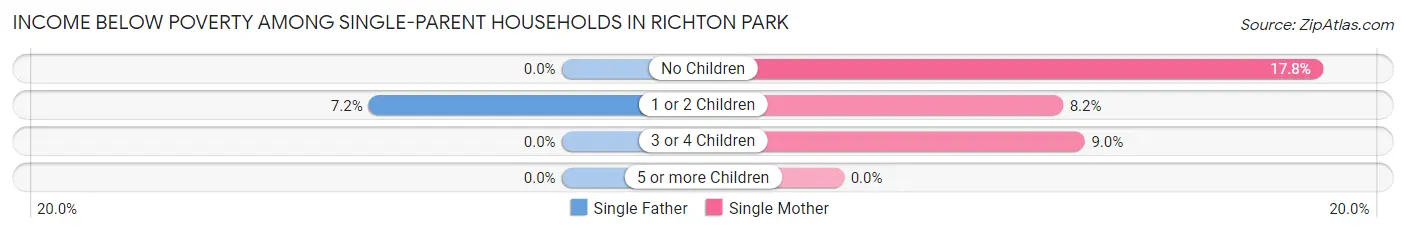
| Children | Single Father | Single Mother |
| No Children | 0 (0.0%) | 66 (17.8%) |
| 1 or 2 Children | 10 (7.2%) | 46 (8.2%) |
| 3 or 4 Children | 0 (0.0%) | 14 (9.0%) |
| 5 or more Children | 0 (0.0%) | 0 (0.0%) |
| Total | 10 (6.2%) | 126 (11.6%) |
Income Below Poverty Among Married-Couple vs Single-Parent Households in Richton Park
The poverty data for Richton Park shows that 21 of the married-couple family households (1.2%) and 136 of the single-parent households (10.9%) are living below the poverty level. Within the married-couple family households, those with 1 or 2 children have the highest poverty rate, with 7 households (1.8%) falling below the poverty line. Among the single-parent households, those with no children have the highest poverty rate, with 66 household (17.3%) living below poverty.
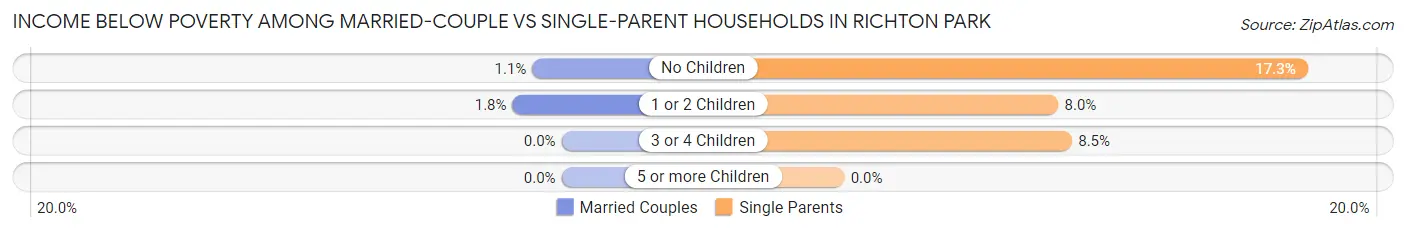
| Children | Married-Couple Families | Single-Parent Households |
| No Children | 14 (1.1%) | 66 (17.3%) |
| 1 or 2 Children | 7 (1.8%) | 56 (8.0%) |
| 3 or 4 Children | 0 (0.0%) | 14 (8.5%) |
| 5 or more Children | 0 (0.0%) | 0 (0.0%) |
| Total | 21 (1.2%) | 136 (10.9%) |
Race in Richton Park
The most populous races in Richton Park are Black / African American (11,497 | 90.4%), White / Caucasian (786 | 6.2%), and Hispanic or Latino (314 | 2.5%).
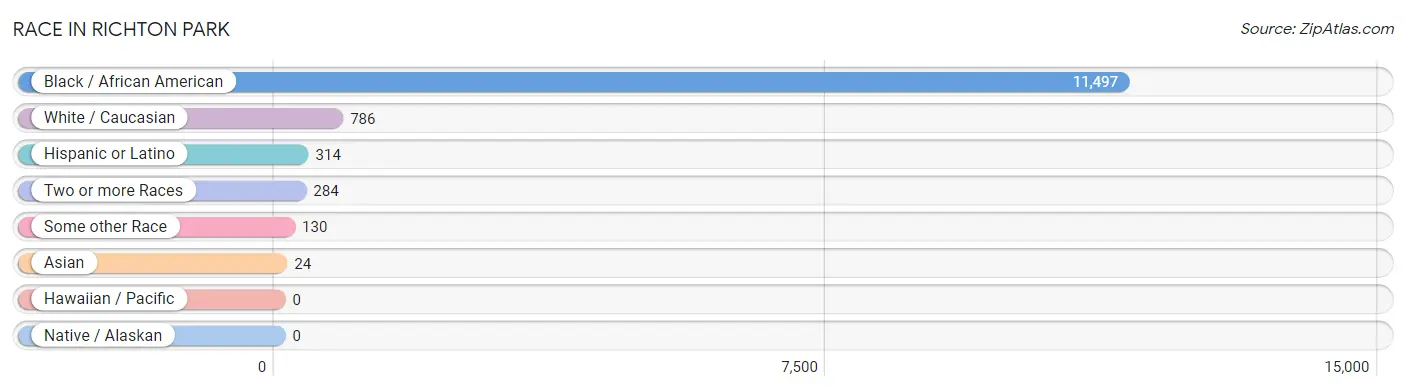
| Race | # Population | % Population |
| Asian | 24 | 0.2% |
| Black / African American | 11,497 | 90.4% |
| Hawaiian / Pacific | 0 | 0.0% |
| Hispanic or Latino | 314 | 2.5% |
| Native / Alaskan | 0 | 0.0% |
| White / Caucasian | 786 | 6.2% |
| Two or more Races | 284 | 2.2% |
| Some other Race | 130 | 1.0% |
| Total | 12,721 | 100.0% |
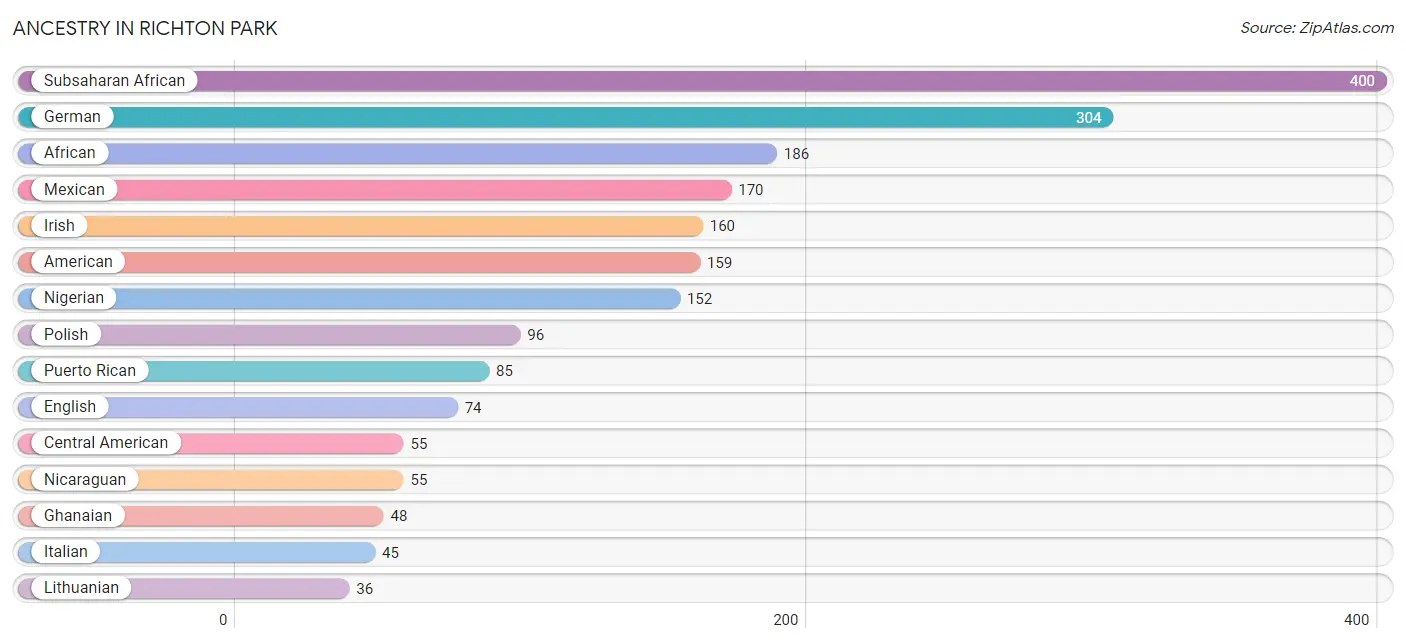
Ancestry in Richton Park
The most populous ancestries reported in Richton Park are Subsaharan African (400 | 3.1%), German (304 | 2.4%), African (186 | 1.5%), Mexican (170 | 1.3%), and Irish (160 | 1.3%), together accounting for 9.6% of all Richton Park residents.
| Ancestry | # Population | % Population |
| African | 186 | 1.5% |
| American | 159 | 1.3% |
| Bermudan | 33 | 0.3% |
| British | 16 | 0.1% |
| Canadian | 11 | 0.1% |
| Central American | 55 | 0.4% |
| Choctaw | 17 | 0.1% |
| Dutch | 15 | 0.1% |
| English | 74 | 0.6% |
| European | 3 | 0.0% |
| French | 20 | 0.2% |
| German | 304 | 2.4% |
| Ghanaian | 48 | 0.4% |
| Indian (Asian) | 21 | 0.2% |
| Iranian | 20 | 0.2% |
| Irish | 160 | 1.3% |
| Italian | 45 | 0.4% |
| Korean | 3 | 0.0% |
| Lithuanian | 36 | 0.3% |
| Mexican | 170 | 1.3% |
| Mexican American Indian | 9 | 0.1% |
| Navajo | 9 | 0.1% |
| Nicaraguan | 55 | 0.4% |
| Nigerian | 152 | 1.2% |
| Norwegian | 5 | 0.0% |
| Polish | 96 | 0.7% |
| Puerto Rican | 85 | 0.7% |
| Slovak | 11 | 0.1% |
| Subsaharan African | 400 | 3.1% |
| Swedish | 11 | 0.1% | View All 30 Rows |
Immigrants in Richton Park
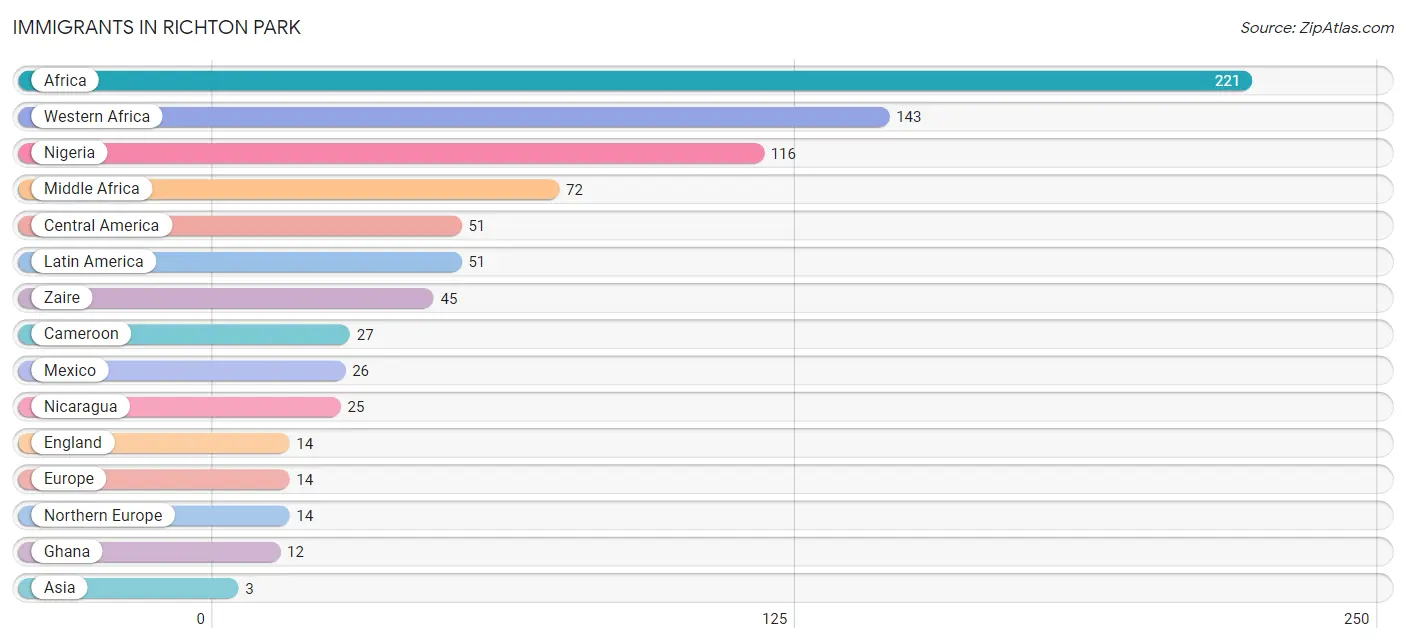
The most numerous immigrant groups reported in Richton Park came from Africa (221 | 1.7%), Western Africa (143 | 1.1%), Nigeria (116 | 0.9%), Middle Africa (72 | 0.6%), and Central America (51 | 0.4%), together accounting for 4.7% of all Richton Park residents.
| Immigration Origin | # Population | % Population |
| Africa | 221 | 1.7% |
| Asia | 3 | 0.0% |
| Cameroon | 27 | 0.2% |
| Central America | 51 | 0.4% |
| England | 14 | 0.1% |
| Europe | 14 | 0.1% |
| Ghana | 12 | 0.1% |
| Latin America | 51 | 0.4% |
| Mexico | 26 | 0.2% |
| Middle Africa | 72 | 0.6% |
| Nicaragua | 25 | 0.2% |
| Nigeria | 116 | 0.9% |
| Northern Europe | 14 | 0.1% |
| Philippines | 3 | 0.0% |
| South Eastern Asia | 3 | 0.0% |
| Western Africa | 143 | 1.1% |
| Zaire | 45 | 0.4% | View All 17 Rows |
Sex and Age in Richton Park
Sex and Age in Richton Park
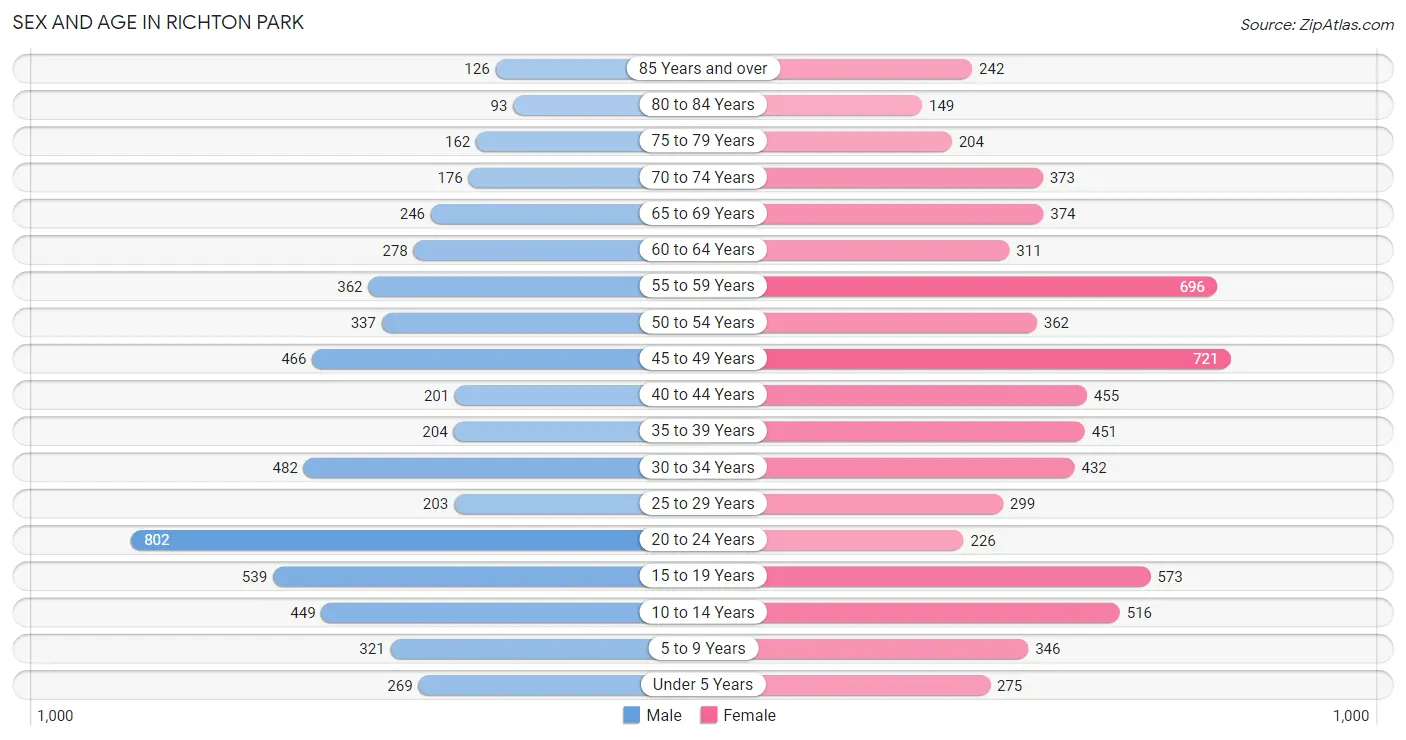
The most populous age groups in Richton Park are 20 to 24 Years (802 | 14.0%) for men and 45 to 49 Years (721 | 10.3%) for women.
| Age Bracket | Male | Female |
| Under 5 Years | 269 (4.7%) | 275 (3.9%) |
| 5 to 9 Years | 321 (5.6%) | 346 (4.9%) |
| 10 to 14 Years | 449 (7.9%) | 516 (7.4%) |
| 15 to 19 Years | 539 (9.4%) | 573 (8.2%) |
| 20 to 24 Years | 802 (14.0%) | 226 (3.2%) |
| 25 to 29 Years | 203 (3.5%) | 299 (4.3%) |
| 30 to 34 Years | 482 (8.4%) | 432 (6.2%) |
| 35 to 39 Years | 204 (3.6%) | 451 (6.4%) |
| 40 to 44 Years | 201 (3.5%) | 455 (6.5%) |
| 45 to 49 Years | 466 (8.2%) | 721 (10.3%) |
| 50 to 54 Years | 337 (5.9%) | 362 (5.2%) |
| 55 to 59 Years | 362 (6.3%) | 696 (9.9%) |
| 60 to 64 Years | 278 (4.9%) | 311 (4.4%) |
| 65 to 69 Years | 246 (4.3%) | 374 (5.3%) |
| 70 to 74 Years | 176 (3.1%) | 373 (5.3%) |
| 75 to 79 Years | 162 (2.8%) | 204 (2.9%) |
| 80 to 84 Years | 93 (1.6%) | 149 (2.1%) |
| 85 Years and over | 126 (2.2%) | 242 (3.5%) |
| Total | 5,716 (100.0%) | 7,005 (100.0%) |
Families and Households in Richton Park
Median Family Size in Richton Park
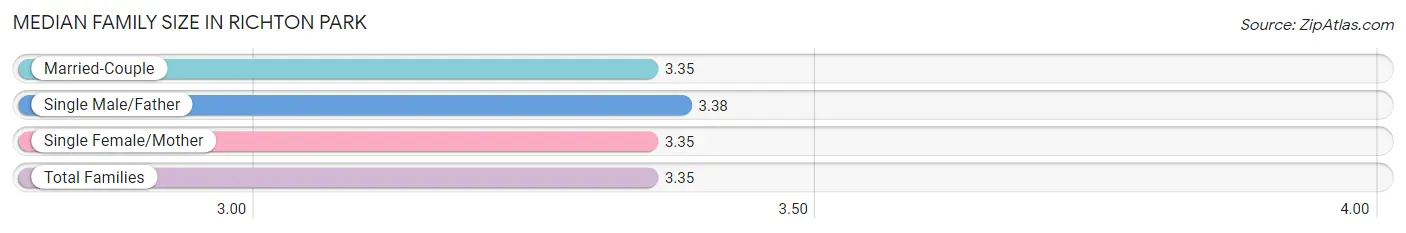
The median family size in Richton Park is 3.35 persons per family, with single male/father families (160 | 5.2%) accounting for the largest median family size of 3.38 persons per family. On the other hand, married-couple families (1,814 | 59.2%) represent the smallest median family size with 3.35 persons per family.
| Family Type | # Families | Family Size |
| Married-Couple | 1,814 (59.2%) | 3.35 |
| Single Male/Father | 160 (5.2%) | 3.38 |
| Single Female/Mother | 1,090 (35.6%) | 3.35 |
| Total Families | 3,064 (100.0%) | 3.35 |
Median Household Size in Richton Park
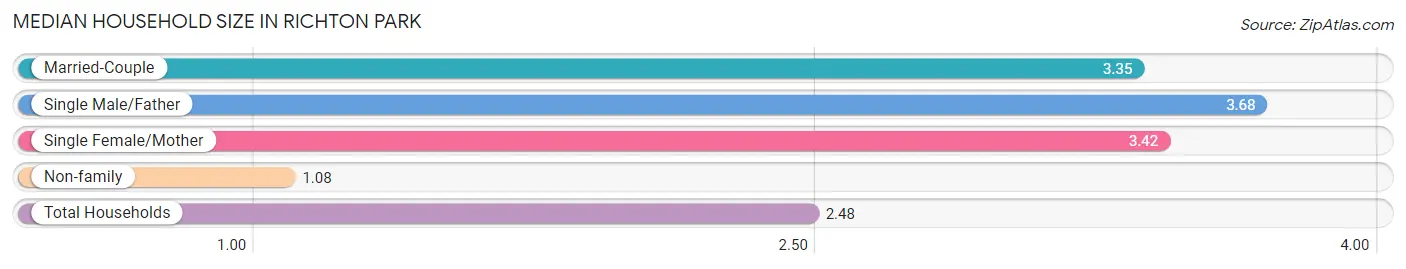
The median household size in Richton Park is 2.48 persons per household, with single male/father households (160 | 3.2%) accounting for the largest median household size of 3.68 persons per household. non-family households (2,011 | 39.6%) represent the smallest median household size with 1.08 persons per household.
| Household Type | # Households | Household Size |
| Married-Couple | 1,814 (35.7%) | 3.35 |
| Single Male/Father | 160 (3.2%) | 3.68 |
| Single Female/Mother | 1,090 (21.5%) | 3.42 |
| Non-family | 2,011 (39.6%) | 1.08 |
| Total Households | 5,075 (100.0%) | 2.48 |
Household Size by Marriage Status in Richton Park
Out of a total of 5,075 households in Richton Park, 3,064 (60.4%) are family households, while 2,011 (39.6%) are nonfamily households. The most numerous type of family households are 2-person households, comprising 1,091, and the most common type of nonfamily households are 1-person households, comprising 1,856.
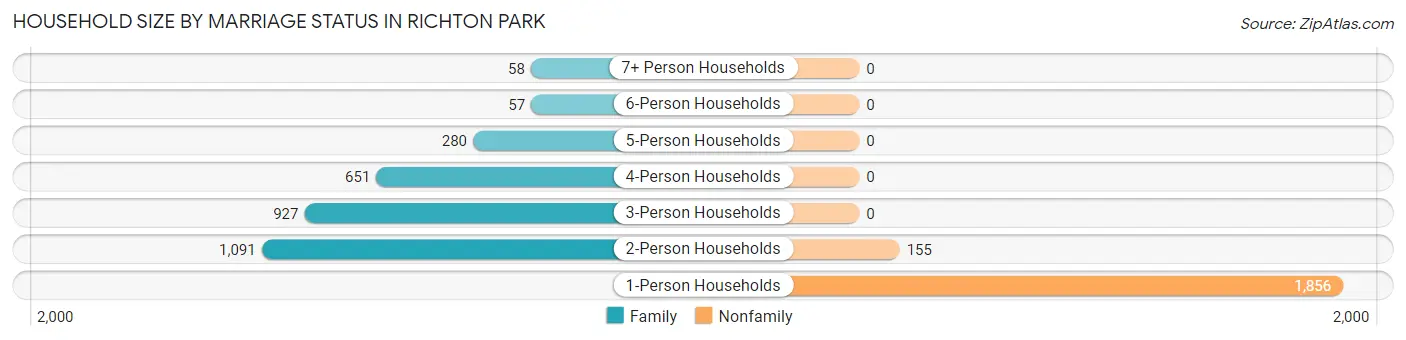
| Household Size | Family Households | Nonfamily Households |
| 1-Person Households | - | 1,856 (36.6%) |
| 2-Person Households | 1,091 (21.5%) | 155 (3.0%) |
| 3-Person Households | 927 (18.3%) | 0 (0.0%) |
| 4-Person Households | 651 (12.8%) | 0 (0.0%) |
| 5-Person Households | 280 (5.5%) | 0 (0.0%) |
| 6-Person Households | 57 (1.1%) | 0 (0.0%) |
| 7+ Person Households | 58 (1.1%) | 0 (0.0%) |
| Total | 3,064 (60.4%) | 2,011 (39.6%) |
Female Fertility in Richton Park
Fertility by Age in Richton Park
Average fertility rate in Richton Park is 41.0 births per 1,000 women. Women in the age bracket of 20 to 34 years have the highest fertility rate with 74.0 births per 1,000 women. Women in the age bracket of 20 to 34 years acount for 53.8% of all women with births.
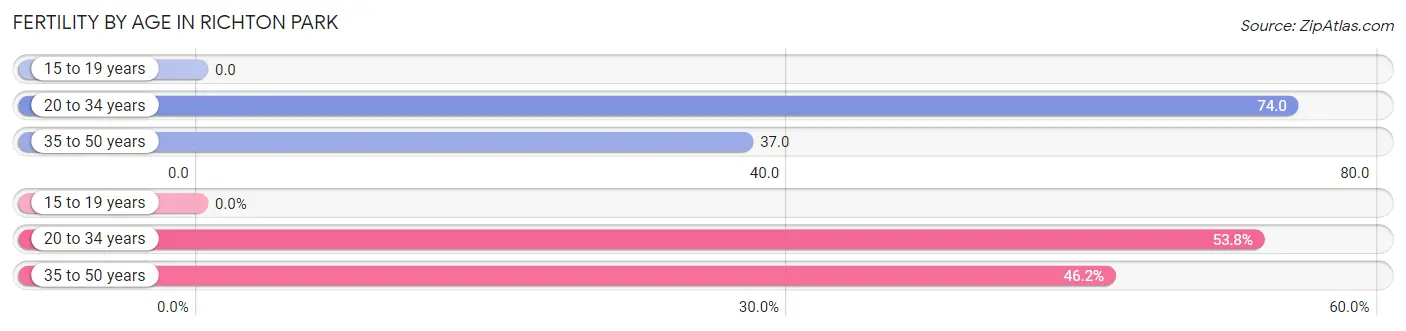
| Age Bracket | Women with Births | Births / 1,000 Women |
| 15 to 19 years | 0 (0.0%) | 0.0 |
| 20 to 34 years | 71 (53.8%) | 74.0 |
| 35 to 50 years | 61 (46.2%) | 37.0 |
| Total | 132 (100.0%) | 41.0 |
Fertility by Age by Marriage Status in Richton Park
41.7% of women with births (132) in Richton Park are married. The highest percentage of unmarried women with births falls into 35 to 50 years age bracket with 85.3% of them unmarried at the time of birth, while the lowest percentage of unmarried women with births belong to 20 to 34 years age bracket with 35.2% of them unmarried.
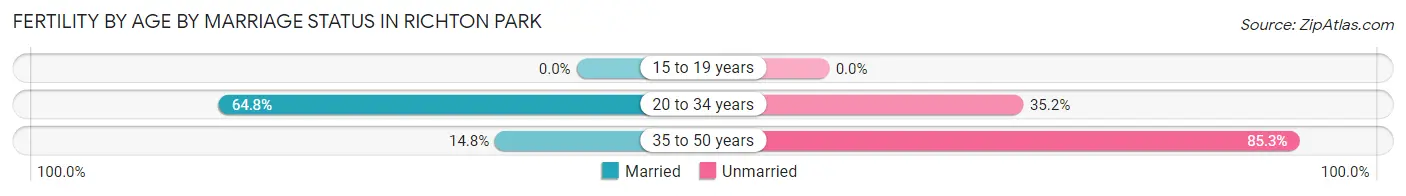
| Age Bracket | Married | Unmarried |
| 15 to 19 years | 0 (0.0%) | 0 (0.0%) |
| 20 to 34 years | 46 (64.8%) | 25 (35.2%) |
| 35 to 50 years | 9 (14.7%) | 52 (85.3%) |
| Total | 55 (41.7%) | 77 (58.3%) |
Fertility by Education in Richton Park
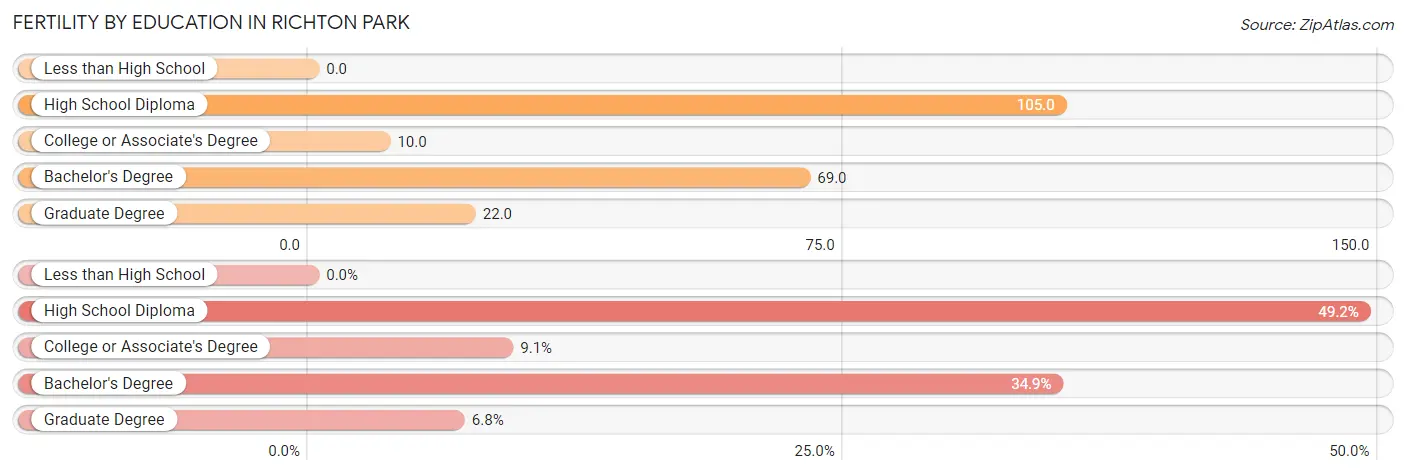
| Educational Attainment | Women with Births | Births / 1,000 Women |
| Less than High School | 0 (0.0%) | 0.0 |
| High School Diploma | 65 (49.2%) | 105.0 |
| College or Associate's Degree | 12 (9.1%) | 10.0 |
| Bachelor's Degree | 46 (34.8%) | 69.0 |
| Graduate Degree | 9 (6.8%) | 22.0 |
| Total | 132 (100.0%) | 41.0 |
Fertility by Education by Marriage Status in Richton Park
58.3% of women with births in Richton Park are unmarried. Women with the educational attainment of bachelor's degree are most likely to be married with 100.0% of them married at childbirth, while women with the educational attainment of high school diploma are least likely to be married with 100.0% of them unmarried at childbirth.
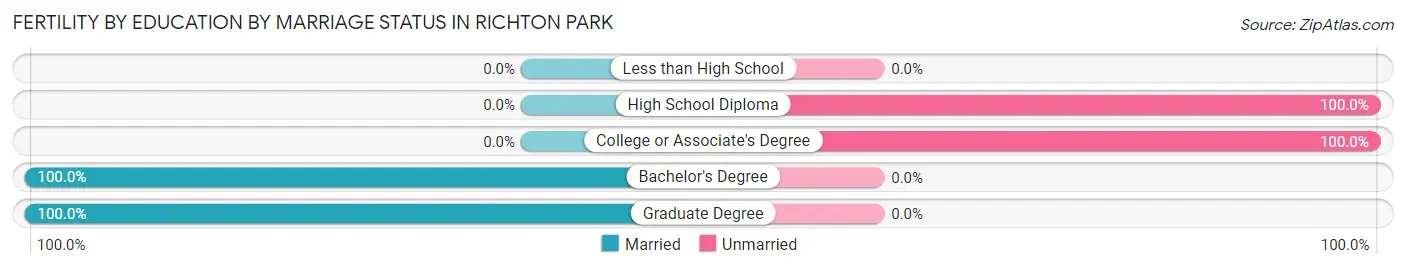
| Educational Attainment | Married | Unmarried |
| Less than High School | 0 (0.0%) | 0 (0.0%) |
| High School Diploma | 0 (0.0%) | 65 (100.0%) |
| College or Associate's Degree | 0 (0.0%) | 12 (100.0%) |
| Bachelor's Degree | 46 (100.0%) | 0 (0.0%) |
| Graduate Degree | 9 (100.0%) | 0 (0.0%) |
| Total | 55 (41.7%) | 77 (58.3%) |
Employment Characteristics in Richton Park
Employment by Class of Employer in Richton Park
Among the 5,739 employed individuals in Richton Park, private company employees (3,290 | 57.3%), local government employees (736 | 12.8%), and not-for-profit organizations (611 | 10.6%) make up the most common classes of employment.
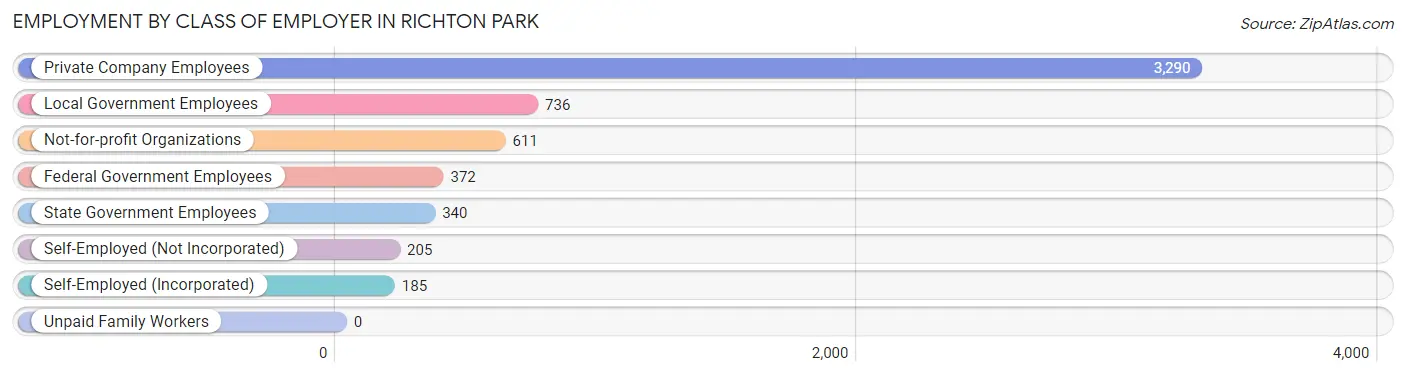
| Employer Class | # Employees | % Employees |
| Private Company Employees | 3,290 | 57.3% |
| Self-Employed (Incorporated) | 185 | 3.2% |
| Self-Employed (Not Incorporated) | 205 | 3.6% |
| Not-for-profit Organizations | 611 | 10.6% |
| Local Government Employees | 736 | 12.8% |
| State Government Employees | 340 | 5.9% |
| Federal Government Employees | 372 | 6.5% |
| Unpaid Family Workers | 0 | 0.0% |
| Total | 5,739 | 100.0% |
Employment Status by Age in Richton Park
According to the labor force statistics for Richton Park, out of the total population over 16 years of age (10,297), 65.9% or 6,786 individuals are in the labor force, with 12.3% or 835 of them unemployed. The age group with the highest labor force participation rate is 30 to 34 years, with 93.3% or 853 individuals in the labor force. Within the labor force, the 20 to 24 years age range has the highest percentage of unemployed individuals, with 34.6% or 281 of them being unemployed.
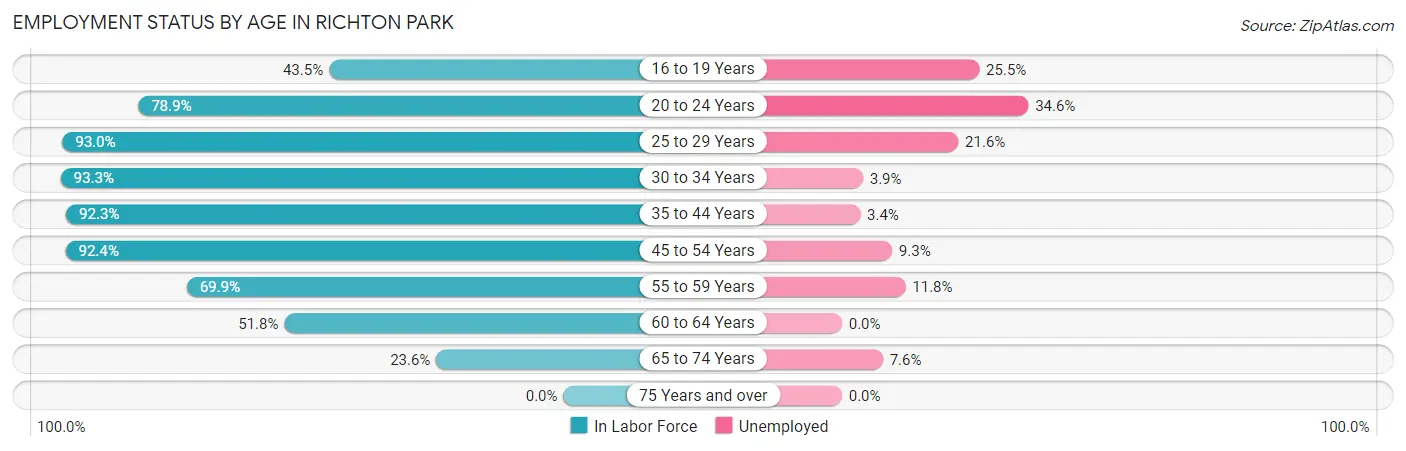
| Age Bracket | In Labor Force | Unemployed |
| 16 to 19 Years | 376 (43.5%) | 96 (25.5%) |
| 20 to 24 Years | 811 (78.9%) | 281 (34.6%) |
| 25 to 29 Years | 467 (93.0%) | 101 (21.6%) |
| 30 to 34 Years | 853 (93.3%) | 33 (3.9%) |
| 35 to 44 Years | 1,210 (92.3%) | 41 (3.4%) |
| 45 to 54 Years | 1,743 (92.4%) | 162 (9.3%) |
| 55 to 59 Years | 740 (69.9%) | 87 (11.8%) |
| 60 to 64 Years | 305 (51.8%) | 0 (0.0%) |
| 65 to 74 Years | 276 (23.6%) | 21 (7.6%) |
| 75 Years and over | 0 (0.0%) | 0 (0.0%) |
| Total | 6,786 (65.9%) | 835 (12.3%) |
Employment Status by Educational Attainment in Richton Park
According to labor force statistics for Richton Park, 85.0% of individuals (5,321) out of the total population between 25 and 64 years of age (6,260) are in the labor force, with 8.1% or 431 of them being unemployed. The group with the highest labor force participation rate are those with the educational attainment of bachelor's degree or higher, with 89.2% or 2,031 individuals in the labor force. Within the labor force, individuals with less than high school education have the highest percentage of unemployment, with 13.0% or 16 of them being unemployed.
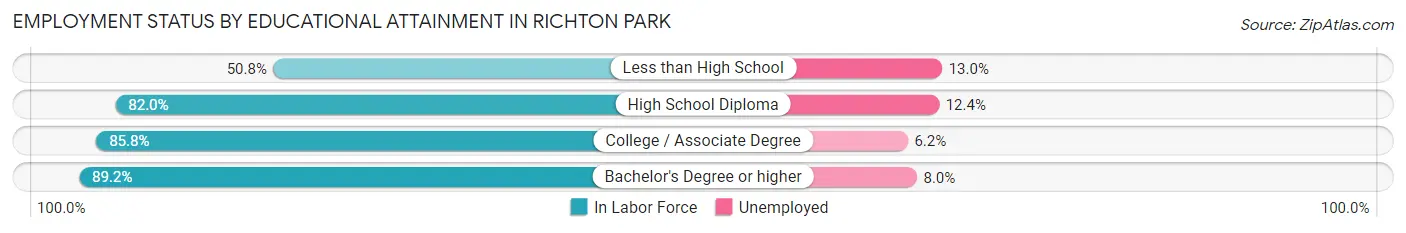
| Educational Attainment | In Labor Force | Unemployed |
| Less than High School | 123 (50.8%) | 31 (13.0%) |
| High School Diploma | 941 (82.0%) | 142 (12.4%) |
| College / Associate Degree | 2,226 (85.8%) | 161 (6.2%) |
| Bachelor's Degree or higher | 2,031 (89.2%) | 182 (8.0%) |
| Total | 5,321 (85.0%) | 507 (8.1%) |
Employment Occupations by Sex in Richton Park
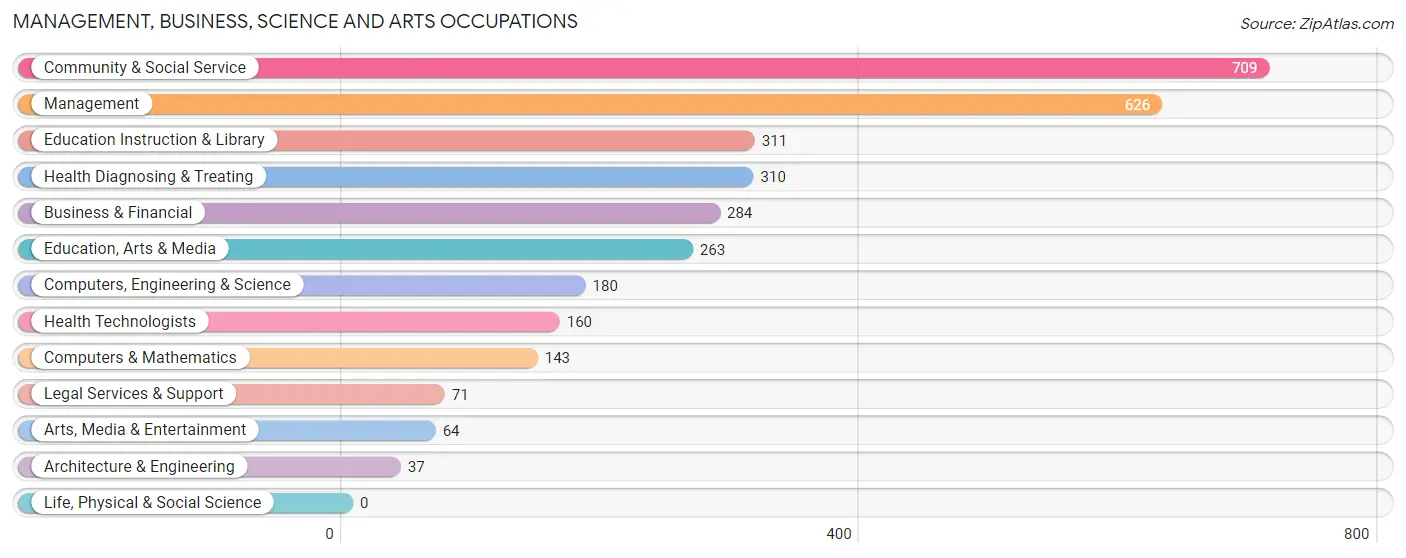
Management, Business, Science and Arts Occupations
The most common Management, Business, Science and Arts occupations in Richton Park are Community & Social Service (709 | 12.2%), Management (626 | 10.8%), Education Instruction & Library (311 | 5.3%), Health Diagnosing & Treating (310 | 5.3%), and Business & Financial (284 | 4.9%).
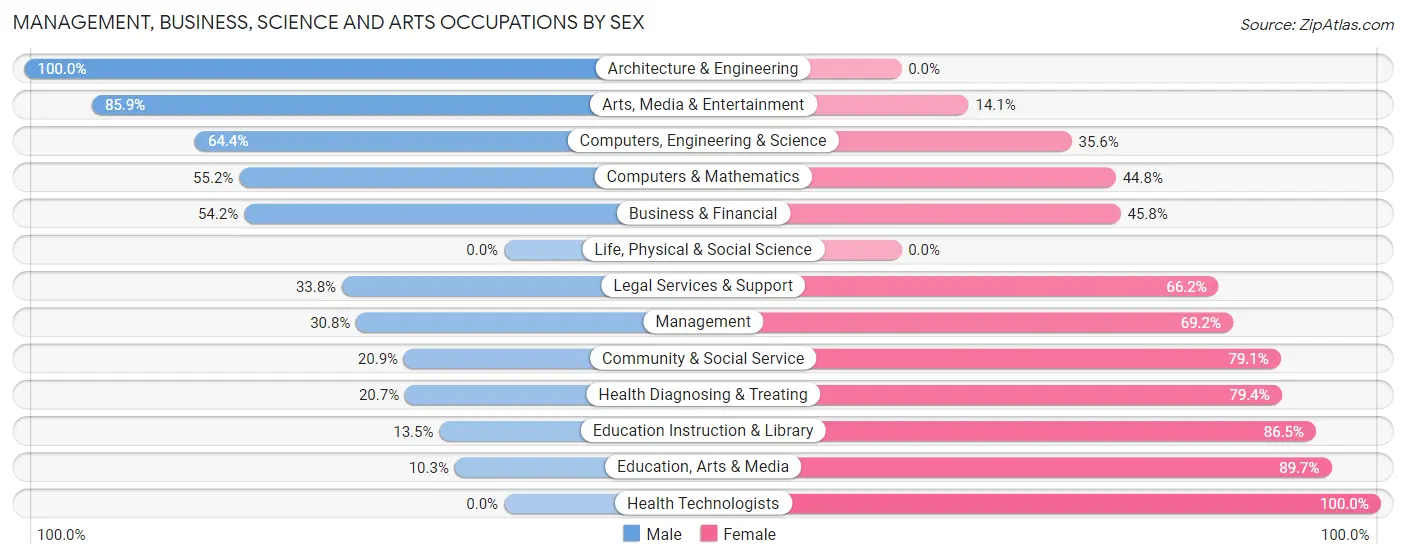
Management, Business, Science and Arts Occupations by Sex
Within the Management, Business, Science and Arts occupations in Richton Park, the most male-oriented occupations are Architecture & Engineering (100.0%), Arts, Media & Entertainment (85.9%), and Computers, Engineering & Science (64.4%), while the most female-oriented occupations are Health Technologists (100.0%), Education, Arts & Media (89.7%), and Education Instruction & Library (86.5%).
| Occupation | Male | Female |
| Management | 193 (30.8%) | 433 (69.2%) |
| Business & Financial | 154 (54.2%) | 130 (45.8%) |
| Computers, Engineering & Science | 116 (64.4%) | 64 (35.6%) |
| Computers & Mathematics | 79 (55.2%) | 64 (44.8%) |
| Architecture & Engineering | 37 (100.0%) | 0 (0.0%) |
| Life, Physical & Social Science | 0 (0.0%) | 0 (0.0%) |
| Community & Social Service | 148 (20.9%) | 561 (79.1%) |
| Education, Arts & Media | 27 (10.3%) | 236 (89.7%) |
| Legal Services & Support | 24 (33.8%) | 47 (66.2%) |
| Education Instruction & Library | 42 (13.5%) | 269 (86.5%) |
| Arts, Media & Entertainment | 55 (85.9%) | 9 (14.1%) |
| Health Diagnosing & Treating | 64 (20.6%) | 246 (79.3%) |
| Health Technologists | 0 (0.0%) | 160 (100.0%) |
| Total (Category) | 675 (32.0%) | 1,434 (68.0%) |
| Total (Overall) | 2,542 (43.7%) | 3,278 (56.3%) |
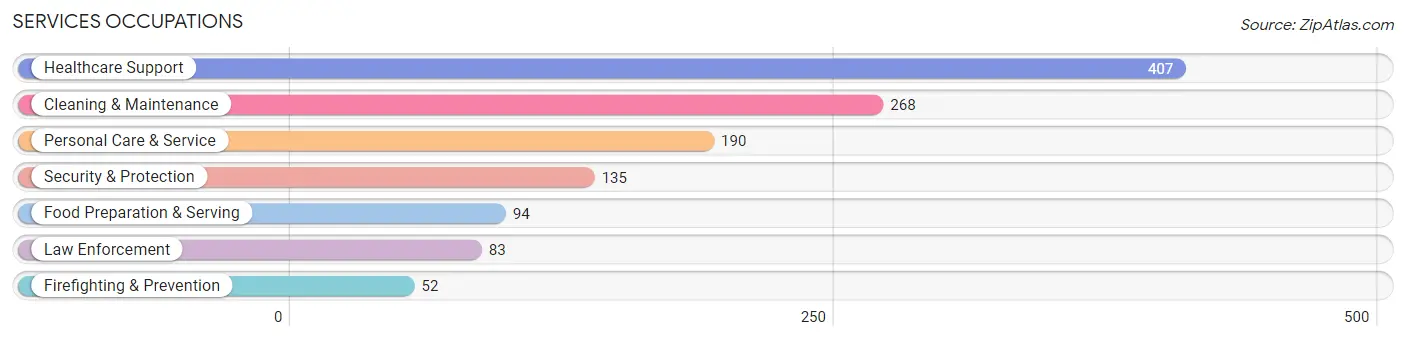
Services Occupations
The most common Services occupations in Richton Park are Healthcare Support (407 | 7.0%), Cleaning & Maintenance (268 | 4.6%), Personal Care & Service (190 | 3.3%), Security & Protection (135 | 2.3%), and Food Preparation & Serving (94 | 1.6%).
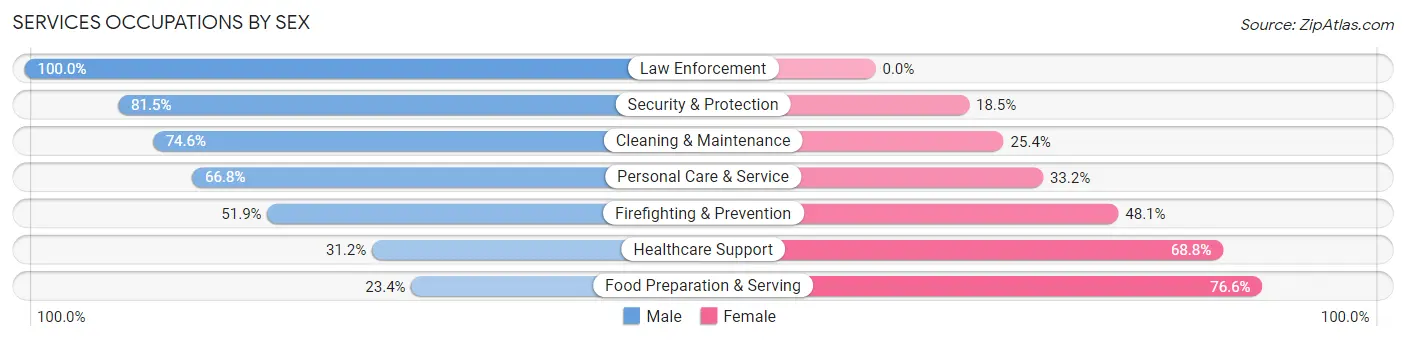
Services Occupations by Sex
Within the Services occupations in Richton Park, the most male-oriented occupations are Law Enforcement (100.0%), Security & Protection (81.5%), and Cleaning & Maintenance (74.6%), while the most female-oriented occupations are Food Preparation & Serving (76.6%), Healthcare Support (68.8%), and Firefighting & Prevention (48.1%).
| Occupation | Male | Female |
| Healthcare Support | 127 (31.2%) | 280 (68.8%) |
| Security & Protection | 110 (81.5%) | 25 (18.5%) |
| Firefighting & Prevention | 27 (51.9%) | 25 (48.1%) |
| Law Enforcement | 83 (100.0%) | 0 (0.0%) |
| Food Preparation & Serving | 22 (23.4%) | 72 (76.6%) |
| Cleaning & Maintenance | 200 (74.6%) | 68 (25.4%) |
| Personal Care & Service | 127 (66.8%) | 63 (33.2%) |
| Total (Category) | 586 (53.6%) | 508 (46.4%) |
| Total (Overall) | 2,542 (43.7%) | 3,278 (56.3%) |
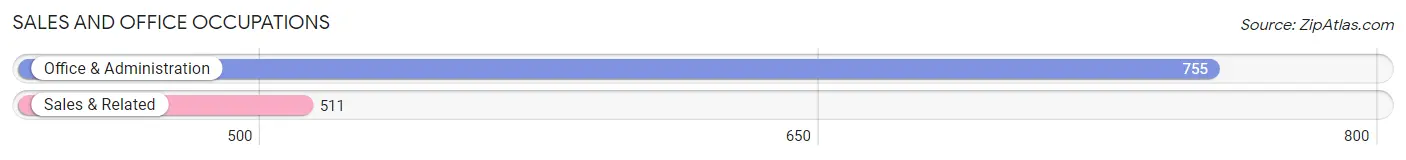
Sales and Office Occupations
The most common Sales and Office occupations in Richton Park are Office & Administration (755 | 13.0%), and Sales & Related (511 | 8.8%).
Sales and Office Occupations by Sex
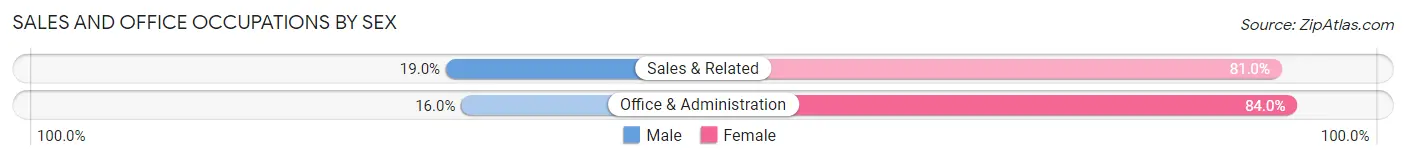
| Occupation | Male | Female |
| Sales & Related | 97 (19.0%) | 414 (81.0%) |
| Office & Administration | 121 (16.0%) | 634 (84.0%) |
| Total (Category) | 218 (17.2%) | 1,048 (82.8%) |
| Total (Overall) | 2,542 (43.7%) | 3,278 (56.3%) |
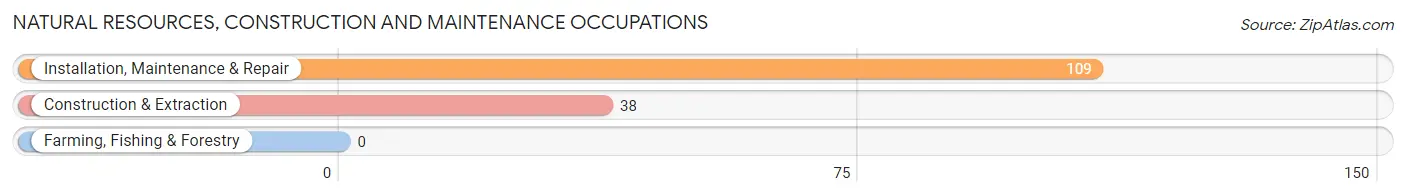
Natural Resources, Construction and Maintenance Occupations
The most common Natural Resources, Construction and Maintenance occupations in Richton Park are Installation, Maintenance & Repair (109 | 1.9%), and Construction & Extraction (38 | 0.6%).
Natural Resources, Construction and Maintenance Occupations by Sex
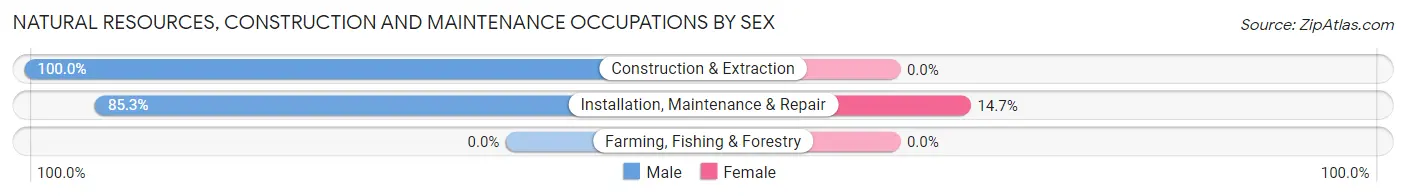
| Occupation | Male | Female |
| Farming, Fishing & Forestry | 0 (0.0%) | 0 (0.0%) |
| Construction & Extraction | 38 (100.0%) | 0 (0.0%) |
| Installation, Maintenance & Repair | 93 (85.3%) | 16 (14.7%) |
| Total (Category) | 131 (89.1%) | 16 (10.9%) |
| Total (Overall) | 2,542 (43.7%) | 3,278 (56.3%) |
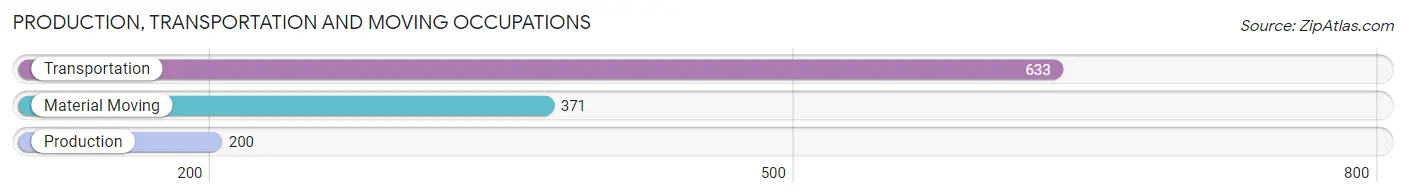
Production, Transportation and Moving Occupations
The most common Production, Transportation and Moving occupations in Richton Park are Transportation (633 | 10.9%), Material Moving (371 | 6.4%), and Production (200 | 3.4%).
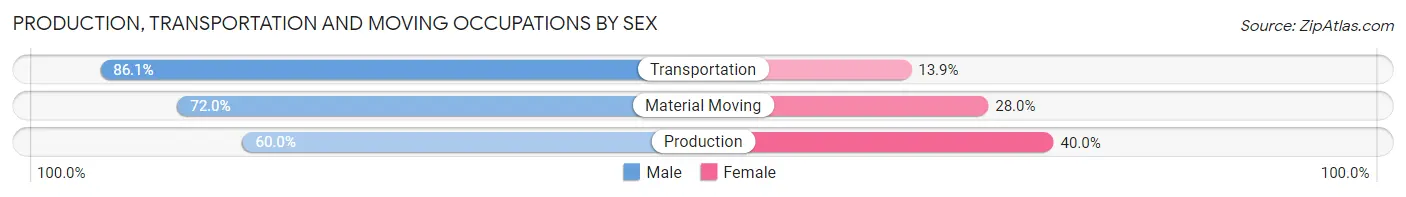
Production, Transportation and Moving Occupations by Sex
| Occupation | Male | Female |
| Production | 120 (60.0%) | 80 (40.0%) |
| Transportation | 545 (86.1%) | 88 (13.9%) |
| Material Moving | 267 (72.0%) | 104 (28.0%) |
| Total (Category) | 932 (77.4%) | 272 (22.6%) |
| Total (Overall) | 2,542 (43.7%) | 3,278 (56.3%) |
Employment Industries by Sex in Richton Park
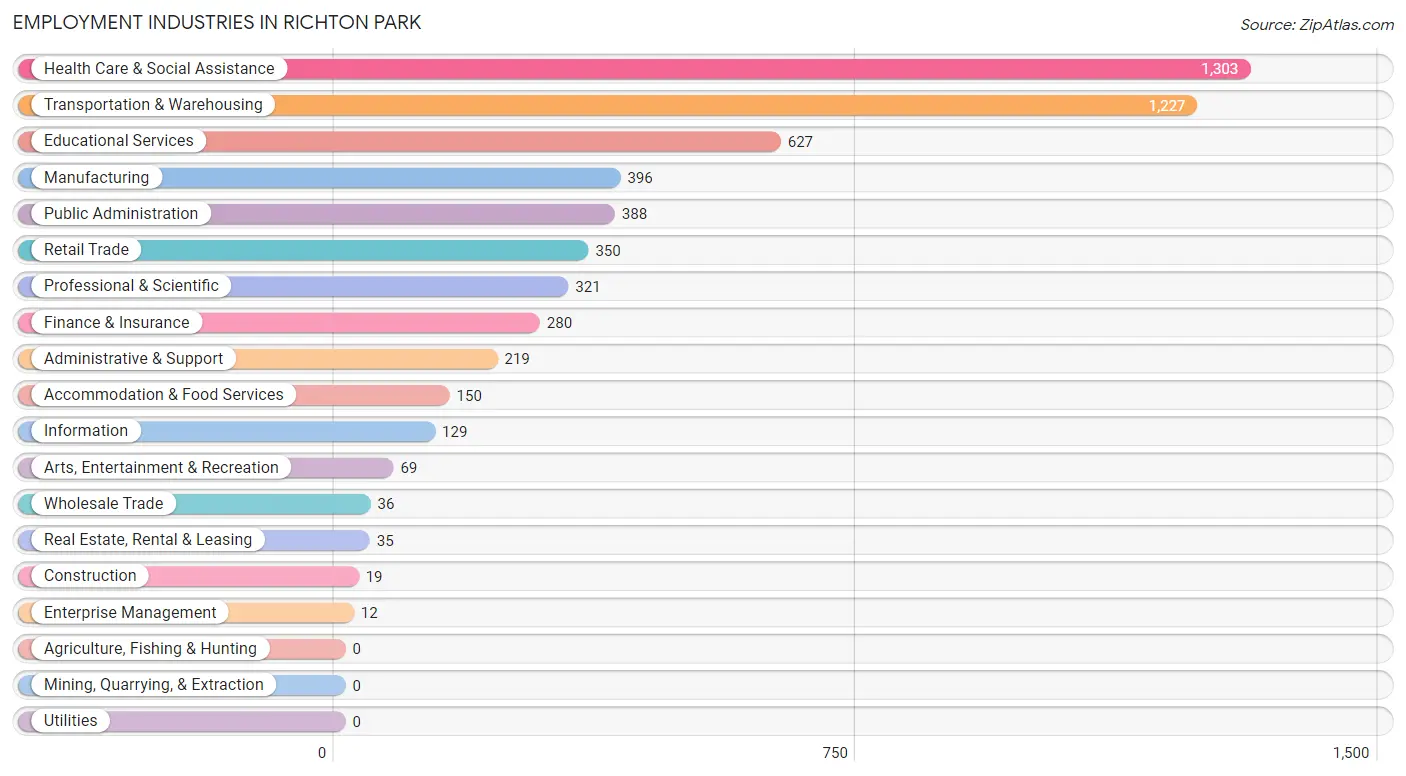
Employment Industries in Richton Park
The major employment industries in Richton Park include Health Care & Social Assistance (1,303 | 22.4%), Transportation & Warehousing (1,227 | 21.1%), Educational Services (627 | 10.8%), Manufacturing (396 | 6.8%), and Public Administration (388 | 6.7%).
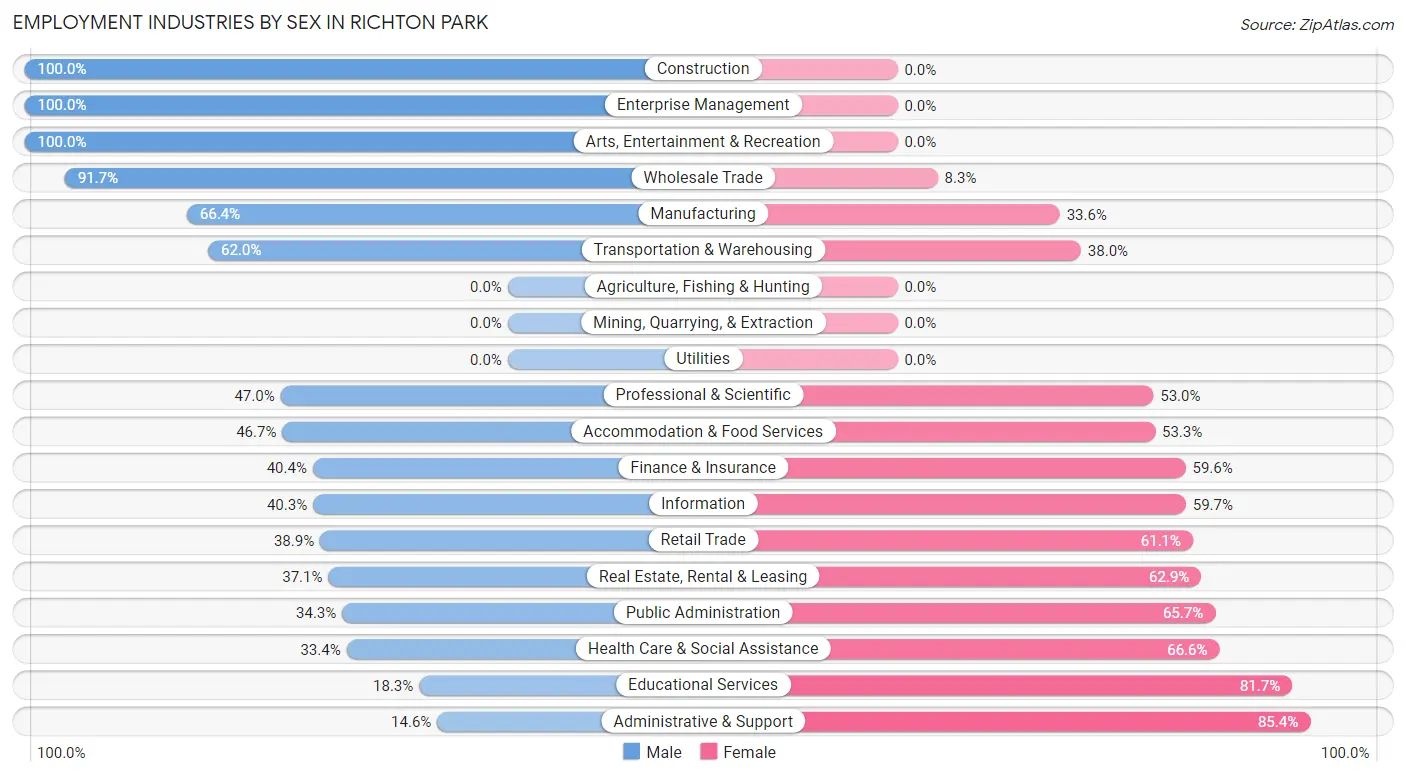
Employment Industries by Sex in Richton Park
The Richton Park industries that see more men than women are Construction (100.0%), Enterprise Management (100.0%), and Arts, Entertainment & Recreation (100.0%), whereas the industries that tend to have a higher number of women are Administrative & Support (85.4%), Educational Services (81.7%), and Health Care & Social Assistance (66.6%).
| Industry | Male | Female |
| Agriculture, Fishing & Hunting | 0 (0.0%) | 0 (0.0%) |
| Mining, Quarrying, & Extraction | 0 (0.0%) | 0 (0.0%) |
| Construction | 19 (100.0%) | 0 (0.0%) |
| Manufacturing | 263 (66.4%) | 133 (33.6%) |
| Wholesale Trade | 33 (91.7%) | 3 (8.3%) |
| Retail Trade | 136 (38.9%) | 214 (61.1%) |
| Transportation & Warehousing | 761 (62.0%) | 466 (38.0%) |
| Utilities | 0 (0.0%) | 0 (0.0%) |
| Information | 52 (40.3%) | 77 (59.7%) |
| Finance & Insurance | 113 (40.4%) | 167 (59.6%) |
| Real Estate, Rental & Leasing | 13 (37.1%) | 22 (62.9%) |
| Professional & Scientific | 151 (47.0%) | 170 (53.0%) |
| Enterprise Management | 12 (100.0%) | 0 (0.0%) |
| Administrative & Support | 32 (14.6%) | 187 (85.4%) |
| Educational Services | 115 (18.3%) | 512 (81.7%) |
| Health Care & Social Assistance | 435 (33.4%) | 868 (66.6%) |
| Arts, Entertainment & Recreation | 69 (100.0%) | 0 (0.0%) |
| Accommodation & Food Services | 70 (46.7%) | 80 (53.3%) |
| Public Administration | 133 (34.3%) | 255 (65.7%) |
| Total | 2,542 (43.7%) | 3,278 (56.3%) |
Education in Richton Park
School Enrollment in Richton Park
The most common levels of schooling among the 3,618 students in Richton Park are college / undergraduate (1,008 | 27.9%), high school (834 | 23.1%), and middle school (725 | 20.0%).
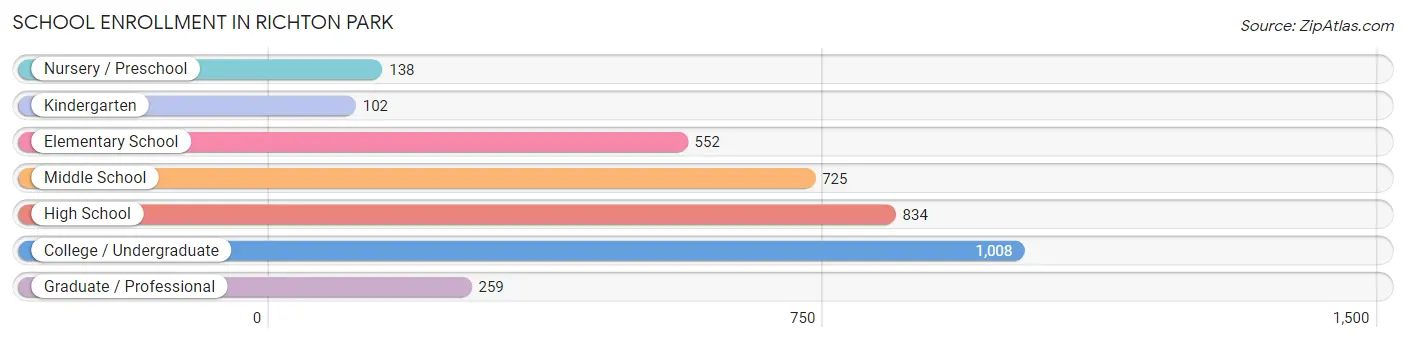
| School Level | # Students | % Students |
| Nursery / Preschool | 138 | 3.8% |
| Kindergarten | 102 | 2.8% |
| Elementary School | 552 | 15.3% |
| Middle School | 725 | 20.0% |
| High School | 834 | 23.1% |
| College / Undergraduate | 1,008 | 27.9% |
| Graduate / Professional | 259 | 7.2% |
| Total | 3,618 | 100.0% |
School Enrollment by Age by Funding Source in Richton Park
Out of a total of 3,618 students who are enrolled in schools in Richton Park, 658 (18.2%) attend a private institution, while the remaining 2,960 (81.8%) are enrolled in public schools. The age group of 25 to 34 year olds has the highest likelihood of being enrolled in private schools, with 153 (73.6% in the age bracket) enrolled. Conversely, the age group of 3 to 4 year olds has the lowest likelihood of being enrolled in a private school, with 78 (100.0% in the age bracket) attending a public institution.
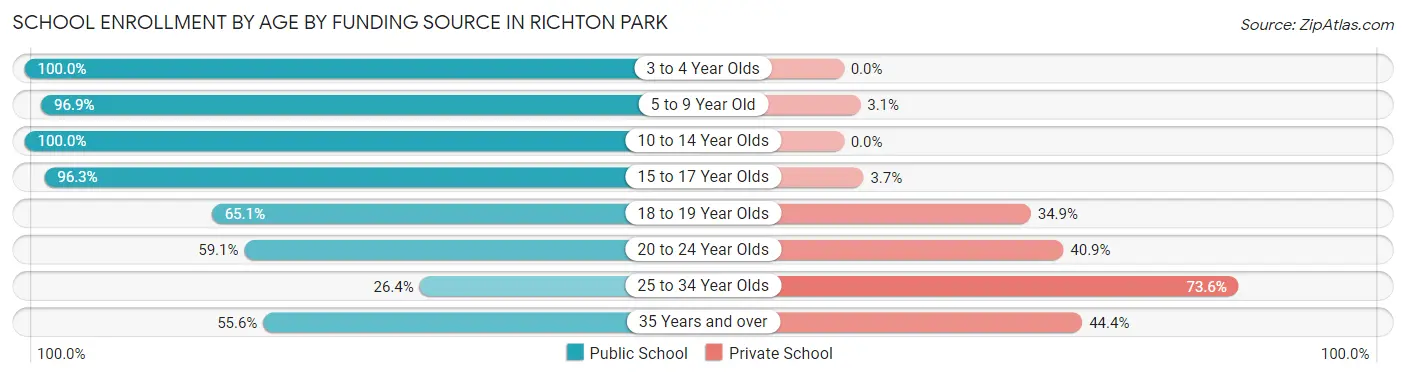
| Age Bracket | Public School | Private School |
| 3 to 4 Year Olds | 78 (100.0%) | 0 (0.0%) |
| 5 to 9 Year Old | 627 (96.9%) | 20 (3.1%) |
| 10 to 14 Year Olds | 933 (100.0%) | 0 (0.0%) |
| 15 to 17 Year Olds | 574 (96.3%) | 22 (3.7%) |
| 18 to 19 Year Olds | 185 (65.1%) | 99 (34.9%) |
| 20 to 24 Year Olds | 361 (59.1%) | 250 (40.9%) |
| 25 to 34 Year Olds | 55 (26.4%) | 153 (73.6%) |
| 35 Years and over | 145 (55.6%) | 116 (44.4%) |
| Total | 2,960 (81.8%) | 658 (18.2%) |
Educational Attainment by Field of Study in Richton Park
Business (675 | 24.8%), education (410 | 15.1%), science & technology (321 | 11.8%), psychology (237 | 8.7%), and arts & humanities (201 | 7.4%) are the most common fields of study among 2,720 individuals in Richton Park who have obtained a bachelor's degree or higher.
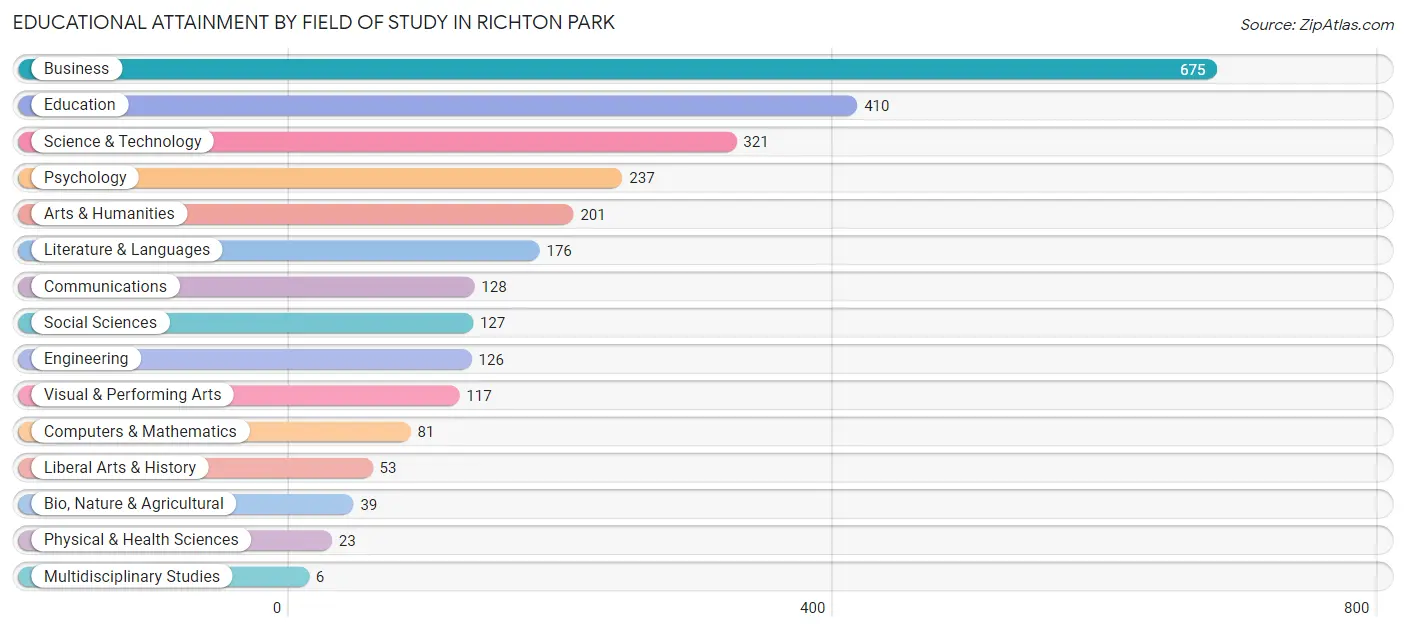
| Field of Study | # Graduates | % Graduates |
| Computers & Mathematics | 81 | 3.0% |
| Bio, Nature & Agricultural | 39 | 1.4% |
| Physical & Health Sciences | 23 | 0.9% |
| Psychology | 237 | 8.7% |
| Social Sciences | 127 | 4.7% |
| Engineering | 126 | 4.6% |
| Multidisciplinary Studies | 6 | 0.2% |
| Science & Technology | 321 | 11.8% |
| Business | 675 | 24.8% |
| Education | 410 | 15.1% |
| Literature & Languages | 176 | 6.5% |
| Liberal Arts & History | 53 | 1.9% |
| Visual & Performing Arts | 117 | 4.3% |
| Communications | 128 | 4.7% |
| Arts & Humanities | 201 | 7.4% |
| Total | 2,720 | 100.0% |
Transportation & Commute in Richton Park
Vehicle Availability by Sex in Richton Park
The most prevalent vehicle ownership categories in Richton Park are males with 2 vehicles (1,049, accounting for 41.7%) and females with 2 vehicles (1,139, making up 32.5%).
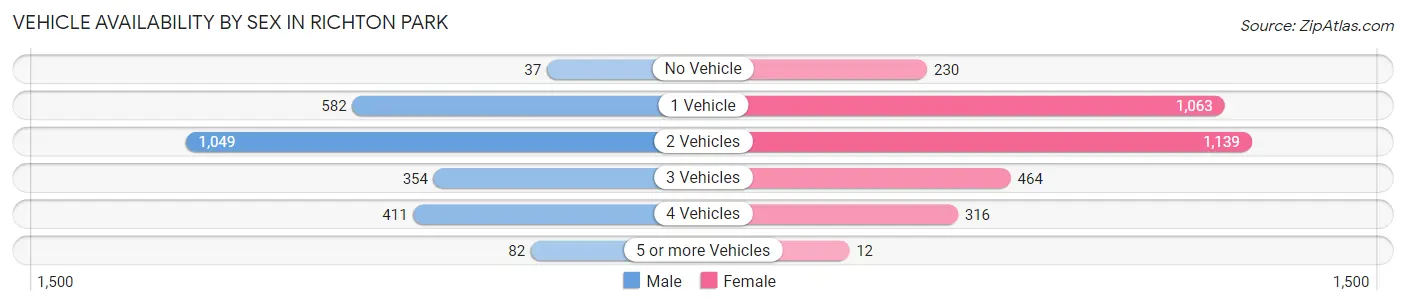
| Vehicles Available | Male | Female |
| No Vehicle | 37 (1.5%) | 230 (7.1%) |
| 1 Vehicle | 582 (23.1%) | 1,063 (33.0%) |
| 2 Vehicles | 1,049 (41.7%) | 1,139 (35.3%) |
| 3 Vehicles | 354 (14.1%) | 464 (14.4%) |
| 4 Vehicles | 411 (16.3%) | 316 (9.8%) |
| 5 or more Vehicles | 82 (3.3%) | 12 (0.4%) |
| Total | 2,515 (100.0%) | 3,224 (100.0%) |
Commute Time in Richton Park
The most frequently occuring commute durations in Richton Park are 20 to 24 minutes (899 commuters, 17.8%), 45 to 59 minutes (878 commuters, 17.4%), and 30 to 34 minutes (742 commuters, 14.7%).
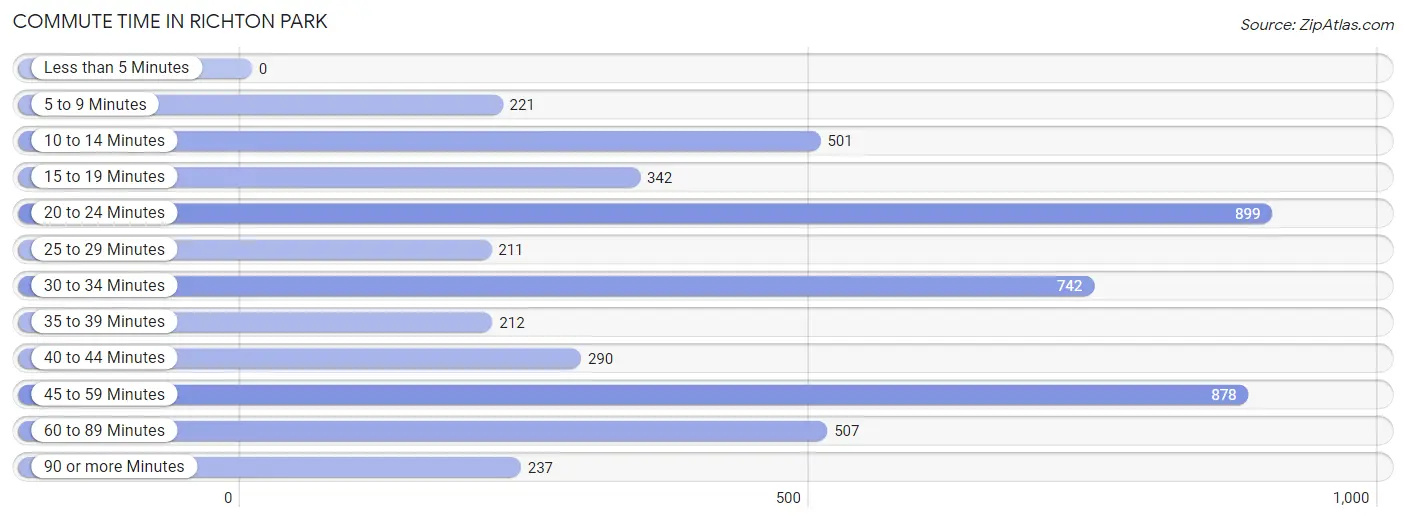
| Commute Time | # Commuters | % Commuters |
| Less than 5 Minutes | 0 | 0.0% |
| 5 to 9 Minutes | 221 | 4.4% |
| 10 to 14 Minutes | 501 | 9.9% |
| 15 to 19 Minutes | 342 | 6.8% |
| 20 to 24 Minutes | 899 | 17.8% |
| 25 to 29 Minutes | 211 | 4.2% |
| 30 to 34 Minutes | 742 | 14.7% |
| 35 to 39 Minutes | 212 | 4.2% |
| 40 to 44 Minutes | 290 | 5.8% |
| 45 to 59 Minutes | 878 | 17.4% |
| 60 to 89 Minutes | 507 | 10.1% |
| 90 or more Minutes | 237 | 4.7% |
Commute Time by Sex in Richton Park
The most common commute times in Richton Park are 30 to 34 minutes (441 commuters, 19.9%) for males and 20 to 24 minutes (592 commuters, 21.0%) for females.
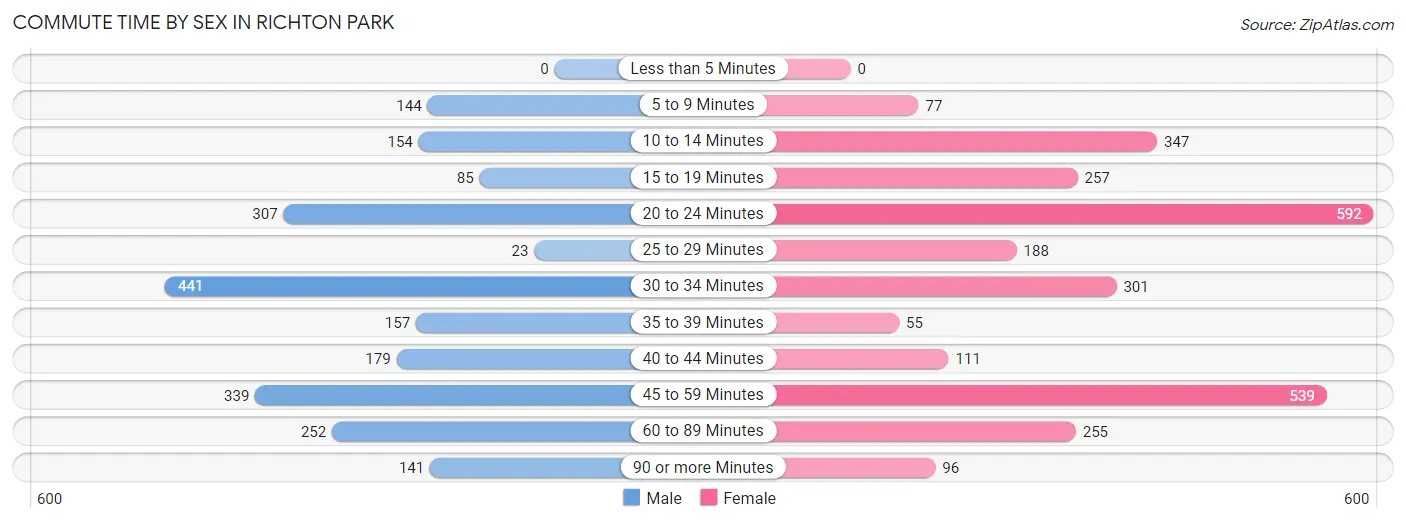
| Commute Time | Male | Female |
| Less than 5 Minutes | 0 (0.0%) | 0 (0.0%) |
| 5 to 9 Minutes | 144 (6.5%) | 77 (2.7%) |
| 10 to 14 Minutes | 154 (6.9%) | 347 (12.3%) |
| 15 to 19 Minutes | 85 (3.8%) | 257 (9.1%) |
| 20 to 24 Minutes | 307 (13.8%) | 592 (21.0%) |
| 25 to 29 Minutes | 23 (1.0%) | 188 (6.7%) |
| 30 to 34 Minutes | 441 (19.9%) | 301 (10.7%) |
| 35 to 39 Minutes | 157 (7.1%) | 55 (1.9%) |
| 40 to 44 Minutes | 179 (8.1%) | 111 (3.9%) |
| 45 to 59 Minutes | 339 (15.3%) | 539 (19.1%) |
| 60 to 89 Minutes | 252 (11.3%) | 255 (9.0%) |
| 90 or more Minutes | 141 (6.4%) | 96 (3.4%) |
Time of Departure to Work by Sex in Richton Park
The most frequent times of departure to work in Richton Park are 12:00 PM to 3:59 PM (455, 20.5%) for males and 7:00 AM to 7:29 AM (534, 19.0%) for females.
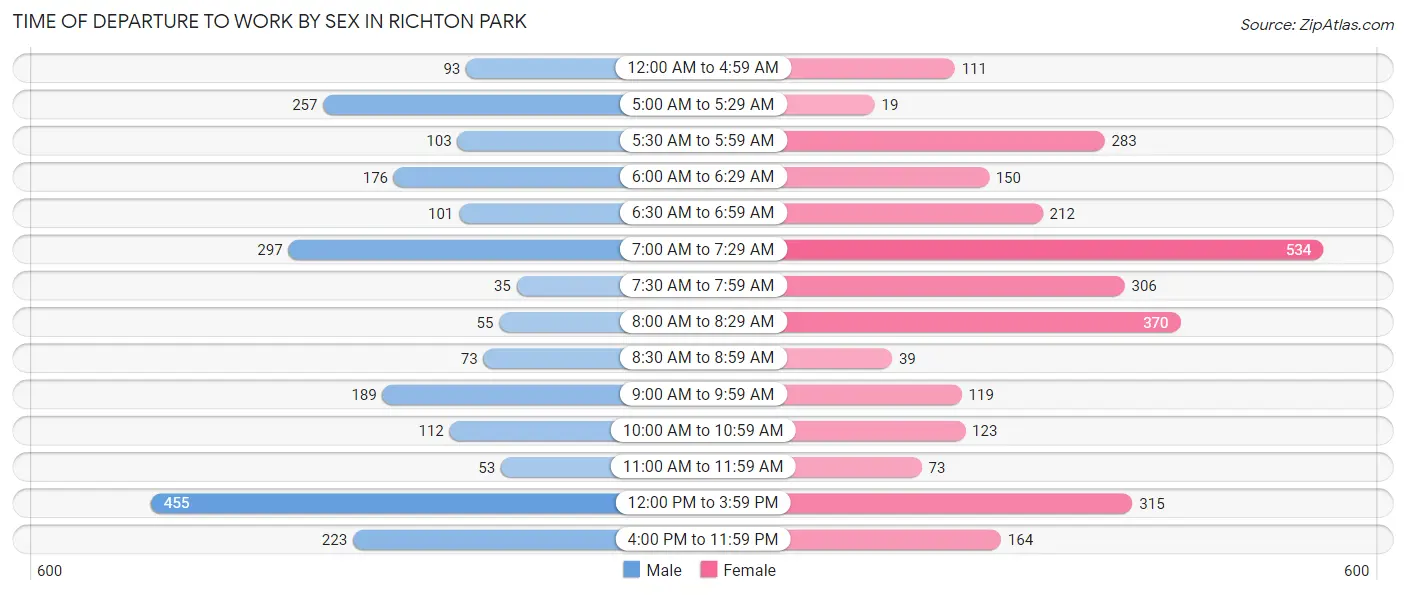
| Time of Departure | Male | Female |
| 12:00 AM to 4:59 AM | 93 (4.2%) | 111 (3.9%) |
| 5:00 AM to 5:29 AM | 257 (11.6%) | 19 (0.7%) |
| 5:30 AM to 5:59 AM | 103 (4.6%) | 283 (10.0%) |
| 6:00 AM to 6:29 AM | 176 (7.9%) | 150 (5.3%) |
| 6:30 AM to 6:59 AM | 101 (4.5%) | 212 (7.5%) |
| 7:00 AM to 7:29 AM | 297 (13.4%) | 534 (19.0%) |
| 7:30 AM to 7:59 AM | 35 (1.6%) | 306 (10.9%) |
| 8:00 AM to 8:29 AM | 55 (2.5%) | 370 (13.1%) |
| 8:30 AM to 8:59 AM | 73 (3.3%) | 39 (1.4%) |
| 9:00 AM to 9:59 AM | 189 (8.5%) | 119 (4.2%) |
| 10:00 AM to 10:59 AM | 112 (5.0%) | 123 (4.4%) |
| 11:00 AM to 11:59 AM | 53 (2.4%) | 73 (2.6%) |
| 12:00 PM to 3:59 PM | 455 (20.5%) | 315 (11.2%) |
| 4:00 PM to 11:59 PM | 223 (10.0%) | 164 (5.8%) |
| Total | 2,222 (100.0%) | 2,818 (100.0%) |
Housing Occupancy in Richton Park
Occupancy by Ownership in Richton Park
Of the total 5,075 dwellings in Richton Park, owner-occupied units account for 2,564 (50.5%), while renter-occupied units make up 2,511 (49.5%).
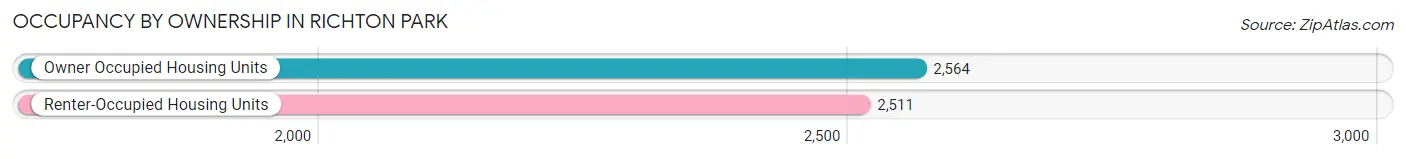
| Occupancy | # Housing Units | % Housing Units |
| Owner Occupied Housing Units | 2,564 | 50.5% |
| Renter-Occupied Housing Units | 2,511 | 49.5% |
| Total Occupied Housing Units | 5,075 | 100.0% |
Occupancy by Household Size in Richton Park
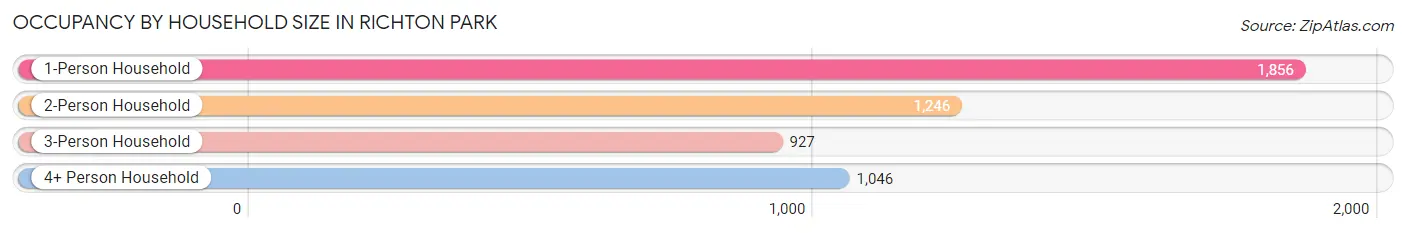
| Household Size | # Housing Units | % Housing Units |
| 1-Person Household | 1,856 | 36.6% |
| 2-Person Household | 1,246 | 24.5% |
| 3-Person Household | 927 | 18.3% |
| 4+ Person Household | 1,046 | 20.6% |
| Total Housing Units | 5,075 | 100.0% |
Occupancy by Ownership by Household Size in Richton Park
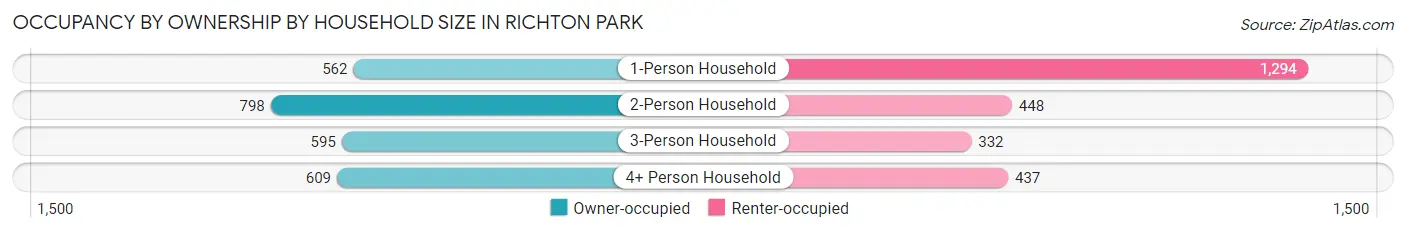
| Household Size | Owner-occupied | Renter-occupied |
| 1-Person Household | 562 (30.3%) | 1,294 (69.7%) |
| 2-Person Household | 798 (64.0%) | 448 (36.0%) |
| 3-Person Household | 595 (64.2%) | 332 (35.8%) |
| 4+ Person Household | 609 (58.2%) | 437 (41.8%) |
| Total Housing Units | 2,564 (50.5%) | 2,511 (49.5%) |
Occupancy by Educational Attainment in Richton Park
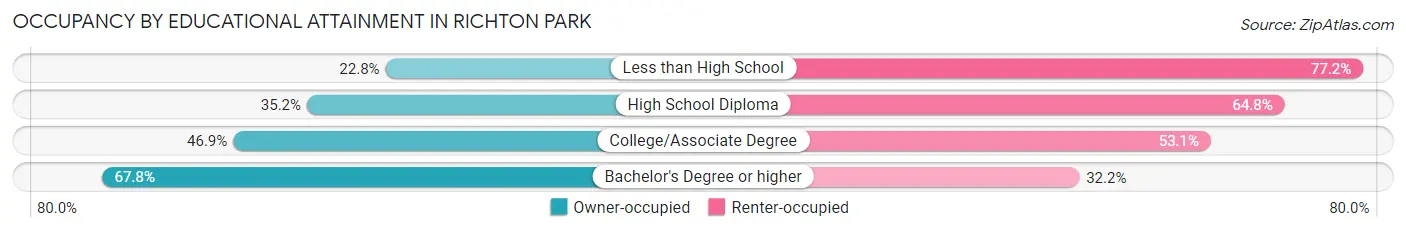
| Household Size | Owner-occupied | Renter-occupied |
| Less than High School | 46 (22.8%) | 156 (77.2%) |
| High School Diploma | 346 (35.2%) | 636 (64.8%) |
| College/Associate Degree | 1,048 (46.9%) | 1,185 (53.1%) |
| Bachelor's Degree or higher | 1,124 (67.8%) | 534 (32.2%) |
Occupancy by Age of Householder in Richton Park
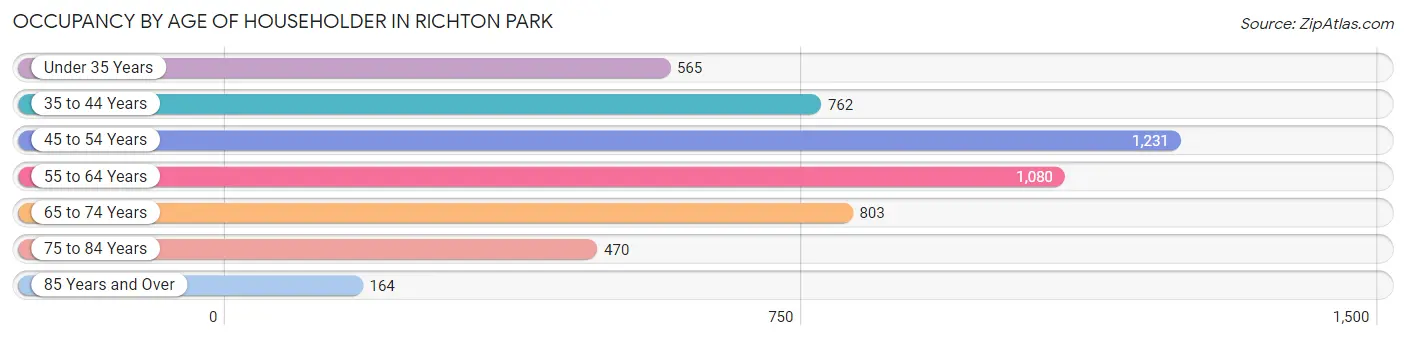
| Age Bracket | # Households | % Households |
| Under 35 Years | 565 | 11.1% |
| 35 to 44 Years | 762 | 15.0% |
| 45 to 54 Years | 1,231 | 24.3% |
| 55 to 64 Years | 1,080 | 21.3% |
| 65 to 74 Years | 803 | 15.8% |
| 75 to 84 Years | 470 | 9.3% |
| 85 Years and Over | 164 | 3.2% |
| Total | 5,075 | 100.0% |
Housing Finances in Richton Park
Median Income by Occupancy in Richton Park
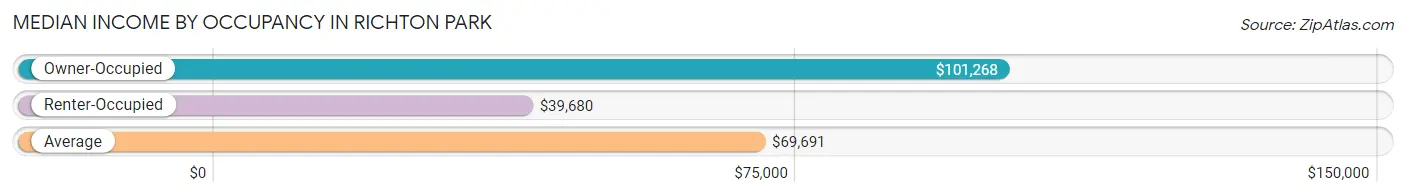
| Occupancy Type | # Households | Median Income |
| Owner-Occupied | 2,564 (50.5%) | $101,268 |
| Renter-Occupied | 2,511 (49.5%) | $39,680 |
| Average | 5,075 (100.0%) | $69,691 |
Occupancy by Householder Income Bracket in Richton Park
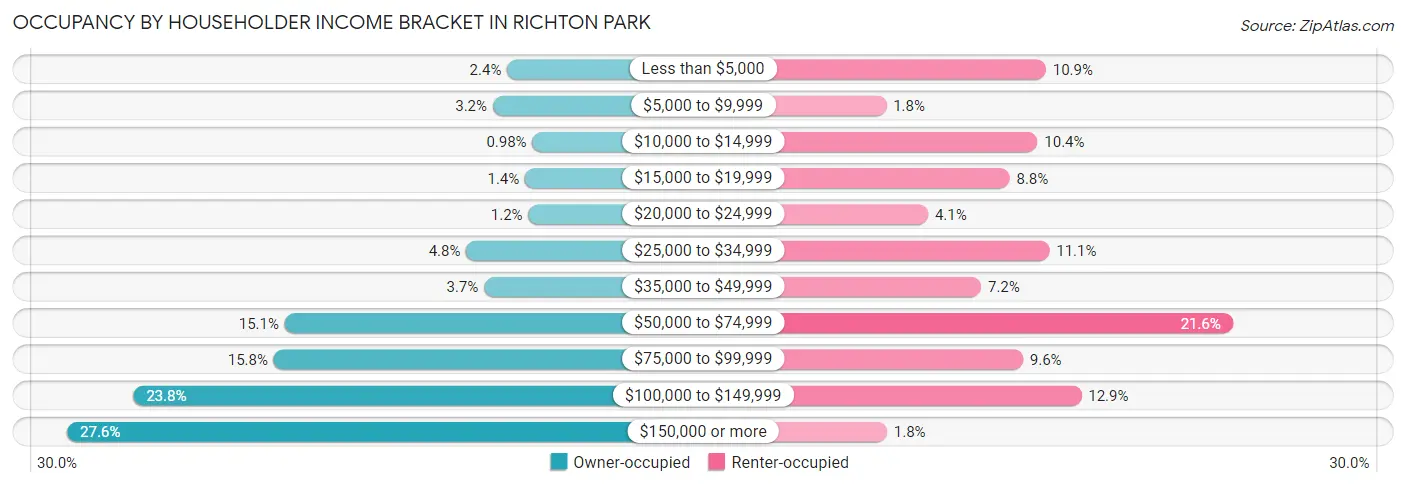
| Income Bracket | Owner-occupied | Renter-occupied |
| Less than $5,000 | 62 (2.4%) | 273 (10.9%) |
| $5,000 to $9,999 | 83 (3.2%) | 44 (1.8%) |
| $10,000 to $14,999 | 25 (1.0%) | 261 (10.4%) |
| $15,000 to $19,999 | 36 (1.4%) | 221 (8.8%) |
| $20,000 to $24,999 | 31 (1.2%) | 104 (4.1%) |
| $25,000 to $34,999 | 122 (4.8%) | 278 (11.1%) |
| $35,000 to $49,999 | 96 (3.7%) | 180 (7.2%) |
| $50,000 to $74,999 | 388 (15.1%) | 541 (21.5%) |
| $75,000 to $99,999 | 404 (15.8%) | 240 (9.6%) |
| $100,000 to $149,999 | 610 (23.8%) | 324 (12.9%) |
| $150,000 or more | 707 (27.6%) | 45 (1.8%) |
| Total | 2,564 (100.0%) | 2,511 (100.0%) |
Monthly Housing Cost Tiers in Richton Park
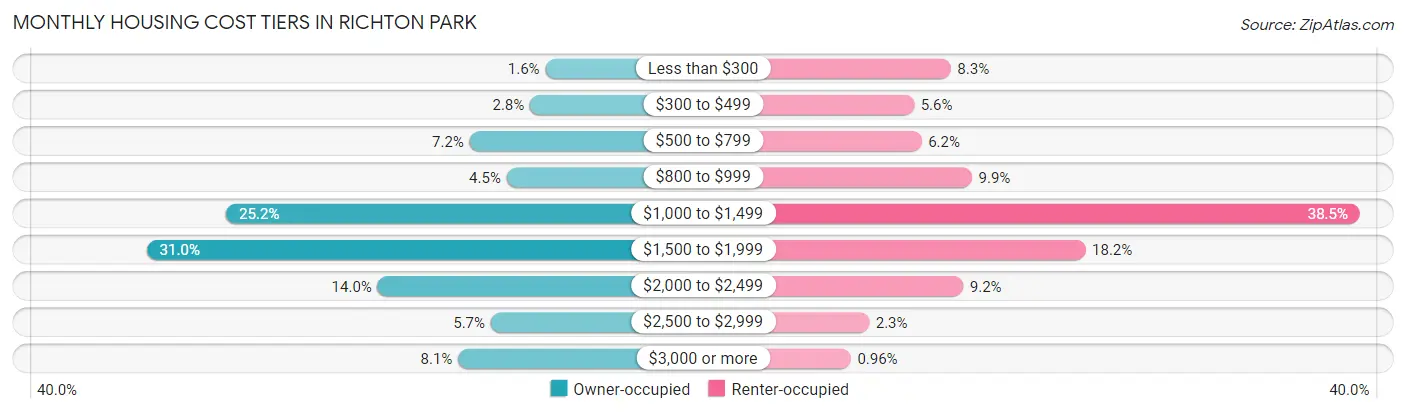
| Monthly Cost | Owner-occupied | Renter-occupied |
| Less than $300 | 42 (1.6%) | 209 (8.3%) |
| $300 to $499 | 71 (2.8%) | 141 (5.6%) |
| $500 to $799 | 185 (7.2%) | 155 (6.2%) |
| $800 to $999 | 115 (4.5%) | 248 (9.9%) |
| $1,000 to $1,499 | 645 (25.2%) | 966 (38.5%) |
| $1,500 to $1,999 | 795 (31.0%) | 458 (18.2%) |
| $2,000 to $2,499 | 359 (14.0%) | 232 (9.2%) |
| $2,500 to $2,999 | 145 (5.7%) | 58 (2.3%) |
| $3,000 or more | 207 (8.1%) | 24 (1.0%) |
| Total | 2,564 (100.0%) | 2,511 (100.0%) |
Physical Housing Characteristics in Richton Park
Housing Structures in Richton Park
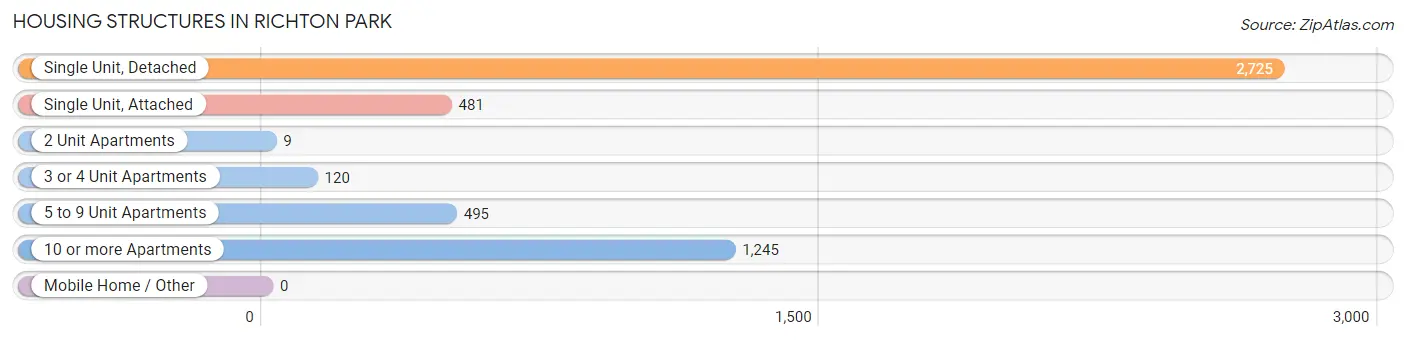
| Structure Type | # Housing Units | % Housing Units |
| Single Unit, Detached | 2,725 | 53.7% |
| Single Unit, Attached | 481 | 9.5% |
| 2 Unit Apartments | 9 | 0.2% |
| 3 or 4 Unit Apartments | 120 | 2.4% |
| 5 to 9 Unit Apartments | 495 | 9.8% |
| 10 or more Apartments | 1,245 | 24.5% |
| Mobile Home / Other | 0 | 0.0% |
| Total | 5,075 | 100.0% |
Housing Structures by Occupancy in Richton Park
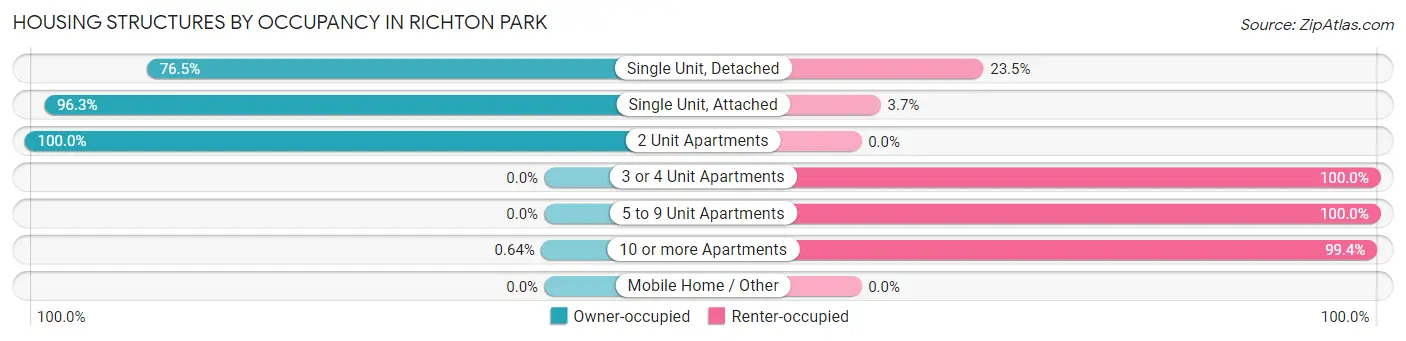
| Structure Type | Owner-occupied | Renter-occupied |
| Single Unit, Detached | 2,084 (76.5%) | 641 (23.5%) |
| Single Unit, Attached | 463 (96.3%) | 18 (3.7%) |
| 2 Unit Apartments | 9 (100.0%) | 0 (0.0%) |
| 3 or 4 Unit Apartments | 0 (0.0%) | 120 (100.0%) |
| 5 to 9 Unit Apartments | 0 (0.0%) | 495 (100.0%) |
| 10 or more Apartments | 8 (0.6%) | 1,237 (99.4%) |
| Mobile Home / Other | 0 (0.0%) | 0 (0.0%) |
| Total | 2,564 (50.5%) | 2,511 (49.5%) |
Housing Structures by Number of Rooms in Richton Park
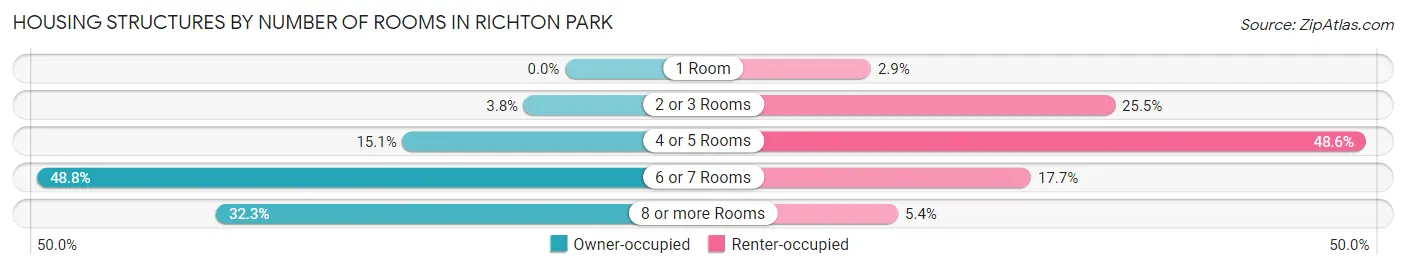
| Number of Rooms | Owner-occupied | Renter-occupied |
| 1 Room | 0 (0.0%) | 72 (2.9%) |
| 2 or 3 Rooms | 98 (3.8%) | 639 (25.5%) |
| 4 or 5 Rooms | 386 (15.0%) | 1,221 (48.6%) |
| 6 or 7 Rooms | 1,252 (48.8%) | 444 (17.7%) |
| 8 or more Rooms | 828 (32.3%) | 135 (5.4%) |
| Total | 2,564 (100.0%) | 2,511 (100.0%) |
Housing Structure by Heating Type in Richton Park
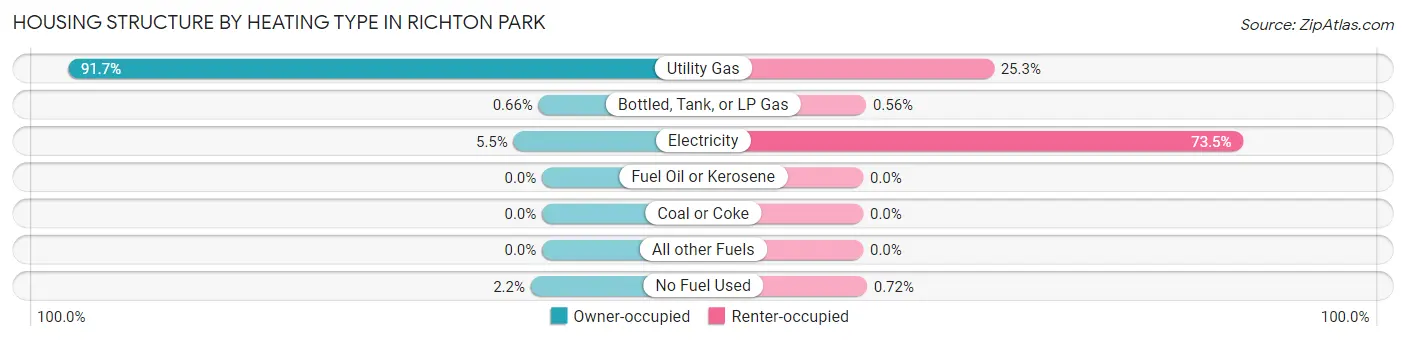
| Heating Type | Owner-occupied | Renter-occupied |
| Utility Gas | 2,350 (91.6%) | 634 (25.3%) |
| Bottled, Tank, or LP Gas | 17 (0.7%) | 14 (0.6%) |
| Electricity | 141 (5.5%) | 1,845 (73.5%) |
| Fuel Oil or Kerosene | 0 (0.0%) | 0 (0.0%) |
| Coal or Coke | 0 (0.0%) | 0 (0.0%) |
| All other Fuels | 0 (0.0%) | 0 (0.0%) |
| No Fuel Used | 56 (2.2%) | 18 (0.7%) |
| Total | 2,564 (100.0%) | 2,511 (100.0%) |
Household Vehicle Usage in Richton Park
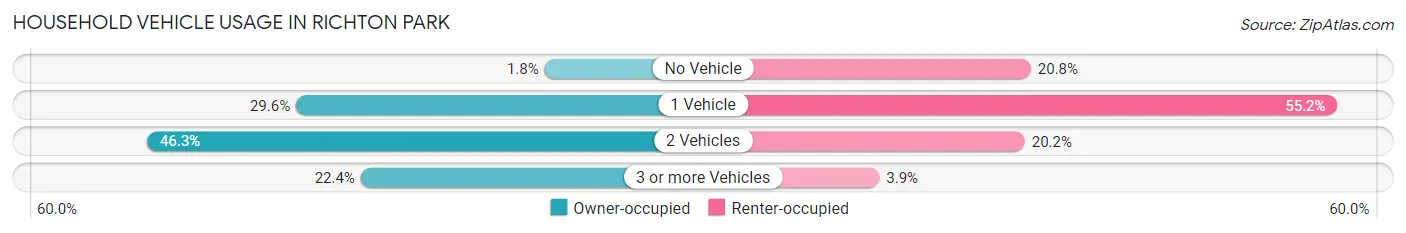
| Vehicles per Household | Owner-occupied | Renter-occupied |
| No Vehicle | 45 (1.8%) | 523 (20.8%) |
| 1 Vehicle | 759 (29.6%) | 1,385 (55.2%) |
| 2 Vehicles | 1,187 (46.3%) | 506 (20.2%) |
| 3 or more Vehicles | 573 (22.4%) | 97 (3.9%) |
| Total | 2,564 (100.0%) | 2,511 (100.0%) |
Real Estate & Mortgages in Richton Park
Real Estate and Mortgage Overview in Richton Park
| Characteristic | Without Mortgage | With Mortgage |
| Housing Units | 442 | 2,122 |
| Median Property Value | $163,600 | $188,900 |
| Median Household Income | $59,954 | $641 |
| Monthly Housing Costs | $815 | $207 |
| Real Estate Taxes | $4,887 | $34 |
Property Value by Mortgage Status in Richton Park
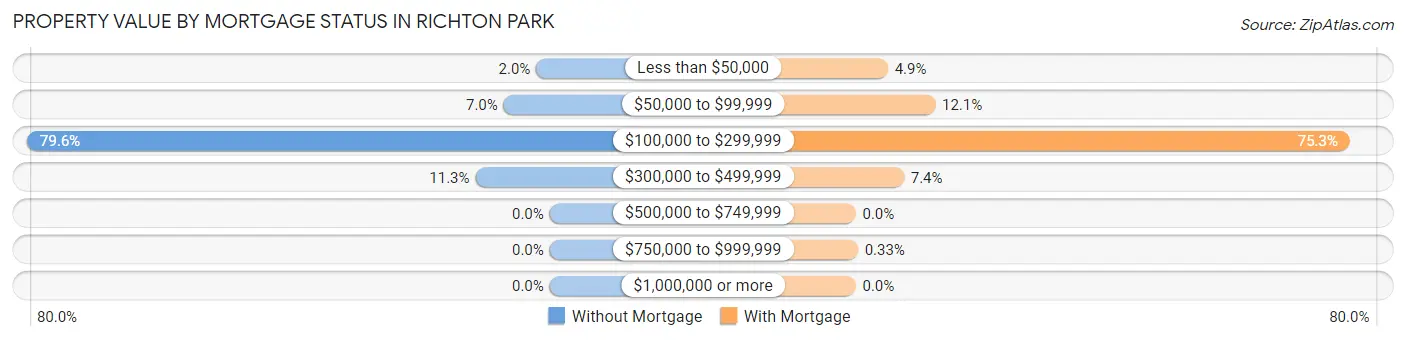
| Property Value | Without Mortgage | With Mortgage |
| Less than $50,000 | 9 (2.0%) | 104 (4.9%) |
| $50,000 to $99,999 | 31 (7.0%) | 257 (12.1%) |
| $100,000 to $299,999 | 352 (79.6%) | 1,598 (75.3%) |
| $300,000 to $499,999 | 50 (11.3%) | 156 (7.3%) |
| $500,000 to $749,999 | 0 (0.0%) | 0 (0.0%) |
| $750,000 to $999,999 | 0 (0.0%) | 7 (0.3%) |
| $1,000,000 or more | 0 (0.0%) | 0 (0.0%) |
| Total | 442 (100.0%) | 2,122 (100.0%) |
Household Income by Mortgage Status in Richton Park
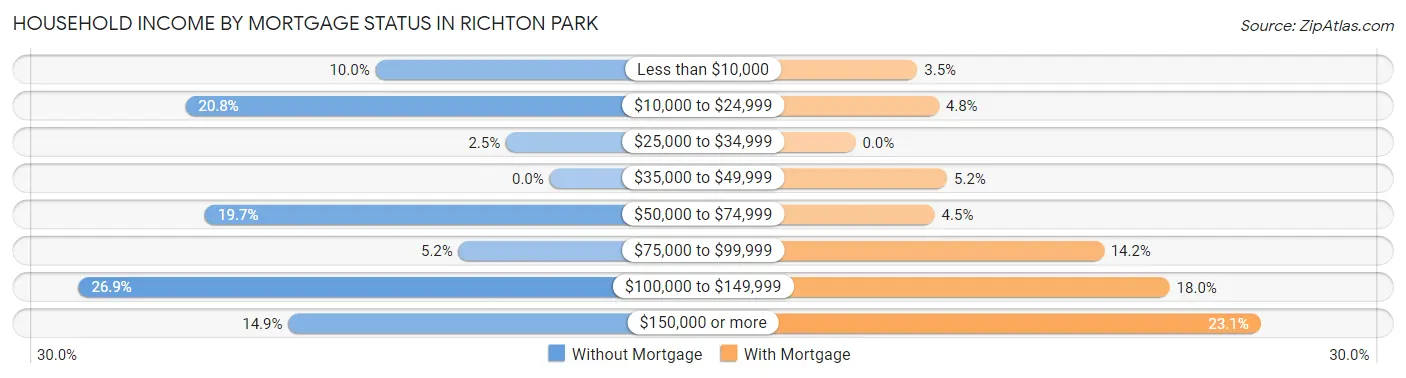
| Household Income | Without Mortgage | With Mortgage |
| Less than $10,000 | 44 (10.0%) | 75 (3.5%) |
| $10,000 to $24,999 | 92 (20.8%) | 101 (4.8%) |
| $25,000 to $34,999 | 11 (2.5%) | 0 (0.0%) |
| $35,000 to $49,999 | 0 (0.0%) | 111 (5.2%) |
| $50,000 to $74,999 | 87 (19.7%) | 96 (4.5%) |
| $75,000 to $99,999 | 23 (5.2%) | 301 (14.2%) |
| $100,000 to $149,999 | 119 (26.9%) | 381 (17.9%) |
| $150,000 or more | 66 (14.9%) | 491 (23.1%) |
| Total | 442 (100.0%) | 2,122 (100.0%) |
Property Value to Household Income Ratio in Richton Park
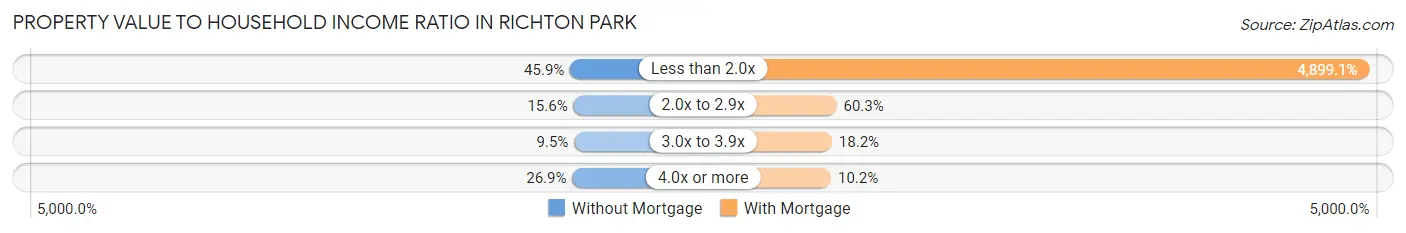
| Value-to-Income Ratio | Without Mortgage | With Mortgage |
| Less than 2.0x | 203 (45.9%) | 103,958 (4,899.1%) |
| 2.0x to 2.9x | 69 (15.6%) | 1,280 (60.3%) |
| 3.0x to 3.9x | 42 (9.5%) | 387 (18.2%) |
| 4.0x or more | 119 (26.9%) | 216 (10.2%) |
| Total | 442 (100.0%) | 2,122 (100.0%) |
Real Estate Taxes by Mortgage Status in Richton Park
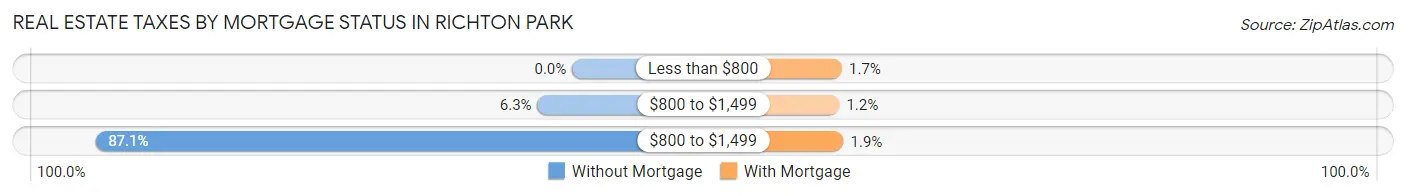
| Property Taxes | Without Mortgage | With Mortgage |
| Less than $800 | 0 (0.0%) | 35 (1.7%) |
| $800 to $1,499 | 28 (6.3%) | 25 (1.2%) |
| $800 to $1,499 | 385 (87.1%) | 41 (1.9%) |
| Total | 442 (100.0%) | 2,122 (100.0%) |
Health & Disability in Richton Park
Health Insurance Coverage by Age in Richton Park
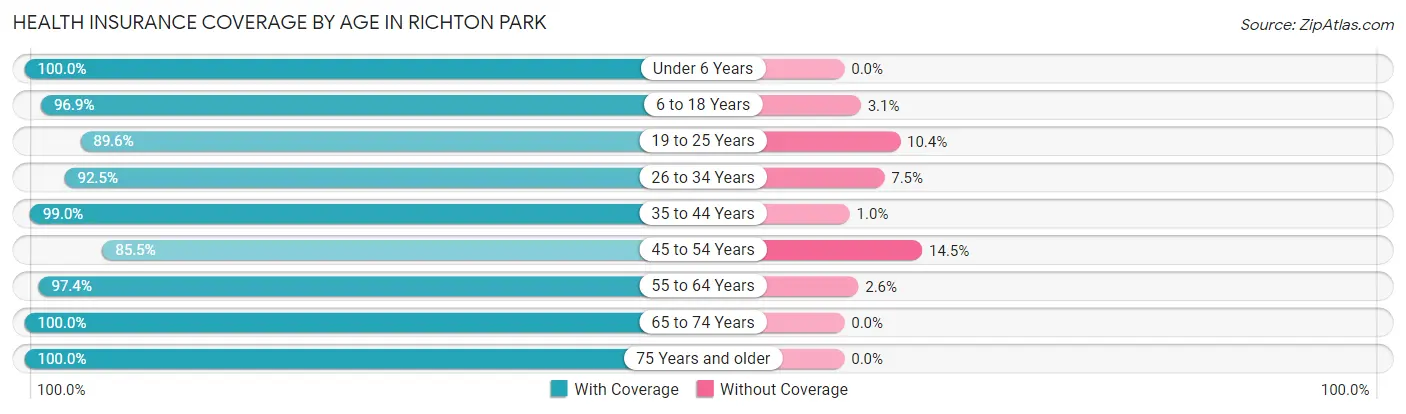
| Age Bracket | With Coverage | Without Coverage |
| Under 6 Years | 660 (100.0%) | 0 (0.0%) |
| 6 to 18 Years | 2,284 (96.9%) | 72 (3.1%) |
| 19 to 25 Years | 1,268 (89.6%) | 147 (10.4%) |
| 26 to 34 Years | 1,067 (92.5%) | 86 (7.5%) |
| 35 to 44 Years | 1,289 (99.0%) | 13 (1.0%) |
| 45 to 54 Years | 1,597 (85.5%) | 271 (14.5%) |
| 55 to 64 Years | 1,570 (97.4%) | 42 (2.6%) |
| 65 to 74 Years | 1,124 (100.0%) | 0 (0.0%) |
| 75 Years and older | 937 (100.0%) | 0 (0.0%) |
| Total | 11,796 (94.9%) | 631 (5.1%) |
Health Insurance Coverage by Citizenship Status in Richton Park
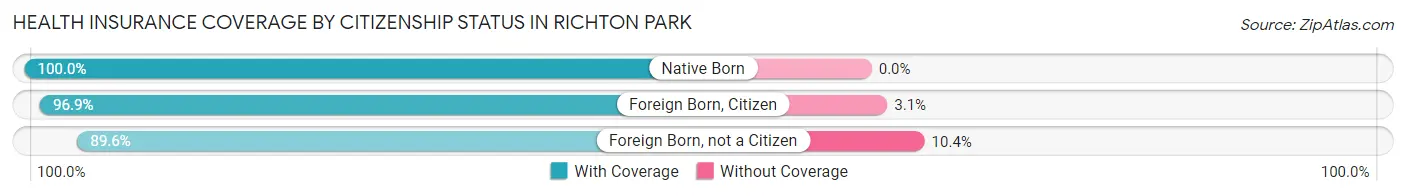
| Citizenship Status | With Coverage | Without Coverage |
| Native Born | 660 (100.0%) | 0 (0.0%) |
| Foreign Born, Citizen | 2,284 (96.9%) | 72 (3.1%) |
| Foreign Born, not a Citizen | 1,268 (89.6%) | 147 (10.4%) |
Health Insurance Coverage by Household Income in Richton Park
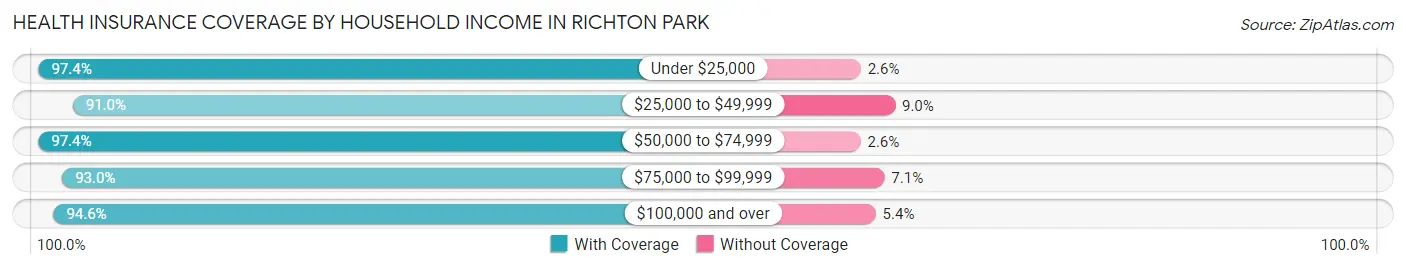
| Household Income | With Coverage | Without Coverage |
| Under $25,000 | 1,305 (97.4%) | 35 (2.6%) |
| $25,000 to $49,999 | 1,217 (91.0%) | 121 (9.0%) |
| $50,000 to $74,999 | 2,616 (97.4%) | 69 (2.6%) |
| $75,000 to $99,999 | 1,344 (92.9%) | 102 (7.0%) |
| $100,000 and over | 5,314 (94.6%) | 304 (5.4%) |
Public vs Private Health Insurance Coverage by Age in Richton Park
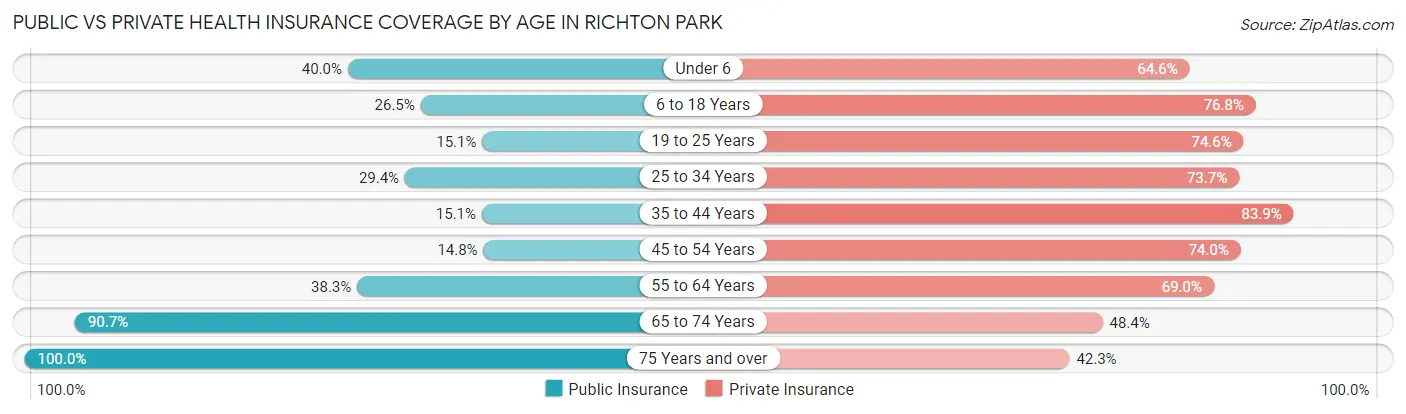
| Age Bracket | Public Insurance | Private Insurance |
| Under 6 | 264 (40.0%) | 426 (64.5%) |
| 6 to 18 Years | 624 (26.5%) | 1,810 (76.8%) |
| 19 to 25 Years | 213 (15.0%) | 1,055 (74.6%) |
| 25 to 34 Years | 339 (29.4%) | 850 (73.7%) |
| 35 to 44 Years | 197 (15.1%) | 1,092 (83.9%) |
| 45 to 54 Years | 277 (14.8%) | 1,383 (74.0%) |
| 55 to 64 Years | 617 (38.3%) | 1,113 (69.0%) |
| 65 to 74 Years | 1,019 (90.7%) | 544 (48.4%) |
| 75 Years and over | 937 (100.0%) | 396 (42.3%) |
| Total | 4,487 (36.1%) | 8,669 (69.8%) |
Disability Status by Sex by Age in Richton Park
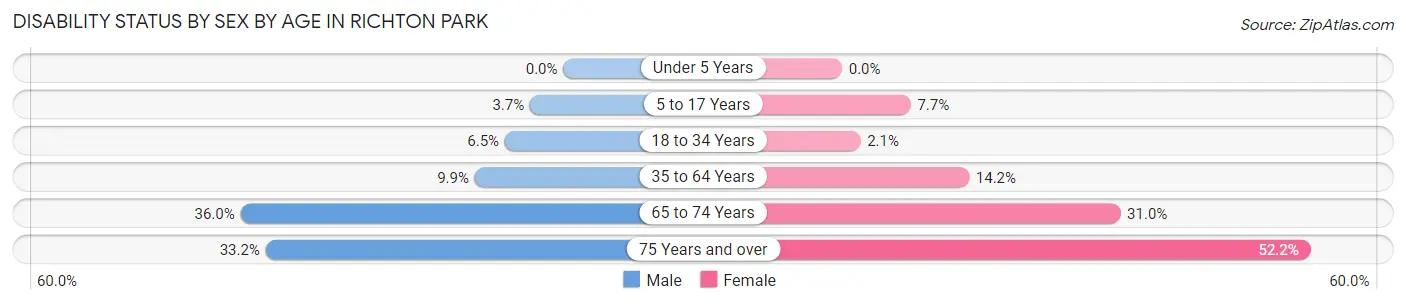
| Age Bracket | Male | Female |
| Under 5 Years | 0 (0.0%) | 0 (0.0%) |
| 5 to 17 Years | 40 (3.7%) | 88 (7.6%) |
| 18 to 34 Years | 107 (6.5%) | 24 (2.1%) |
| 35 to 64 Years | 178 (9.9%) | 421 (14.1%) |
| 65 to 74 Years | 142 (35.9%) | 226 (31.0%) |
| 75 Years and over | 122 (33.2%) | 297 (52.2%) |
Disability Class by Sex by Age in Richton Park
Disability Class: Hearing Difficulty
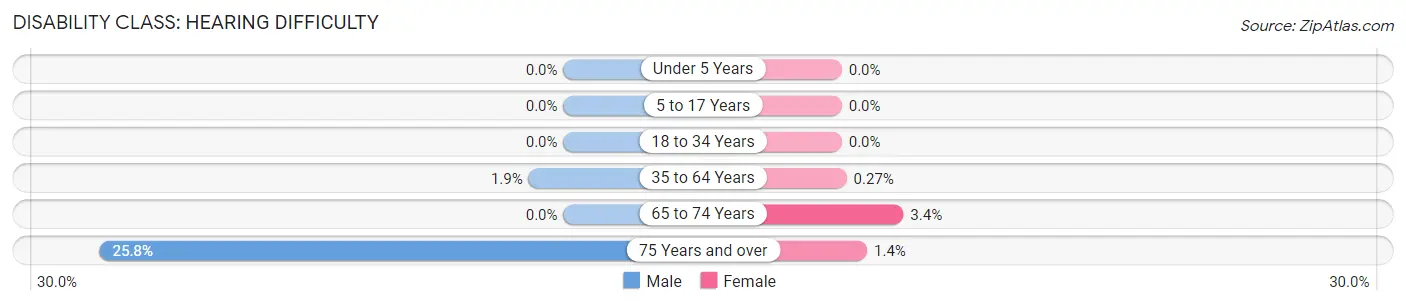
| Age Bracket | Male | Female |
| Under 5 Years | 0 (0.0%) | 0 (0.0%) |
| 5 to 17 Years | 0 (0.0%) | 0 (0.0%) |
| 18 to 34 Years | 0 (0.0%) | 0 (0.0%) |
| 35 to 64 Years | 35 (1.9%) | 8 (0.3%) |
| 65 to 74 Years | 0 (0.0%) | 25 (3.4%) |
| 75 Years and over | 95 (25.8%) | 8 (1.4%) |
Disability Class: Vision Difficulty
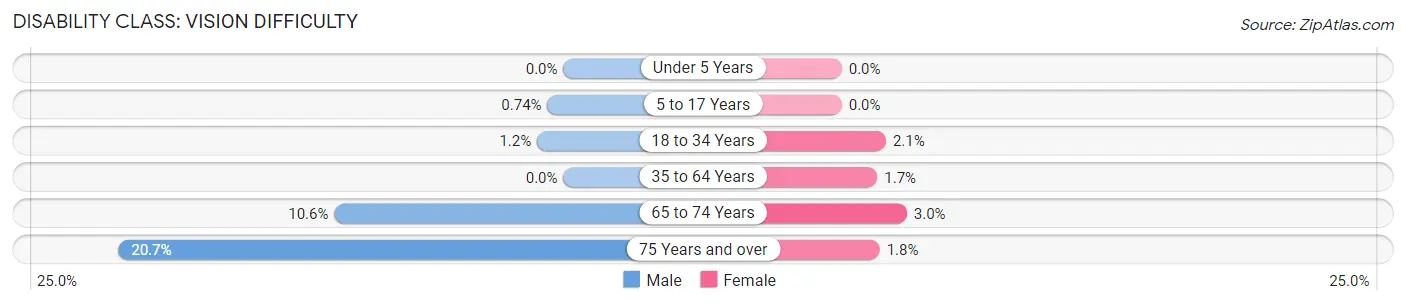
| Age Bracket | Male | Female |
| Under 5 Years | 0 (0.0%) | 0 (0.0%) |
| 5 to 17 Years | 8 (0.7%) | 0 (0.0%) |
| 18 to 34 Years | 20 (1.2%) | 24 (2.1%) |
| 35 to 64 Years | 0 (0.0%) | 49 (1.7%) |
| 65 to 74 Years | 42 (10.6%) | 22 (3.0%) |
| 75 Years and over | 76 (20.6%) | 10 (1.8%) |
Disability Class: Cognitive Difficulty
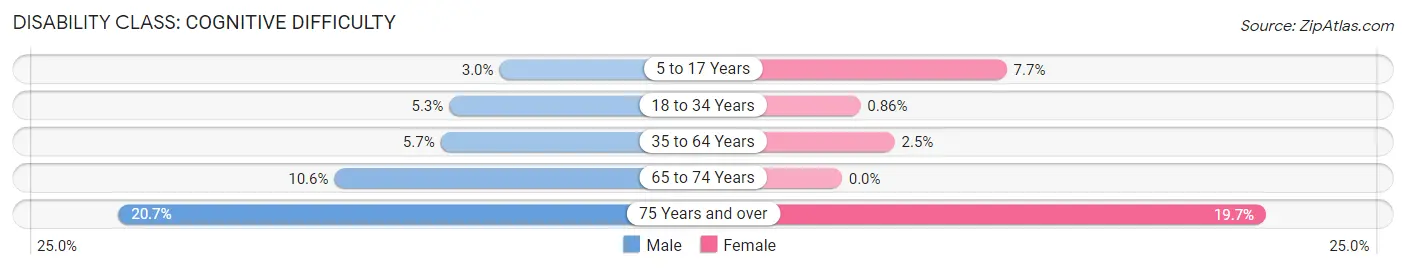
| Age Bracket | Male | Female |
| 5 to 17 Years | 32 (3.0%) | 88 (7.6%) |
| 18 to 34 Years | 87 (5.3%) | 10 (0.9%) |
| 35 to 64 Years | 103 (5.7%) | 73 (2.5%) |
| 65 to 74 Years | 42 (10.6%) | 0 (0.0%) |
| 75 Years and over | 76 (20.6%) | 112 (19.7%) |
Disability Class: Ambulatory Difficulty
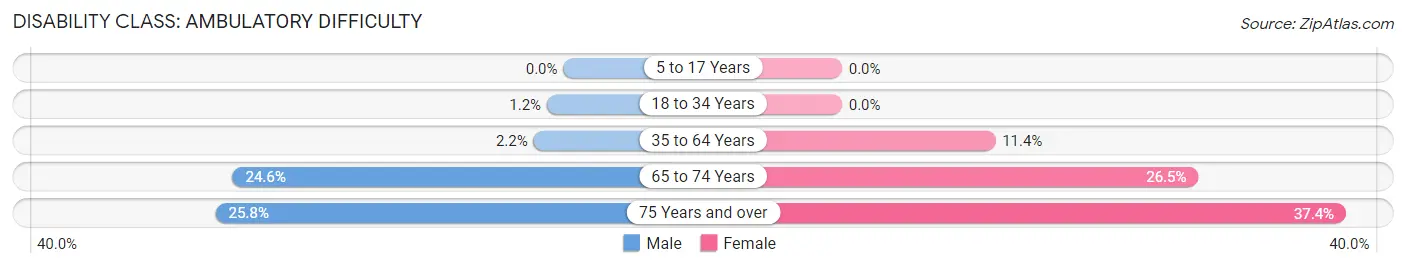
| Age Bracket | Male | Female |
| 5 to 17 Years | 0 (0.0%) | 0 (0.0%) |
| 18 to 34 Years | 20 (1.2%) | 0 (0.0%) |
| 35 to 64 Years | 40 (2.2%) | 339 (11.4%) |
| 65 to 74 Years | 97 (24.6%) | 193 (26.5%) |
| 75 Years and over | 95 (25.8%) | 213 (37.4%) |
Disability Class: Self-Care Difficulty
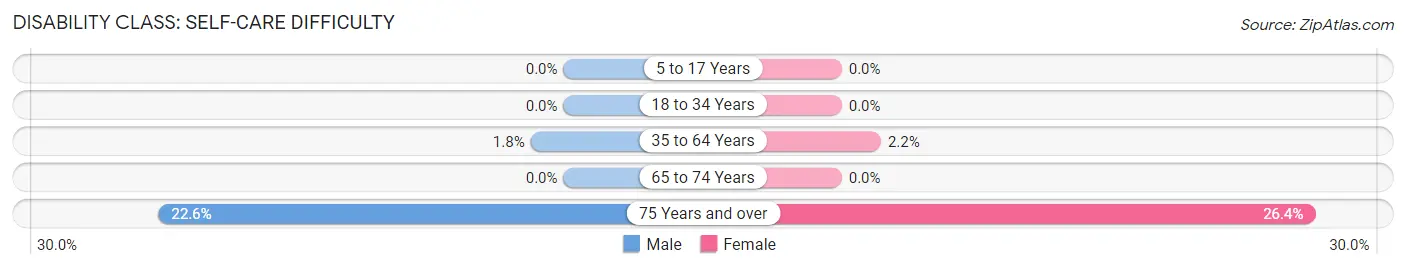
| Age Bracket | Male | Female |
| 5 to 17 Years | 0 (0.0%) | 0 (0.0%) |
| 18 to 34 Years | 0 (0.0%) | 0 (0.0%) |
| 35 to 64 Years | 33 (1.8%) | 65 (2.2%) |
| 65 to 74 Years | 0 (0.0%) | 0 (0.0%) |
| 75 Years and over | 83 (22.6%) | 150 (26.4%) |
Technology Access in Richton Park
Computing Device Access in Richton Park
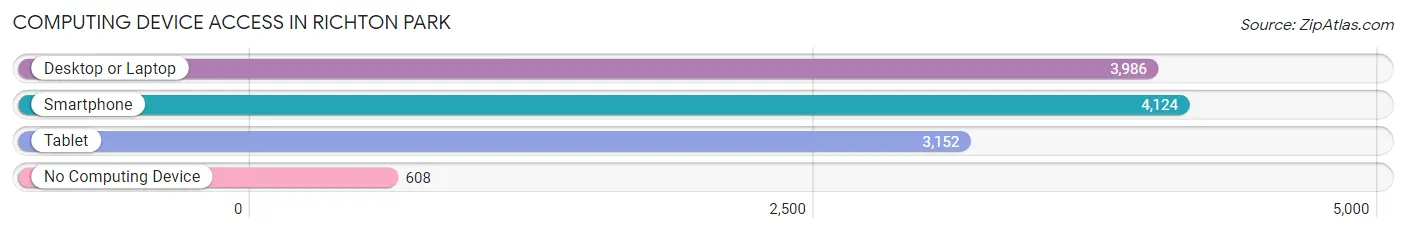
| Device Type | # Households | % Households |
| Desktop or Laptop | 3,986 | 78.5% |
| Smartphone | 4,124 | 81.3% |
| Tablet | 3,152 | 62.1% |
| No Computing Device | 608 | 12.0% |
| Total | 5,075 | 100.0% |
Internet Access in Richton Park
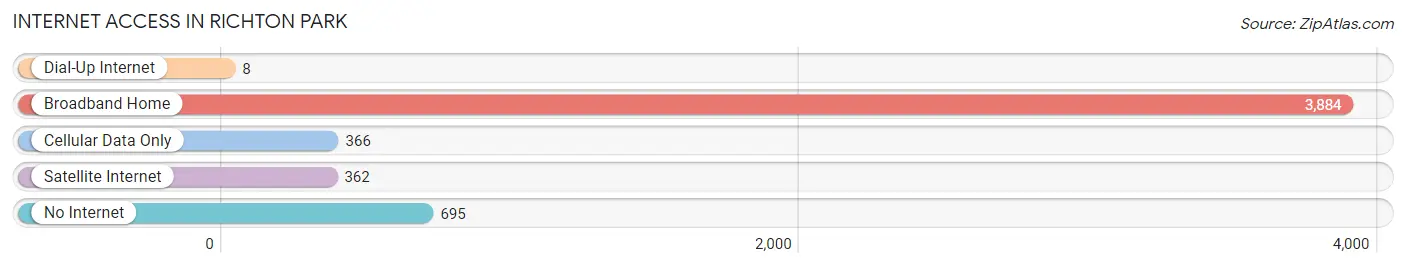
| Internet Type | # Households | % Households |
| Dial-Up Internet | 8 | 0.2% |
| Broadband Home | 3,884 | 76.5% |
| Cellular Data Only | 366 | 7.2% |
| Satellite Internet | 362 | 7.1% |
| No Internet | 695 | 13.7% |
| Total | 5,075 | 100.0% |
Richton Park Summary
Richton Park is a village located in Cook County, Illinois, United States. It is a suburb of Chicago, located approximately 25 miles south of the city. The population was 12,479 at the 2010 census.
History
Richton Park was first settled in the early 1800s by German immigrants. The village was originally known as Rich Township, and was incorporated in 1926. The name was changed to Richton Park in 1950.
The village was originally a farming community, but in the 1950s, the area began to experience rapid growth due to the construction of the nearby expressways. This growth continued into the 1960s and 1970s, and the village experienced a population boom.
Geography
Richton Park is located at 41°32'17" North, 87°44'45" West (41.538056, -87.745833). According to the 2010 census, the village has a total area of 4.9 square miles, all of it land.
Economy
Richton Park is home to a variety of businesses, including retail stores, restaurants, and professional services. The village is also home to several industrial parks, which provide employment opportunities for local residents.
Demographics
As of the 2010 census, the population of Richton Park was 12,479. The racial makeup of the village was 57.2% African American, 33.3% White, 4.2% Asian, 0.3% Native American, 0.1% Pacific Islander, and 4.9% from other races. Hispanic or Latino of any race were 8.3% of the population.
The median income for a household in the village was $50,945, and the median income for a family was $60,945. The per capita income for the village was $22,945. About 8.3% of families and 10.2% of the population were below the poverty line, including 14.2% of those under age 18 and 6.2% of those age 65 or over.
Richton Park is served by several school districts, including Rich Township High School District 227, Rich Township Elementary School District 142, and Rich South High School District 227. The village is also home to several private schools, including Richton Park Christian Academy and Richton Park Montessori School.
Common Questions
What is Per Capita Income in Richton Park?
Per Capita income in Richton Park is $32,604.
What is the Median Family Income in Richton Park?
Median Family Income in Richton Park is $97,852.
What is the Median Household income in Richton Park?
Median Household Income in Richton Park is $69,691.
What is Income or Wage Gap in Richton Park?
Income or Wage Gap in Richton Park is 12.2%.
Women in Richton Park earn 87.8 cents for every dollar earned by a man.
What is Inequality or Gini Index in Richton Park?
Inequality or Gini Index in Richton Park is 0.43.
What is the Total Population of Richton Park?
Total Population of Richton Park is 12,721.
What is the Total Male Population of Richton Park?
Total Male Population of Richton Park is 5,716.
What is the Total Female Population of Richton Park?
Total Female Population of Richton Park is 7,005.
What is the Ratio of Males per 100 Females in Richton Park?
There are 81.60 Males per 100 Females in Richton Park.
What is the Ratio of Females per 100 Males in Richton Park?
There are 122.55 Females per 100 Males in Richton Park.
What is the Median Population Age in Richton Park?
Median Population Age in Richton Park is 39.7 Years.
What is the Average Family Size in Richton Park
Average Family Size in Richton Park is 3.4 People.
What is the Average Household Size in Richton Park
Average Household Size in Richton Park is 2.5 People.
How Large is the Labor Force in Richton Park?
There are 6,786 People in the Labor Forcein in Richton Park.
What is the Percentage of People in the Labor Force in Richton Park?
65.9% of People are in the Labor Force in Richton Park.
What is the Unemployment Rate in Richton Park?
Unemployment Rate in Richton Park is 12.3%.