Cambria, IL Map & Demographics
Cambria Map
Cambria Overview
$33,665
PER CAPITA INCOME
$47,104
AVG FAMILY INCOME
$46,894
AVG HOUSEHOLD INCOME
31.5%
WAGE / INCOME GAP [ % ]
68.5¢/ $1
WAGE / INCOME GAP [ $ ]
0.51
INEQUALITY / GINI INDEX
1,231
TOTAL POPULATION
520
MALE POPULATION
711
FEMALE POPULATION
73.14
MALES / 100 FEMALES
136.73
FEMALES / 100 MALES
35.4
MEDIAN AGE
2.4
AVG FAMILY SIZE
1.9
AVG HOUSEHOLD SIZE
628
LABOR FORCE [ PEOPLE ]
62.2%
PERCENT IN LABOR FORCE
5.5%
UNEMPLOYMENT RATE
Cambria Zip Codes
Cambria Area Codes
Income in Cambria
Income Overview in Cambria
Per Capita Income in Cambria is $33,665, while median incomes of families and households are $47,104 and $46,894 respectively.
| Characteristic | Number | Measure |
| Per Capita Income | 1,231 | $33,665 |
| Median Family Income | 395 | $47,104 |
| Mean Family Income | 395 | $56,292 |
| Median Household Income | 634 | $46,894 |
| Mean Household Income | 634 | $64,758 |
| Income Deficit | 395 | $0 |
| Wage / Income Gap (%) | 1,231 | 31.48% |
| Wage / Income Gap ($) | 1,231 | 68.52¢ per $1 |
| Gini / Inequality Index | 1,231 | 0.51 |
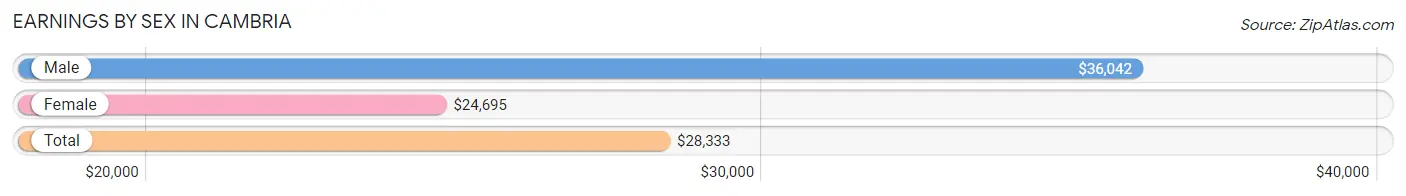
Earnings by Sex in Cambria
Average Earnings in Cambria are $28,333, $36,042 for men and $24,695 for women, a difference of 31.5%.
| Sex | Number | Average Earnings |
| Male | 290 (41.8%) | $36,042 |
| Female | 404 (58.2%) | $24,695 |
| Total | 694 (100.0%) | $28,333 |
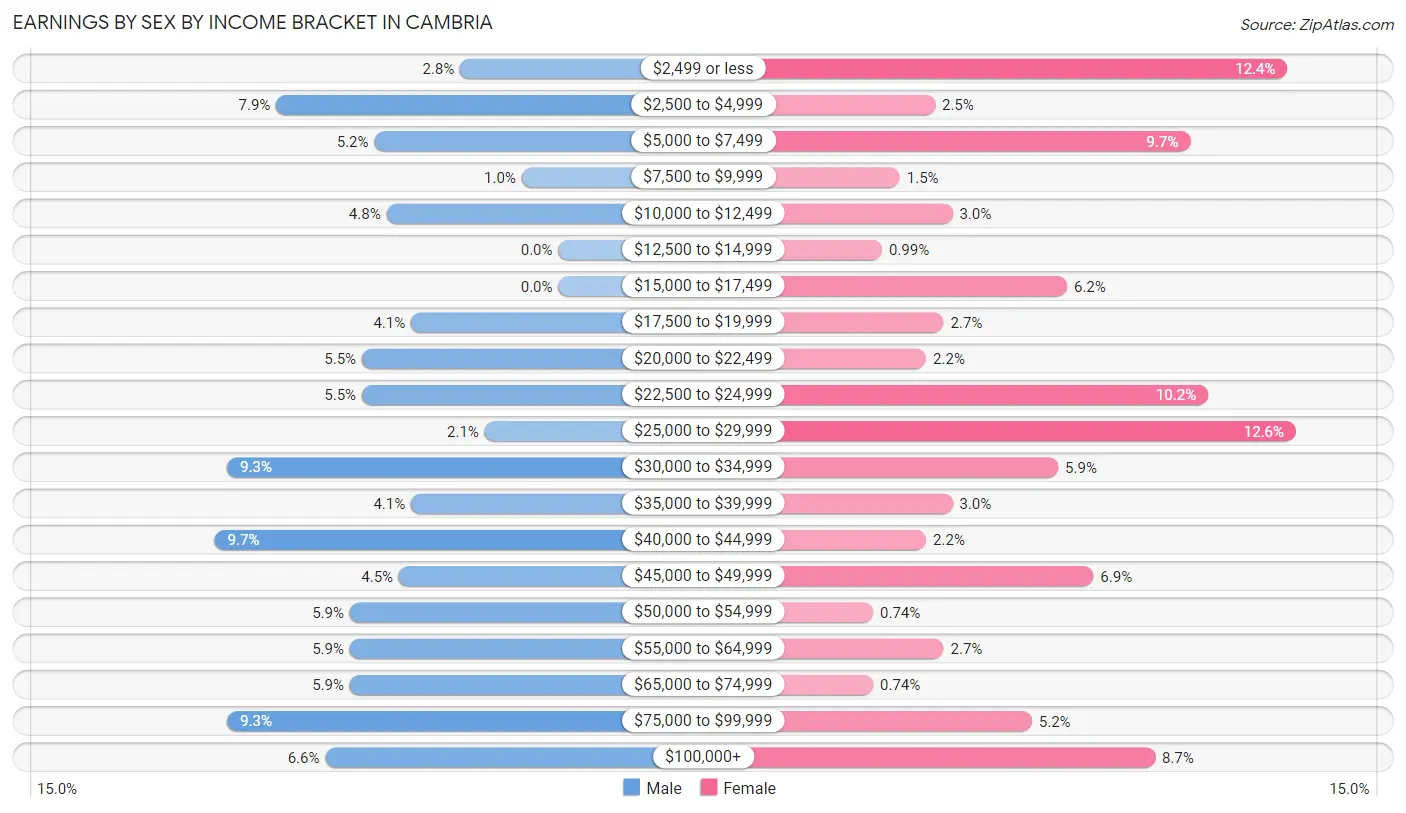
Earnings by Sex by Income Bracket in Cambria
The most common earnings brackets in Cambria are $40,000 to $44,999 for men (28 | 9.7%) and $25,000 to $29,999 for women (51 | 12.6%).
| Income | Male | Female |
| $2,499 or less | 8 (2.8%) | 50 (12.4%) |
| $2,500 to $4,999 | 23 (7.9%) | 10 (2.5%) |
| $5,000 to $7,499 | 15 (5.2%) | 39 (9.7%) |
| $7,500 to $9,999 | 3 (1.0%) | 6 (1.5%) |
| $10,000 to $12,499 | 14 (4.8%) | 12 (3.0%) |
| $12,500 to $14,999 | 0 (0.0%) | 4 (1.0%) |
| $15,000 to $17,499 | 0 (0.0%) | 25 (6.2%) |
| $17,500 to $19,999 | 12 (4.1%) | 11 (2.7%) |
| $20,000 to $22,499 | 16 (5.5%) | 9 (2.2%) |
| $22,500 to $24,999 | 16 (5.5%) | 41 (10.2%) |
| $25,000 to $29,999 | 6 (2.1%) | 51 (12.6%) |
| $30,000 to $34,999 | 27 (9.3%) | 24 (5.9%) |
| $35,000 to $39,999 | 12 (4.1%) | 12 (3.0%) |
| $40,000 to $44,999 | 28 (9.7%) | 9 (2.2%) |
| $45,000 to $49,999 | 13 (4.5%) | 28 (6.9%) |
| $50,000 to $54,999 | 17 (5.9%) | 3 (0.7%) |
| $55,000 to $64,999 | 17 (5.9%) | 11 (2.7%) |
| $65,000 to $74,999 | 17 (5.9%) | 3 (0.7%) |
| $75,000 to $99,999 | 27 (9.3%) | 21 (5.2%) |
| $100,000+ | 19 (6.6%) | 35 (8.7%) |
| Total | 290 (100.0%) | 404 (100.0%) |
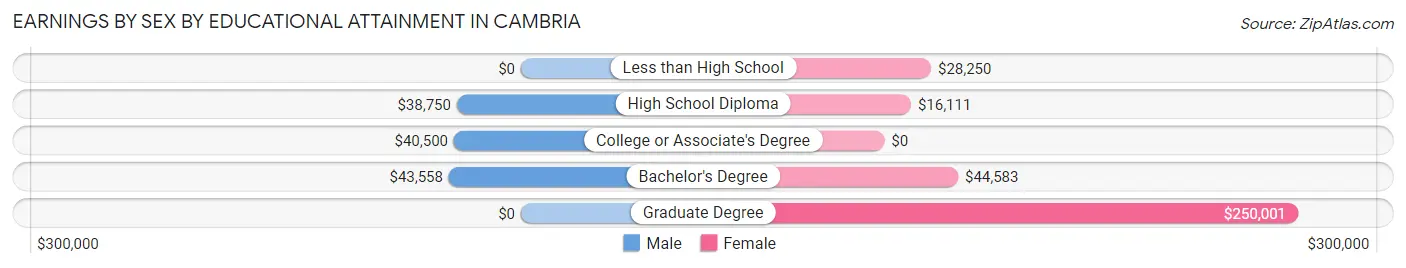
Earnings by Sex by Educational Attainment in Cambria
Average earnings in Cambria are $40,250 for men and $25,595 for women, a difference of 36.4%. Men with an educational attainment of bachelor's degree enjoy the highest average annual earnings of $43,558, while those with high school diploma education earn the least with $38,750. Women with an educational attainment of graduate degree earn the most with the average annual earnings of $250,001, while those with high school diploma education have the smallest earnings of $16,111.
| Educational Attainment | Male Income | Female Income |
| Less than High School | - | - |
| High School Diploma | $38,750 | $16,111 |
| College or Associate's Degree | $40,500 | $0 |
| Bachelor's Degree | $43,558 | $44,583 |
| Graduate Degree | - | - |
| Total | $40,250 | $25,595 |
Family Income in Cambria
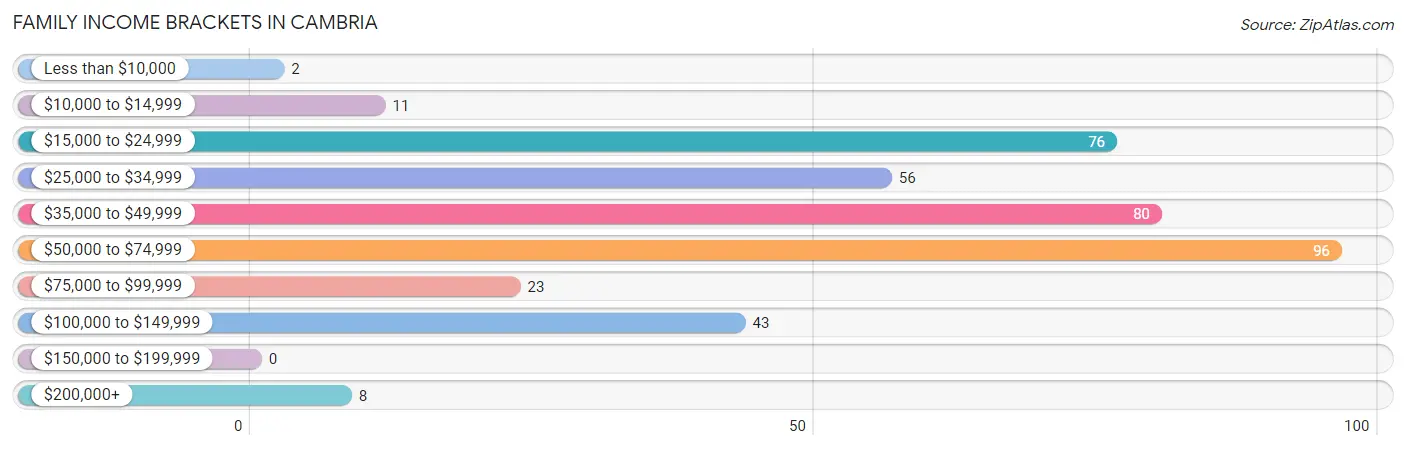
Family Income Brackets in Cambria
According to the Cambria family income data, there are 96 families falling into the $50,000 to $74,999 income range, which is the most common income bracket and makes up 24.3% of all families.
| Income Bracket | # Families | % Families |
| Less than $10,000 | 2 | 0.5% |
| $10,000 to $14,999 | 11 | 2.8% |
| $15,000 to $24,999 | 76 | 19.2% |
| $25,000 to $34,999 | 56 | 14.2% |
| $35,000 to $49,999 | 80 | 20.3% |
| $50,000 to $74,999 | 96 | 24.3% |
| $75,000 to $99,999 | 23 | 5.8% |
| $100,000 to $149,999 | 43 | 10.9% |
| $150,000 to $199,999 | 0 | 0.0% |
| $200,000+ | 8 | 2.0% |
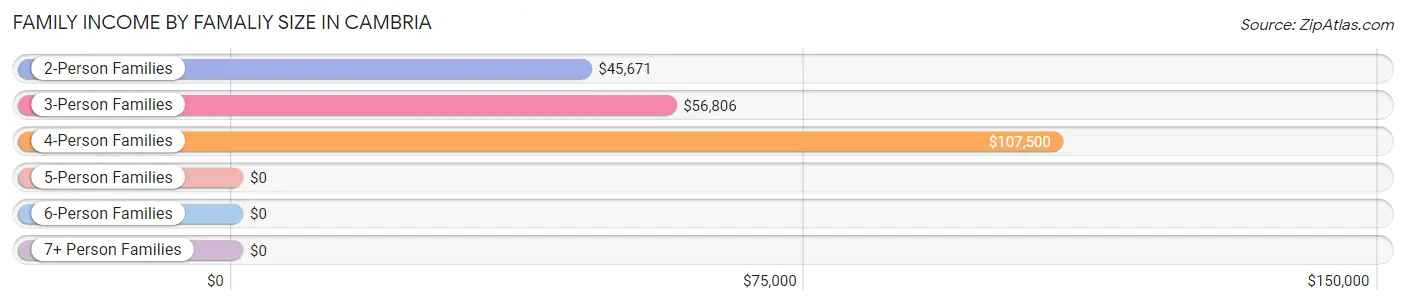
Family Income by Famaliy Size in Cambria
4-person families (22 | 5.6%) account for the highest median family income in Cambria with $107,500 per family, while 4-person families (22 | 5.6%) have the highest median income of $26,875 per family member.
| Income Bracket | # Families | Median Income |
| 2-Person Families | 324 (82.0%) | $45,671 |
| 3-Person Families | 31 (7.9%) | $56,806 |
| 4-Person Families | 22 (5.6%) | $107,500 |
| 5-Person Families | 16 (4.1%) | $0 |
| 6-Person Families | 2 (0.5%) | $0 |
| 7+ Person Families | 0 (0.0%) | $0 |
| Total | 395 (100.0%) | $47,104 |
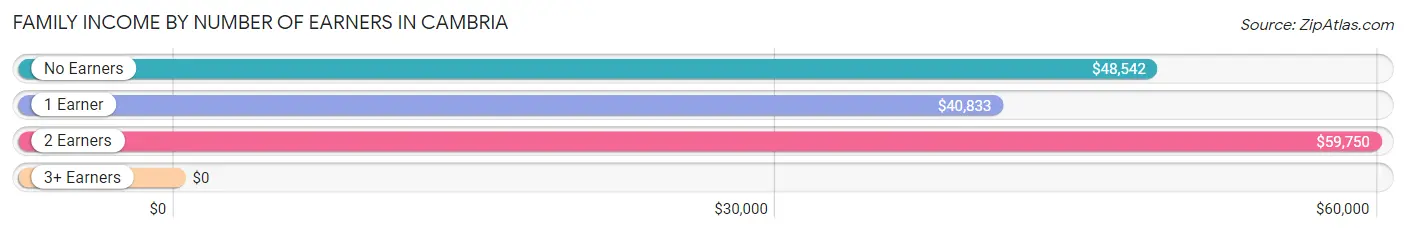
Family Income by Number of Earners in Cambria
| Number of Earners | # Families | Median Income |
| No Earners | 36 (9.1%) | $48,542 |
| 1 Earner | 210 (53.2%) | $40,833 |
| 2 Earners | 137 (34.7%) | $59,750 |
| 3+ Earners | 12 (3.0%) | $0 |
| Total | 395 (100.0%) | $47,104 |
Household Income in Cambria
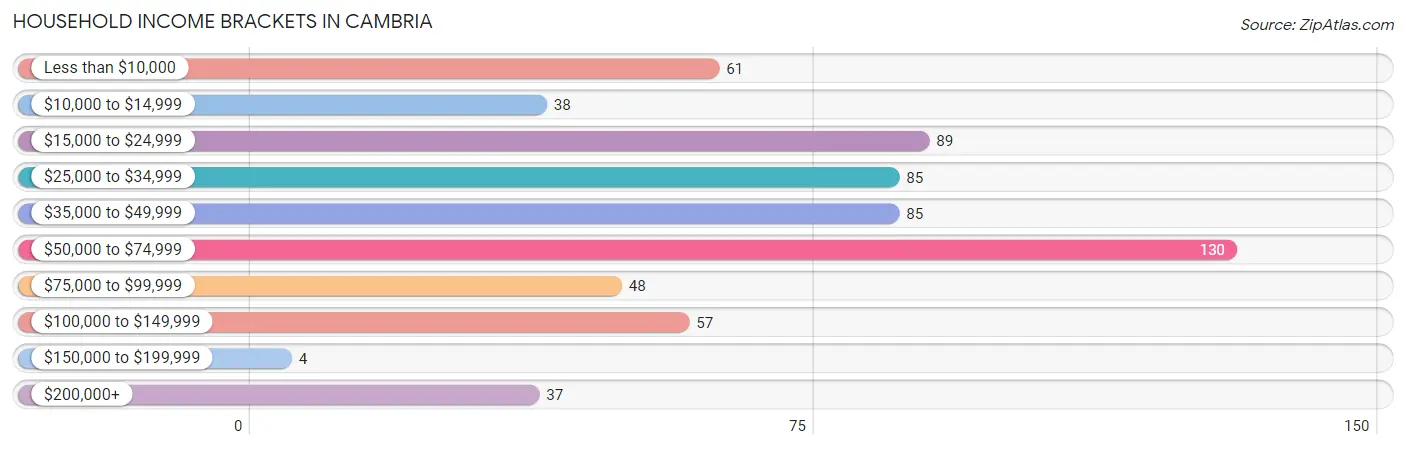
Household Income Brackets in Cambria
With 130 households falling in the category, the $50,000 to $74,999 income range is the most frequent in Cambria, accounting for 20.5% of all households. In contrast, only 4 households (0.6%) fall into the $150,000 to $199,999 income bracket, making it the least populous group.
| Income Bracket | # Households | % Households |
| Less than $10,000 | 61 | 9.6% |
| $10,000 to $14,999 | 38 | 6.0% |
| $15,000 to $24,999 | 89 | 14.0% |
| $25,000 to $34,999 | 85 | 13.4% |
| $35,000 to $49,999 | 85 | 13.4% |
| $50,000 to $74,999 | 130 | 20.5% |
| $75,000 to $99,999 | 48 | 7.6% |
| $100,000 to $149,999 | 57 | 9.0% |
| $150,000 to $199,999 | 4 | 0.6% |
| $200,000+ | 37 | 5.8% |
Household Income by Householder Age in Cambria
The median household income in Cambria is $46,894, with the highest median household income of $66,250 found in the 25 to 44 years age bracket for the primary householder. A total of 207 households (32.7%) fall into this category. Meanwhile, the 45 to 64 years age bracket for the primary householder has the lowest median household income of $0, with 258 households (40.7%) in this group.
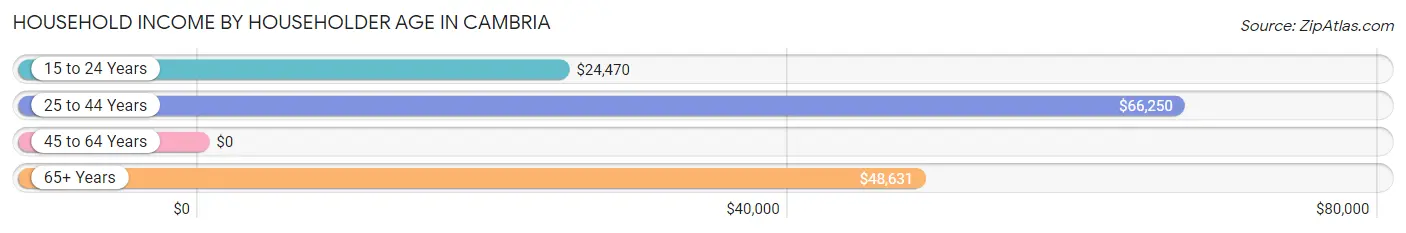
| Income Bracket | # Households | Median Income |
| 15 to 24 Years | 52 (8.2%) | $24,470 |
| 25 to 44 Years | 207 (32.7%) | $66,250 |
| 45 to 64 Years | 258 (40.7%) | $0 |
| 65+ Years | 117 (18.4%) | $48,631 |
| Total | 634 (100.0%) | $46,894 |
Poverty in Cambria
Income Below Poverty by Sex and Age in Cambria
With 10.4% poverty level for males and 21.2% for females among the residents of Cambria, 5 year old males and 12 to 14 year old females are the most vulnerable to poverty, with 13 males (86.7%) and 13 females (65.0%) in their respective age groups living below the poverty level.
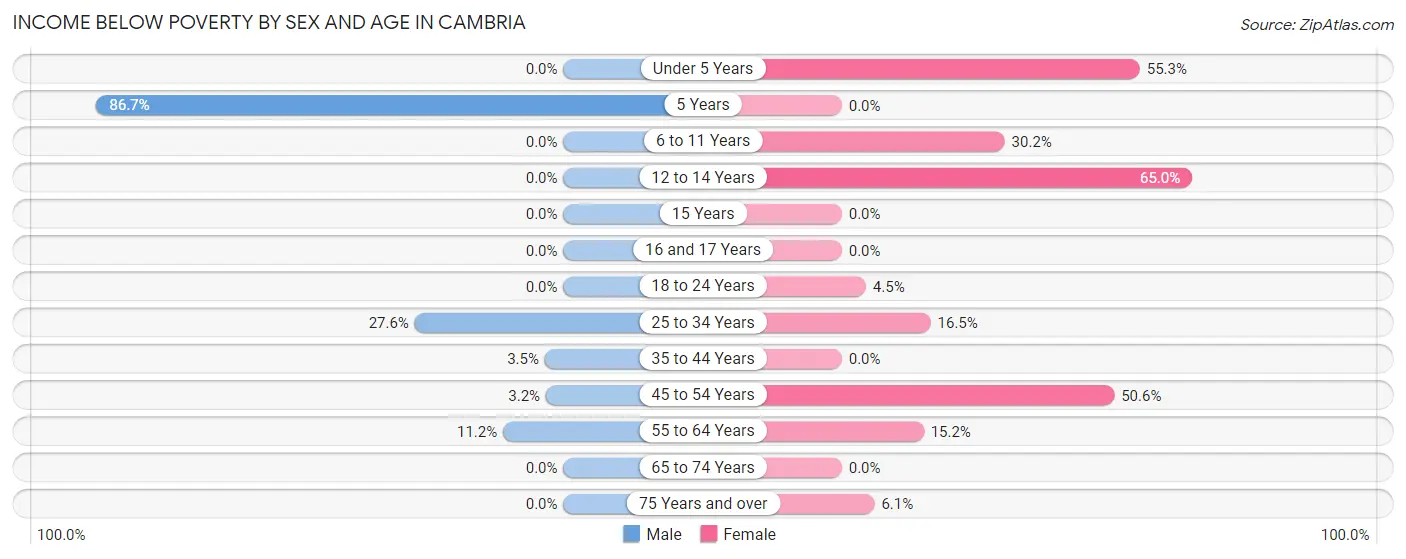
| Age Bracket | Male | Female |
| Under 5 Years | 0 (0.0%) | 26 (55.3%) |
| 5 Years | 13 (86.7%) | 0 (0.0%) |
| 6 to 11 Years | 0 (0.0%) | 13 (30.2%) |
| 12 to 14 Years | 0 (0.0%) | 13 (65.0%) |
| 15 Years | 0 (0.0%) | 0 (0.0%) |
| 16 and 17 Years | 0 (0.0%) | 0 (0.0%) |
| 18 to 24 Years | 0 (0.0%) | 3 (4.5%) |
| 25 to 34 Years | 24 (27.6%) | 31 (16.5%) |
| 35 to 44 Years | 2 (3.5%) | 0 (0.0%) |
| 45 to 54 Years | 1 (3.2%) | 44 (50.6%) |
| 55 to 64 Years | 14 (11.2%) | 19 (15.2%) |
| 65 to 74 Years | 0 (0.0%) | 0 (0.0%) |
| 75 Years and over | 0 (0.0%) | 2 (6.1%) |
| Total | 54 (10.4%) | 151 (21.2%) |
Income Above Poverty by Sex and Age in Cambria
According to the poverty statistics in Cambria, males aged under 5 years and females aged 35 to 44 years are the age groups that are most secure financially, with 100.0% of males and 100.0% of females in these age groups living above the poverty line.
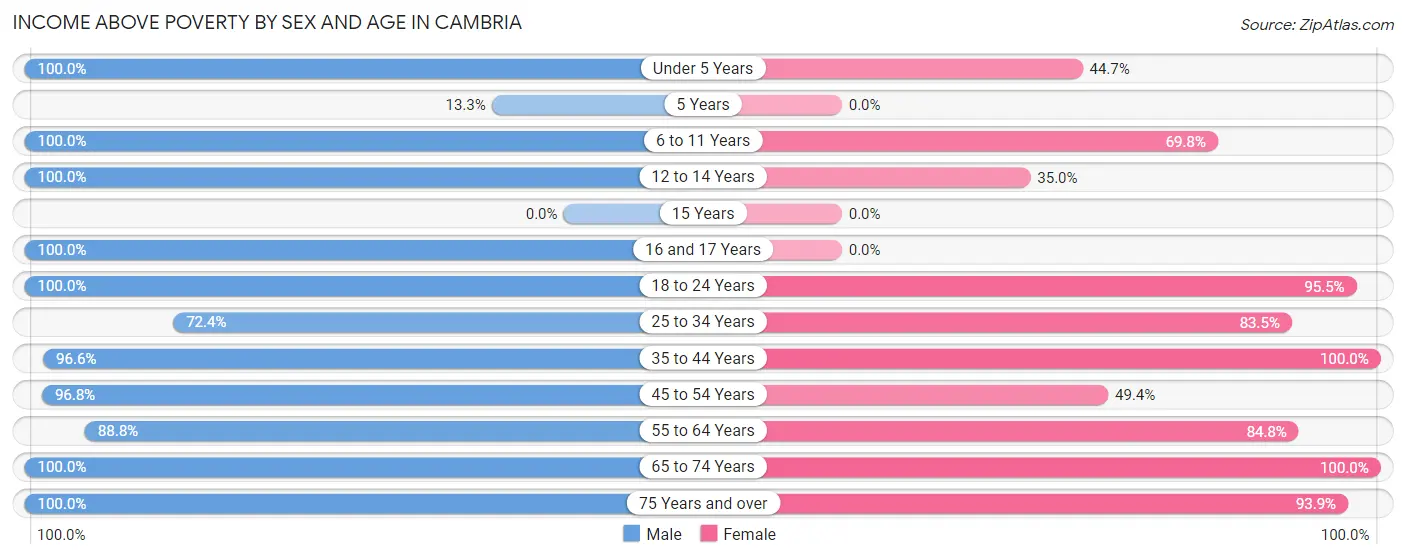
| Age Bracket | Male | Female |
| Under 5 Years | 44 (100.0%) | 21 (44.7%) |
| 5 Years | 2 (13.3%) | 0 (0.0%) |
| 6 to 11 Years | 32 (100.0%) | 30 (69.8%) |
| 12 to 14 Years | 21 (100.0%) | 7 (35.0%) |
| 15 Years | 0 (0.0%) | 0 (0.0%) |
| 16 and 17 Years | 21 (100.0%) | 0 (0.0%) |
| 18 to 24 Years | 21 (100.0%) | 64 (95.5%) |
| 25 to 34 Years | 63 (72.4%) | 157 (83.5%) |
| 35 to 44 Years | 56 (96.6%) | 29 (100.0%) |
| 45 to 54 Years | 30 (96.8%) | 43 (49.4%) |
| 55 to 64 Years | 111 (88.8%) | 106 (84.8%) |
| 65 to 74 Years | 47 (100.0%) | 72 (100.0%) |
| 75 Years and over | 18 (100.0%) | 31 (93.9%) |
| Total | 466 (89.6%) | 560 (78.8%) |
Income Below Poverty Among Married-Couple Families in Cambria
The poverty statistics for married-couple families in Cambria show that 5.5% or 11 of the total 199 families live below the poverty line. Families with no children have the highest poverty rate of 6.9%, comprising of 11 families. On the other hand, families with 1 or 2 children have the lowest poverty rate of 0.0%, which includes 0 families.
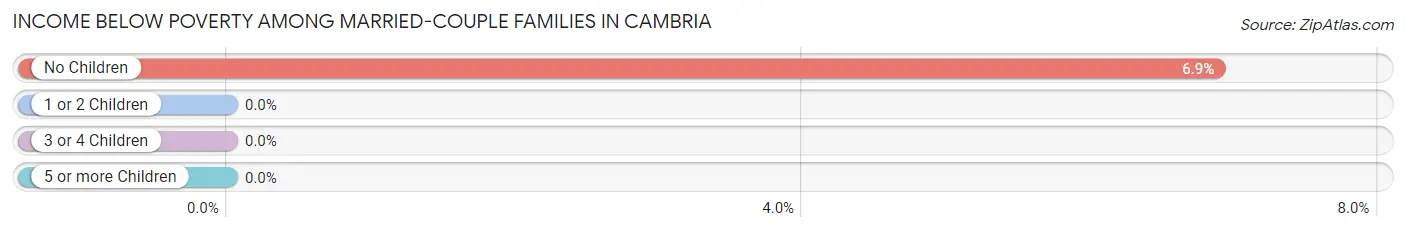
| Children | Above Poverty | Below Poverty |
| No Children | 149 (93.1%) | 11 (6.9%) |
| 1 or 2 Children | 34 (100.0%) | 0 (0.0%) |
| 3 or 4 Children | 5 (100.0%) | 0 (0.0%) |
| 5 or more Children | 0 (0.0%) | 0 (0.0%) |
| Total | 188 (94.5%) | 11 (5.5%) |
Income Below Poverty Among Single-Parent Households in Cambria
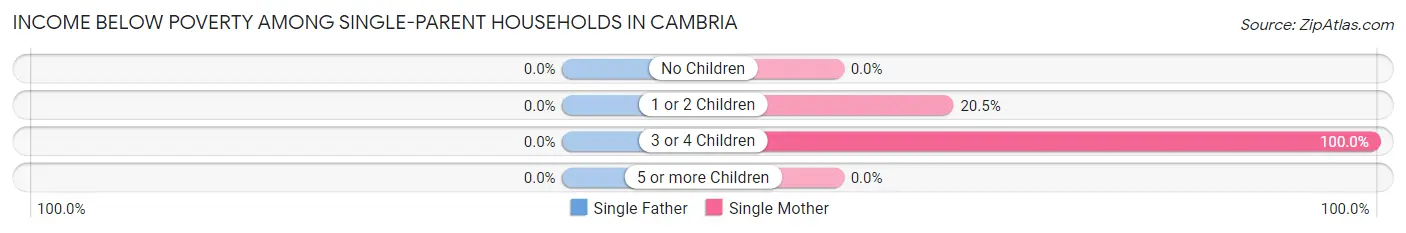
| Children | Single Father | Single Mother |
| No Children | 0 (0.0%) | 0 (0.0%) |
| 1 or 2 Children | 0 (0.0%) | 18 (20.4%) |
| 3 or 4 Children | 0 (0.0%) | 10 (100.0%) |
| 5 or more Children | 0 (0.0%) | 0 (0.0%) |
| Total | 0 (0.0%) | 28 (18.3%) |
Income Below Poverty Among Married-Couple vs Single-Parent Households in Cambria
The poverty data for Cambria shows that 11 of the married-couple family households (5.5%) and 28 of the single-parent households (14.3%) are living below the poverty level. Within the married-couple family households, those with no children have the highest poverty rate, with 11 households (6.9%) falling below the poverty line. Among the single-parent households, those with 3 or 4 children have the highest poverty rate, with 10 household (100.0%) living below poverty.
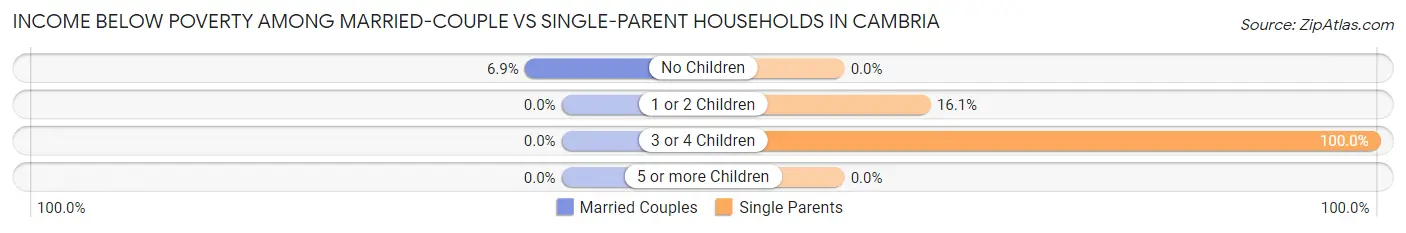
| Children | Married-Couple Families | Single-Parent Households |
| No Children | 11 (6.9%) | 0 (0.0%) |
| 1 or 2 Children | 0 (0.0%) | 18 (16.1%) |
| 3 or 4 Children | 0 (0.0%) | 10 (100.0%) |
| 5 or more Children | 0 (0.0%) | 0 (0.0%) |
| Total | 11 (5.5%) | 28 (14.3%) |
Race in Cambria
The most populous races in Cambria are White / Caucasian (964 | 78.3%), Black / African American (127 | 10.3%), and Hispanic or Latino (121 | 9.8%).
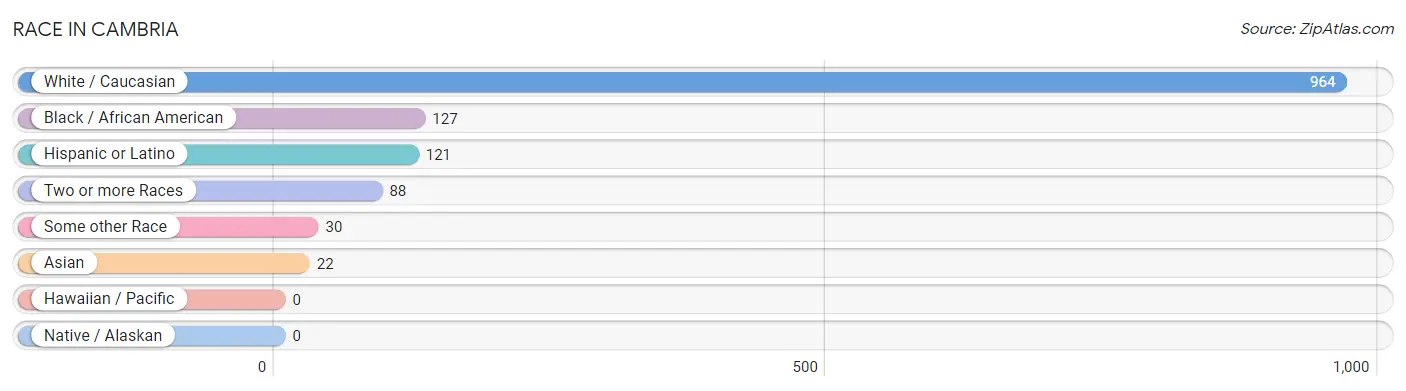
| Race | # Population | % Population |
| Asian | 22 | 1.8% |
| Black / African American | 127 | 10.3% |
| Hawaiian / Pacific | 0 | 0.0% |
| Hispanic or Latino | 121 | 9.8% |
| Native / Alaskan | 0 | 0.0% |
| White / Caucasian | 964 | 78.3% |
| Two or more Races | 88 | 7.1% |
| Some other Race | 30 | 2.4% |
| Total | 1,231 | 100.0% |
Ancestry in Cambria
The most populous ancestries reported in Cambria are German (208 | 16.9%), Irish (151 | 12.3%), English (120 | 9.8%), Mexican (103 | 8.4%), and American (86 | 7.0%), together accounting for 54.3% of all Cambria residents.
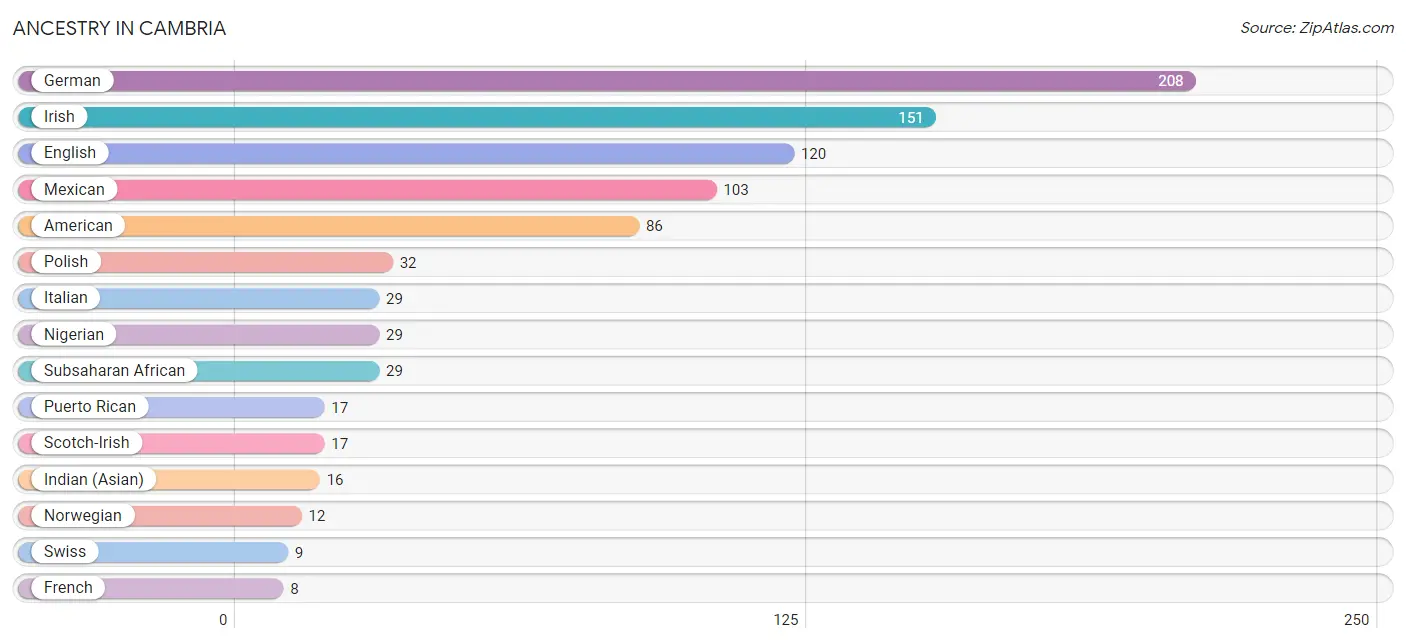
| Ancestry | # Population | % Population |
| American | 86 | 7.0% |
| Czechoslovakian | 4 | 0.3% |
| Danish | 3 | 0.2% |
| Dutch | 1 | 0.1% |
| English | 120 | 9.8% |
| French | 8 | 0.6% |
| German | 208 | 16.9% |
| Hungarian | 3 | 0.2% |
| Indian (Asian) | 16 | 1.3% |
| Irish | 151 | 12.3% |
| Italian | 29 | 2.4% |
| Korean | 6 | 0.5% |
| Mexican | 103 | 8.4% |
| Nigerian | 29 | 2.4% |
| Norwegian | 12 | 1.0% |
| Polish | 32 | 2.6% |
| Puerto Rican | 17 | 1.4% |
| Scotch-Irish | 17 | 1.4% |
| Subsaharan African | 29 | 2.4% |
| Swedish | 2 | 0.2% |
| Swiss | 9 | 0.7% | View All 21 Rows |
Immigrants in Cambria
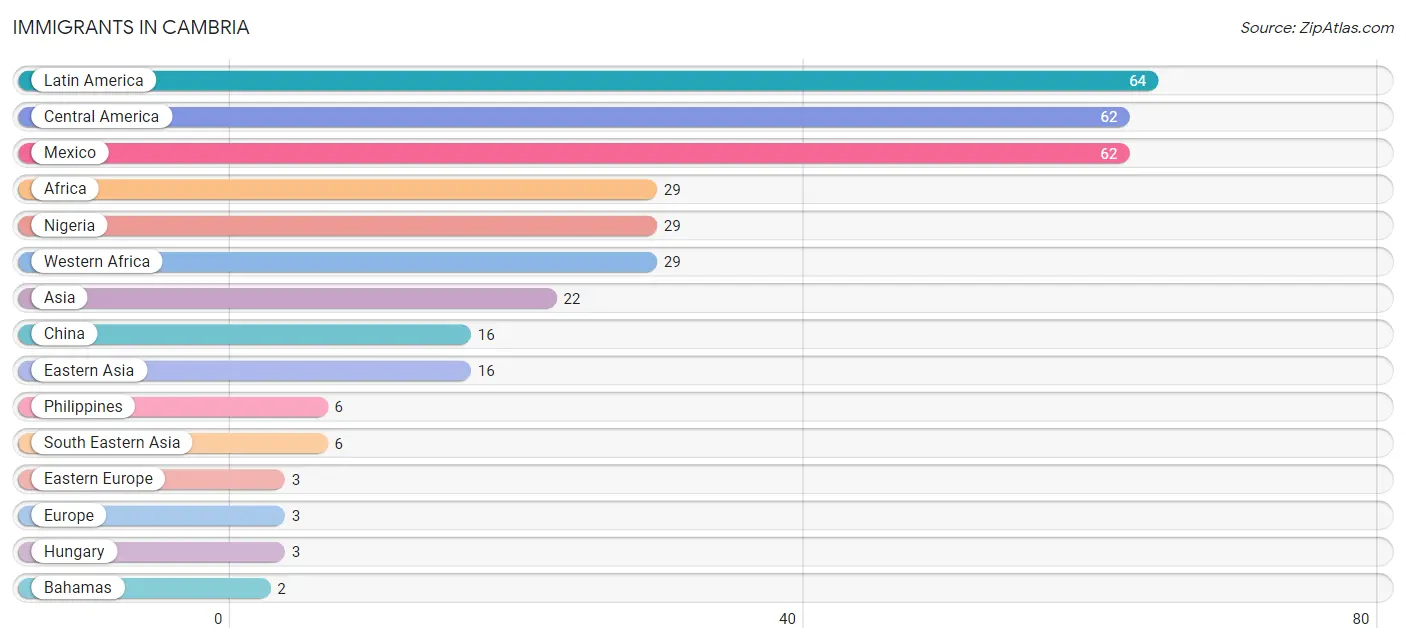
The most numerous immigrant groups reported in Cambria came from Latin America (64 | 5.2%), Central America (62 | 5.0%), Mexico (62 | 5.0%), Africa (29 | 2.4%), and Nigeria (29 | 2.4%), together accounting for 20.0% of all Cambria residents.
| Immigration Origin | # Population | % Population |
| Africa | 29 | 2.4% |
| Asia | 22 | 1.8% |
| Bahamas | 2 | 0.2% |
| Caribbean | 2 | 0.2% |
| Central America | 62 | 5.0% |
| China | 16 | 1.3% |
| Eastern Asia | 16 | 1.3% |
| Eastern Europe | 3 | 0.2% |
| Europe | 3 | 0.2% |
| Hungary | 3 | 0.2% |
| Latin America | 64 | 5.2% |
| Mexico | 62 | 5.0% |
| Nigeria | 29 | 2.4% |
| Philippines | 6 | 0.5% |
| South Eastern Asia | 6 | 0.5% |
| Western Africa | 29 | 2.4% | View All 16 Rows |
Sex and Age in Cambria
Sex and Age in Cambria
The most populous age groups in Cambria are 60 to 64 Years (80 | 15.4%) for men and 30 to 34 Years (119 | 16.7%) for women.
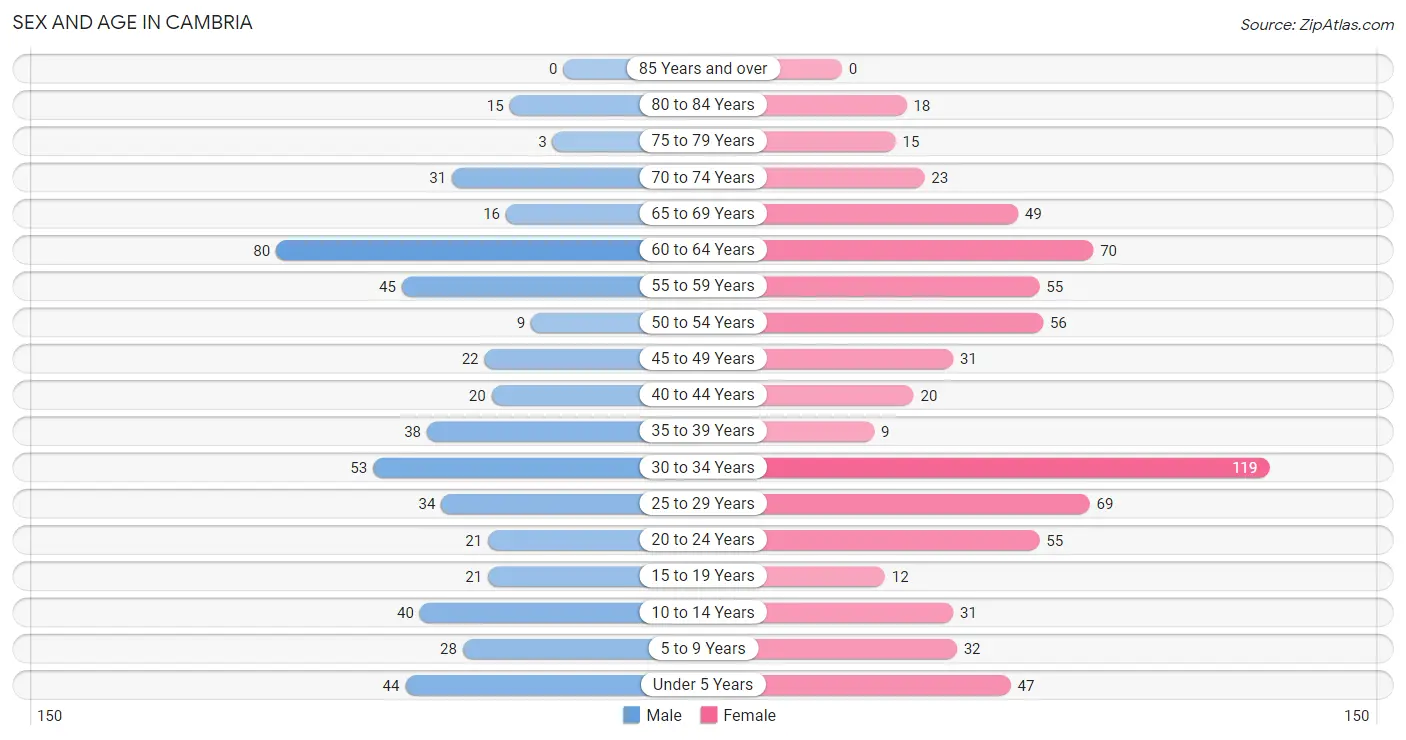
| Age Bracket | Male | Female |
| Under 5 Years | 44 (8.5%) | 47 (6.6%) |
| 5 to 9 Years | 28 (5.4%) | 32 (4.5%) |
| 10 to 14 Years | 40 (7.7%) | 31 (4.4%) |
| 15 to 19 Years | 21 (4.0%) | 12 (1.7%) |
| 20 to 24 Years | 21 (4.0%) | 55 (7.7%) |
| 25 to 29 Years | 34 (6.5%) | 69 (9.7%) |
| 30 to 34 Years | 53 (10.2%) | 119 (16.7%) |
| 35 to 39 Years | 38 (7.3%) | 9 (1.3%) |
| 40 to 44 Years | 20 (3.8%) | 20 (2.8%) |
| 45 to 49 Years | 22 (4.2%) | 31 (4.4%) |
| 50 to 54 Years | 9 (1.7%) | 56 (7.9%) |
| 55 to 59 Years | 45 (8.6%) | 55 (7.7%) |
| 60 to 64 Years | 80 (15.4%) | 70 (9.9%) |
| 65 to 69 Years | 16 (3.1%) | 49 (6.9%) |
| 70 to 74 Years | 31 (6.0%) | 23 (3.2%) |
| 75 to 79 Years | 3 (0.6%) | 15 (2.1%) |
| 80 to 84 Years | 15 (2.9%) | 18 (2.5%) |
| 85 Years and over | 0 (0.0%) | 0 (0.0%) |
| Total | 520 (100.0%) | 711 (100.0%) |
Families and Households in Cambria
Median Family Size in Cambria
The median family size in Cambria is 2.39 persons per family, with married-couple families (199 | 50.4%) accounting for the largest median family size of 2.53 persons per family. On the other hand, single male/father families (43 | 10.9%) represent the smallest median family size with 2.12 persons per family.
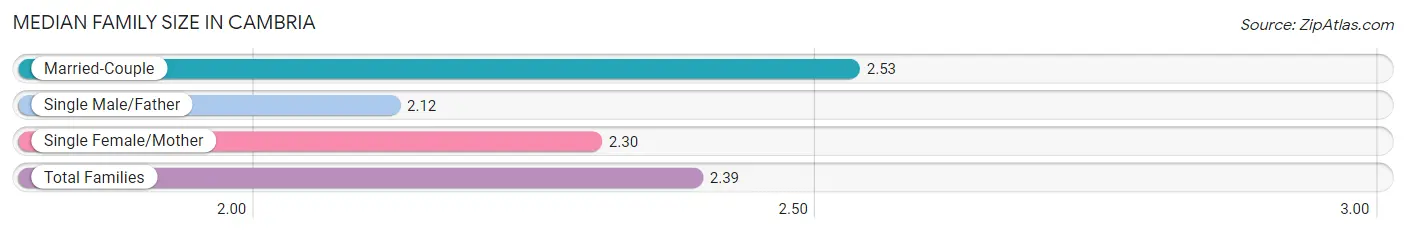
| Family Type | # Families | Family Size |
| Married-Couple | 199 (50.4%) | 2.53 |
| Single Male/Father | 43 (10.9%) | 2.12 |
| Single Female/Mother | 153 (38.7%) | 2.30 |
| Total Families | 395 (100.0%) | 2.39 |
Median Household Size in Cambria
The median household size in Cambria is 1.94 persons per household, with married-couple households (199 | 31.4%) accounting for the largest median household size of 2.53 persons per household. non-family households (239 | 37.7%) represent the smallest median household size with 1.02 persons per household.
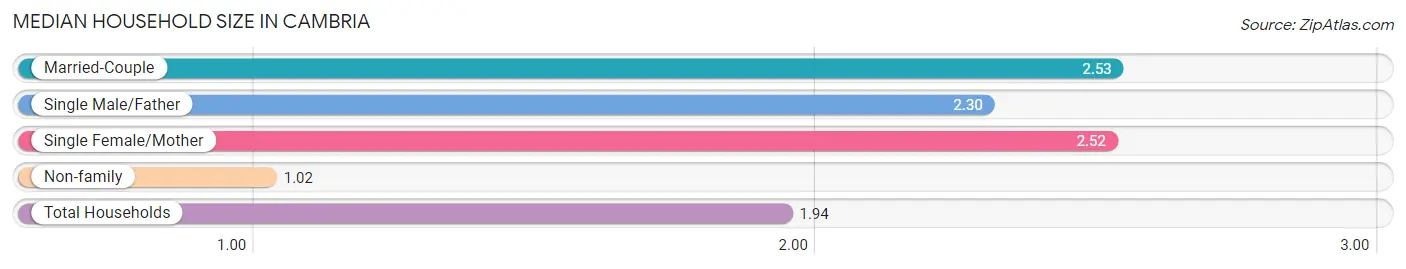
| Household Type | # Households | Household Size |
| Married-Couple | 199 (31.4%) | 2.53 |
| Single Male/Father | 43 (6.8%) | 2.30 |
| Single Female/Mother | 153 (24.1%) | 2.52 |
| Non-family | 239 (37.7%) | 1.02 |
| Total Households | 634 (100.0%) | 1.94 |
Household Size by Marriage Status in Cambria
Out of a total of 634 households in Cambria, 395 (62.3%) are family households, while 239 (37.7%) are nonfamily households. The most numerous type of family households are 2-person households, comprising 298, and the most common type of nonfamily households are 1-person households, comprising 233.
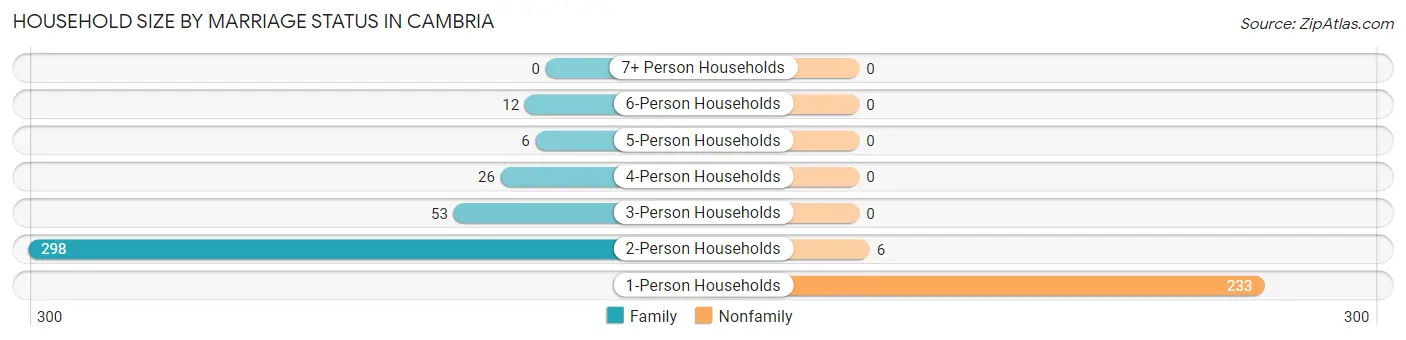
| Household Size | Family Households | Nonfamily Households |
| 1-Person Households | - | 233 (36.7%) |
| 2-Person Households | 298 (47.0%) | 6 (0.9%) |
| 3-Person Households | 53 (8.4%) | 0 (0.0%) |
| 4-Person Households | 26 (4.1%) | 0 (0.0%) |
| 5-Person Households | 6 (0.9%) | 0 (0.0%) |
| 6-Person Households | 12 (1.9%) | 0 (0.0%) |
| 7+ Person Households | 0 (0.0%) | 0 (0.0%) |
| Total | 395 (62.3%) | 239 (37.7%) |
Female Fertility in Cambria
Fertility by Age in Cambria
Average fertility rate in Cambria is 130.0 births per 1,000 women. Women in the age bracket of 20 to 34 years have the highest fertility rate with 177.0 births per 1,000 women. Women in the age bracket of 20 to 34 years acount for 95.6% of all women with births.
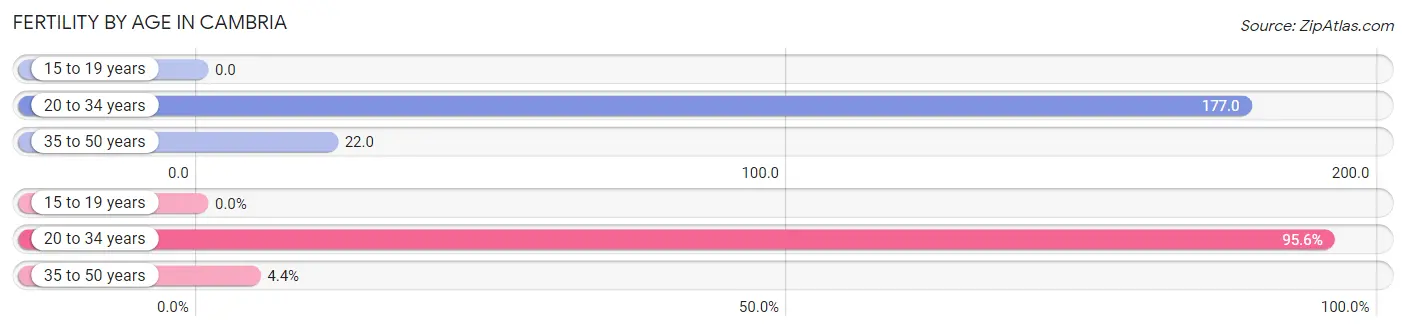
| Age Bracket | Women with Births | Births / 1,000 Women |
| 15 to 19 years | 0 (0.0%) | 0.0 |
| 20 to 34 years | 43 (95.6%) | 177.0 |
| 35 to 50 years | 2 (4.4%) | 22.0 |
| Total | 45 (100.0%) | 130.0 |
Fertility by Age by Marriage Status in Cambria
4.4% of women with births (45) in Cambria are married. The highest percentage of unmarried women with births falls into 20 to 34 years age bracket with 100.0% of them unmarried at the time of birth, while the lowest percentage of unmarried women with births belong to 35 to 50 years age bracket with 0.0% of them unmarried.
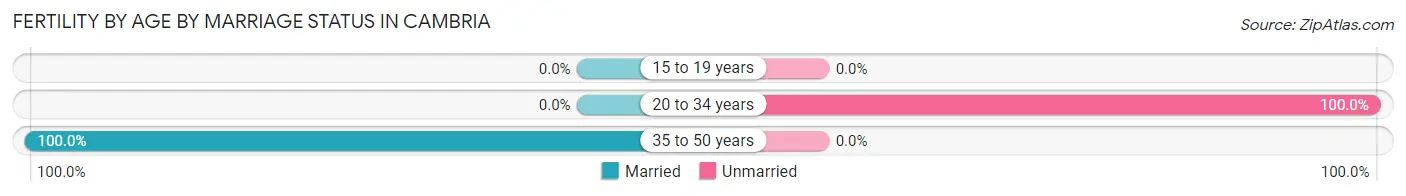
| Age Bracket | Married | Unmarried |
| 15 to 19 years | 0 (0.0%) | 0 (0.0%) |
| 20 to 34 years | 0 (0.0%) | 43 (100.0%) |
| 35 to 50 years | 2 (100.0%) | 0 (0.0%) |
| Total | 2 (4.4%) | 43 (95.6%) |
Fertility by Education in Cambria
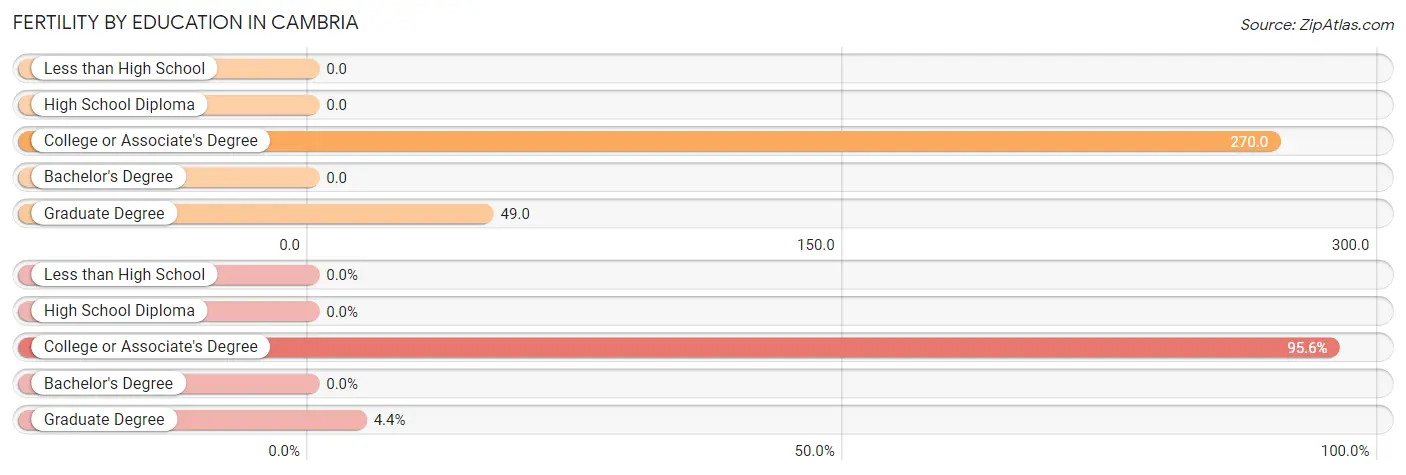
| Educational Attainment | Women with Births | Births / 1,000 Women |
| Less than High School | 0 (0.0%) | 0.0 |
| High School Diploma | 0 (0.0%) | 0.0 |
| College or Associate's Degree | 43 (95.6%) | 270.0 |
| Bachelor's Degree | 0 (0.0%) | 0.0 |
| Graduate Degree | 2 (4.4%) | 49.0 |
| Total | 45 (100.0%) | 130.0 |
Fertility by Education by Marriage Status in Cambria
95.6% of women with births in Cambria are unmarried. Women with the educational attainment of graduate degree are most likely to be married with 100.0% of them married at childbirth, while women with the educational attainment of college or associate's degree are least likely to be married with 100.0% of them unmarried at childbirth.
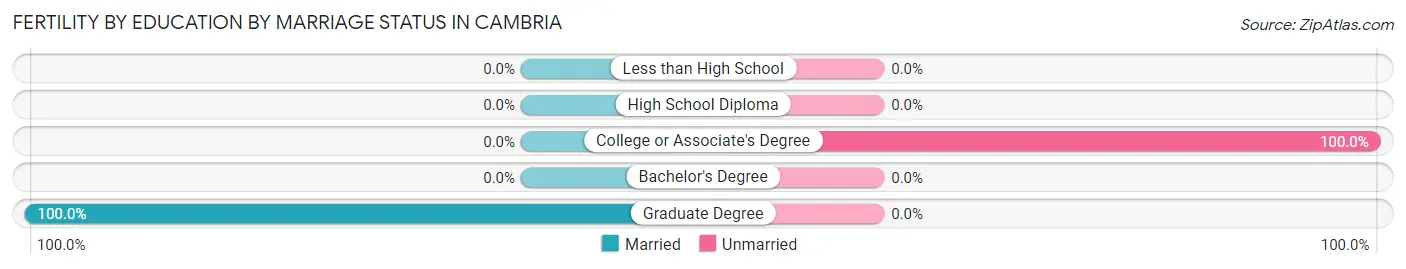
| Educational Attainment | Married | Unmarried |
| Less than High School | 0 (0.0%) | 0 (0.0%) |
| High School Diploma | 0 (0.0%) | 0 (0.0%) |
| College or Associate's Degree | 0 (0.0%) | 43 (100.0%) |
| Bachelor's Degree | 0 (0.0%) | 0 (0.0%) |
| Graduate Degree | 2 (100.0%) | 0 (0.0%) |
| Total | 2 (4.4%) | 43 (95.6%) |
Employment Characteristics in Cambria
Employment by Class of Employer in Cambria
Among the 572 employed individuals in Cambria, private company employees (333 | 58.2%), not-for-profit organizations (78 | 13.6%), and local government employees (61 | 10.7%) make up the most common classes of employment.
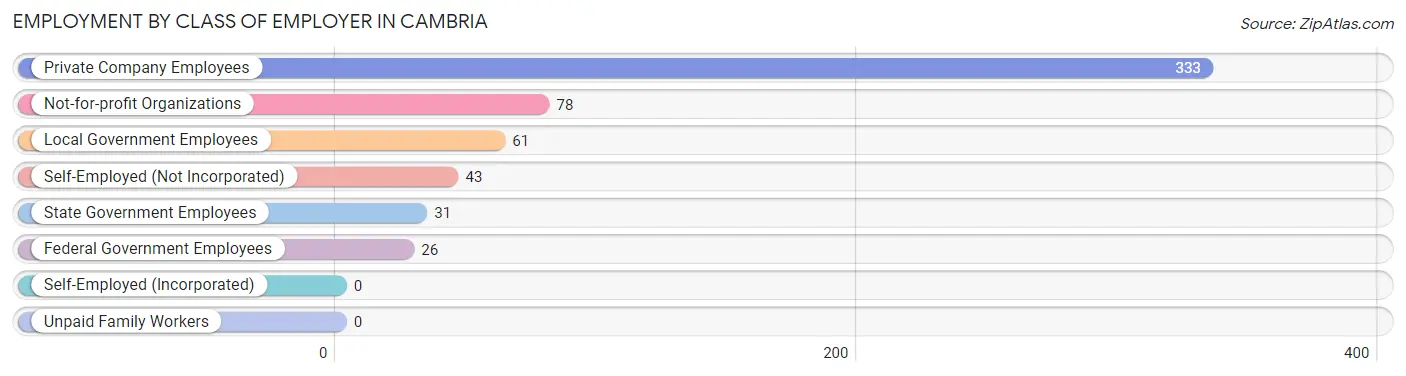
| Employer Class | # Employees | % Employees |
| Private Company Employees | 333 | 58.2% |
| Self-Employed (Incorporated) | 0 | 0.0% |
| Self-Employed (Not Incorporated) | 43 | 7.5% |
| Not-for-profit Organizations | 78 | 13.6% |
| Local Government Employees | 61 | 10.7% |
| State Government Employees | 31 | 5.4% |
| Federal Government Employees | 26 | 4.5% |
| Unpaid Family Workers | 0 | 0.0% |
| Total | 572 | 100.0% |
Employment Status by Age in Cambria
According to the labor force statistics for Cambria, out of the total population over 16 years of age (1,009), 62.2% or 628 individuals are in the labor force, with 5.5% or 35 of them unemployed. The age group with the highest labor force participation rate is 25 to 29 years, with 97.1% or 100 individuals in the labor force. Within the labor force, the 55 to 59 years age range has the highest percentage of unemployed individuals, with 31.4% or 16 of them being unemployed.
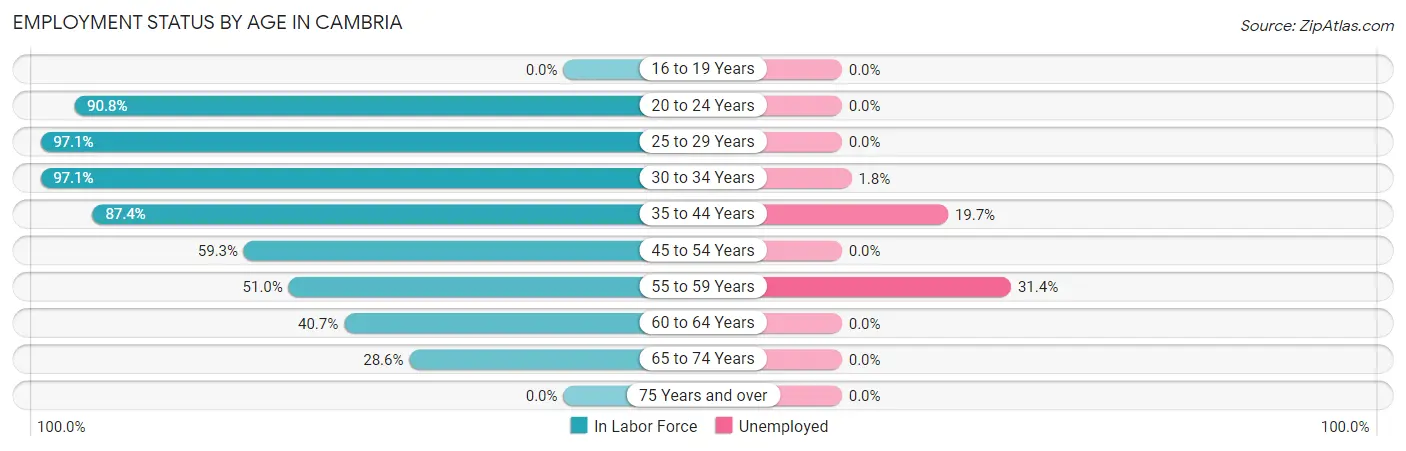
| Age Bracket | In Labor Force | Unemployed |
| 16 to 19 Years | 0 (0.0%) | 0 (0.0%) |
| 20 to 24 Years | 69 (90.8%) | 0 (0.0%) |
| 25 to 29 Years | 100 (97.1%) | 0 (0.0%) |
| 30 to 34 Years | 167 (97.1%) | 3 (1.8%) |
| 35 to 44 Years | 76 (87.4%) | 15 (19.7%) |
| 45 to 54 Years | 70 (59.3%) | 0 (0.0%) |
| 55 to 59 Years | 51 (51.0%) | 16 (31.4%) |
| 60 to 64 Years | 61 (40.7%) | 0 (0.0%) |
| 65 to 74 Years | 34 (28.6%) | 0 (0.0%) |
| 75 Years and over | 0 (0.0%) | 0 (0.0%) |
| Total | 628 (62.2%) | 35 (5.5%) |
Employment Status by Educational Attainment in Cambria
According to labor force statistics for Cambria, 71.9% of individuals (525) out of the total population between 25 and 64 years of age (730) are in the labor force, with 6.6% or 35 of them being unemployed. The group with the highest labor force participation rate are those with the educational attainment of bachelor's degree or higher, with 92.2% or 107 individuals in the labor force. Within the labor force, individuals with high school diploma education have the highest percentage of unemployment, with 22.1% or 31 of them being unemployed.
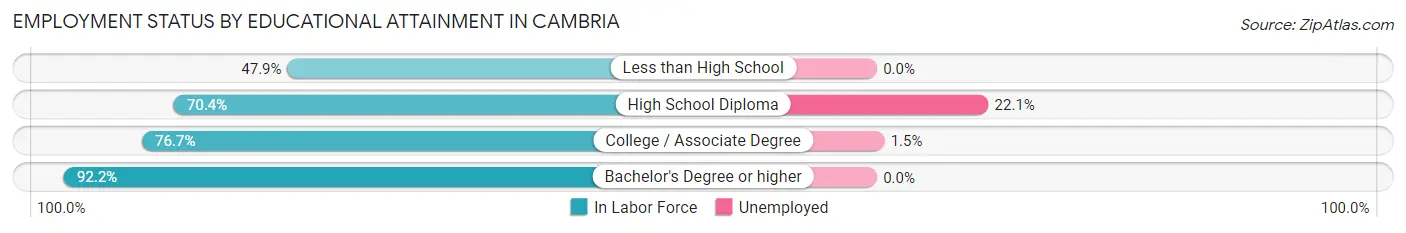
| Educational Attainment | In Labor Force | Unemployed |
| Less than High School | 67 (47.9%) | 0 (0.0%) |
| High School Diploma | 140 (70.4%) | 44 (22.1%) |
| College / Associate Degree | 211 (76.7%) | 4 (1.5%) |
| Bachelor's Degree or higher | 107 (92.2%) | 0 (0.0%) |
| Total | 525 (71.9%) | 48 (6.6%) |
Employment Occupations by Sex in Cambria
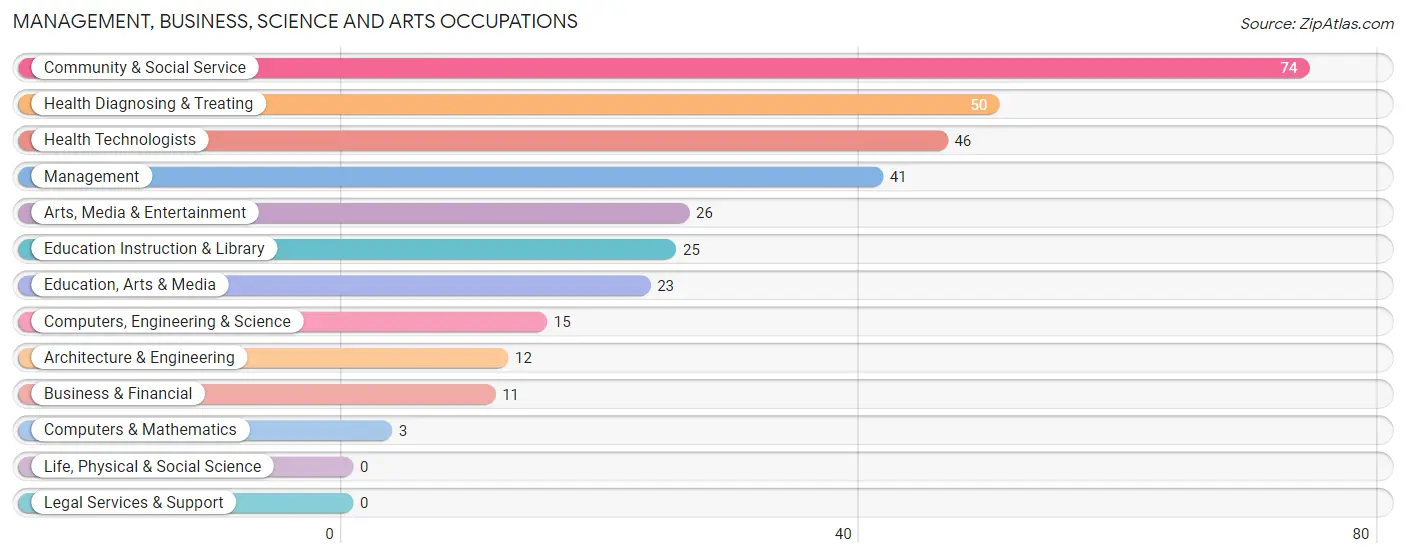
Management, Business, Science and Arts Occupations
The most common Management, Business, Science and Arts occupations in Cambria are Community & Social Service (74 | 12.7%), Health Diagnosing & Treating (50 | 8.6%), Health Technologists (46 | 7.9%), Management (41 | 7.0%), and Arts, Media & Entertainment (26 | 4.4%).
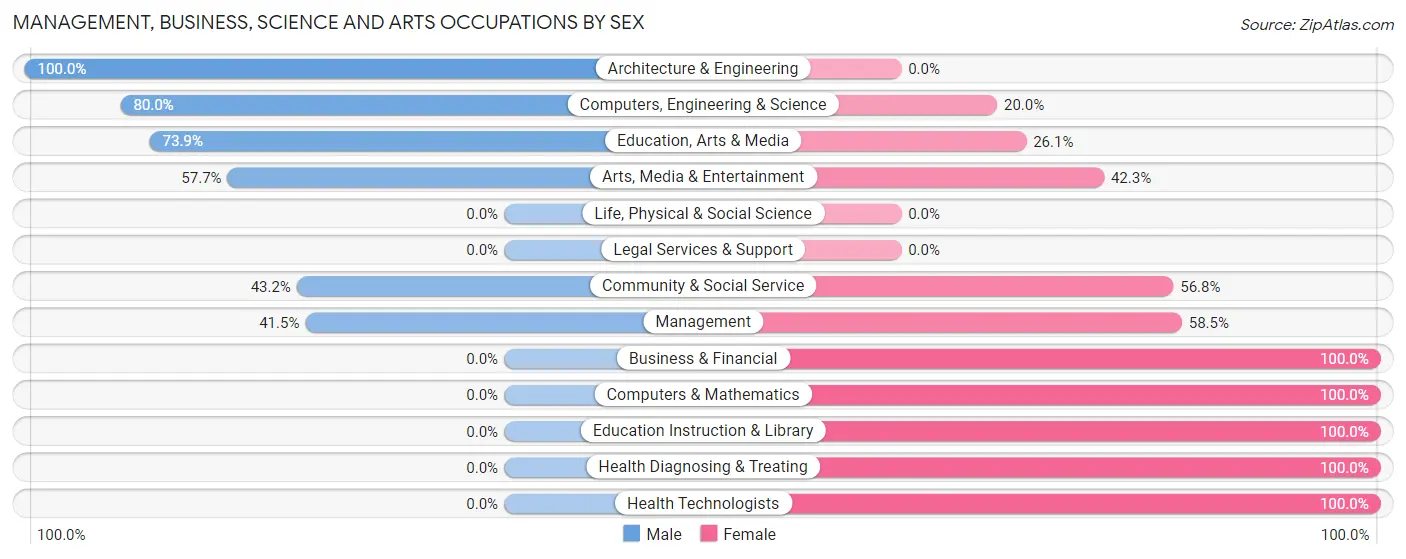
Management, Business, Science and Arts Occupations by Sex
Within the Management, Business, Science and Arts occupations in Cambria, the most male-oriented occupations are Architecture & Engineering (100.0%), Computers, Engineering & Science (80.0%), and Education, Arts & Media (73.9%), while the most female-oriented occupations are Business & Financial (100.0%), Computers & Mathematics (100.0%), and Education Instruction & Library (100.0%).
| Occupation | Male | Female |
| Management | 17 (41.5%) | 24 (58.5%) |
| Business & Financial | 0 (0.0%) | 11 (100.0%) |
| Computers, Engineering & Science | 12 (80.0%) | 3 (20.0%) |
| Computers & Mathematics | 0 (0.0%) | 3 (100.0%) |
| Architecture & Engineering | 12 (100.0%) | 0 (0.0%) |
| Life, Physical & Social Science | 0 (0.0%) | 0 (0.0%) |
| Community & Social Service | 32 (43.2%) | 42 (56.8%) |
| Education, Arts & Media | 17 (73.9%) | 6 (26.1%) |
| Legal Services & Support | 0 (0.0%) | 0 (0.0%) |
| Education Instruction & Library | 0 (0.0%) | 25 (100.0%) |
| Arts, Media & Entertainment | 15 (57.7%) | 11 (42.3%) |
| Health Diagnosing & Treating | 0 (0.0%) | 50 (100.0%) |
| Health Technologists | 0 (0.0%) | 46 (100.0%) |
| Total (Category) | 61 (31.9%) | 130 (68.1%) |
| Total (Overall) | 218 (37.3%) | 366 (62.7%) |
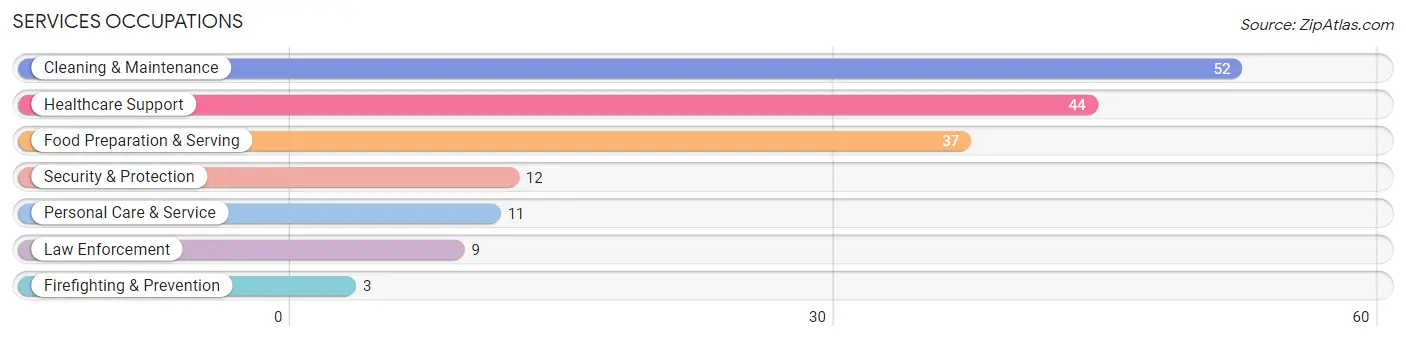
Services Occupations
The most common Services occupations in Cambria are Cleaning & Maintenance (52 | 8.9%), Healthcare Support (44 | 7.5%), Food Preparation & Serving (37 | 6.3%), Security & Protection (12 | 2.1%), and Personal Care & Service (11 | 1.9%).
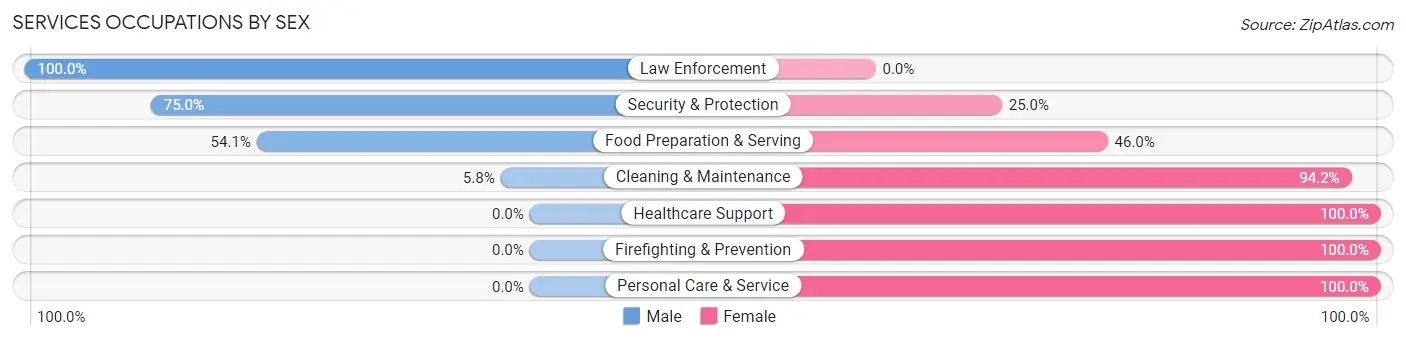
Services Occupations by Sex
Within the Services occupations in Cambria, the most male-oriented occupations are Law Enforcement (100.0%), Security & Protection (75.0%), and Food Preparation & Serving (54.0%), while the most female-oriented occupations are Healthcare Support (100.0%), Firefighting & Prevention (100.0%), and Personal Care & Service (100.0%).
| Occupation | Male | Female |
| Healthcare Support | 0 (0.0%) | 44 (100.0%) |
| Security & Protection | 9 (75.0%) | 3 (25.0%) |
| Firefighting & Prevention | 0 (0.0%) | 3 (100.0%) |
| Law Enforcement | 9 (100.0%) | 0 (0.0%) |
| Food Preparation & Serving | 20 (54.0%) | 17 (46.0%) |
| Cleaning & Maintenance | 3 (5.8%) | 49 (94.2%) |
| Personal Care & Service | 0 (0.0%) | 11 (100.0%) |
| Total (Category) | 32 (20.5%) | 124 (79.5%) |
| Total (Overall) | 218 (37.3%) | 366 (62.7%) |
Sales and Office Occupations
The most common Sales and Office occupations in Cambria are Sales & Related (64 | 11.0%), and Office & Administration (51 | 8.7%).
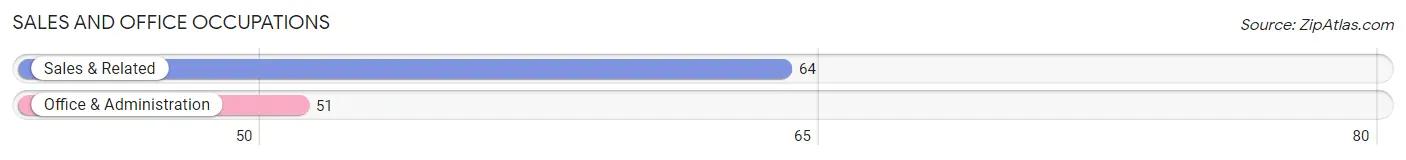
Sales and Office Occupations by Sex
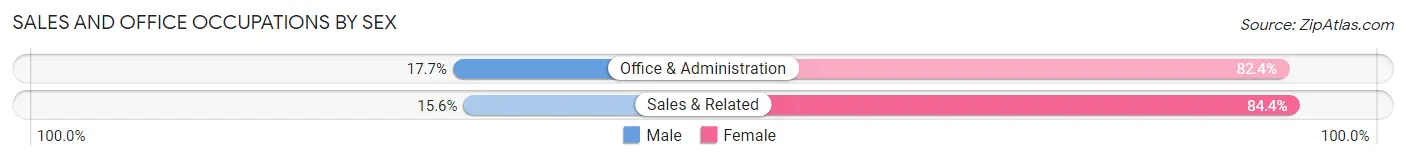
| Occupation | Male | Female |
| Sales & Related | 10 (15.6%) | 54 (84.4%) |
| Office & Administration | 9 (17.6%) | 42 (82.4%) |
| Total (Category) | 19 (16.5%) | 96 (83.5%) |
| Total (Overall) | 218 (37.3%) | 366 (62.7%) |
Natural Resources, Construction and Maintenance Occupations
The most common Natural Resources, Construction and Maintenance occupations in Cambria are Construction & Extraction (29 | 5.0%), and Installation, Maintenance & Repair (9 | 1.5%).
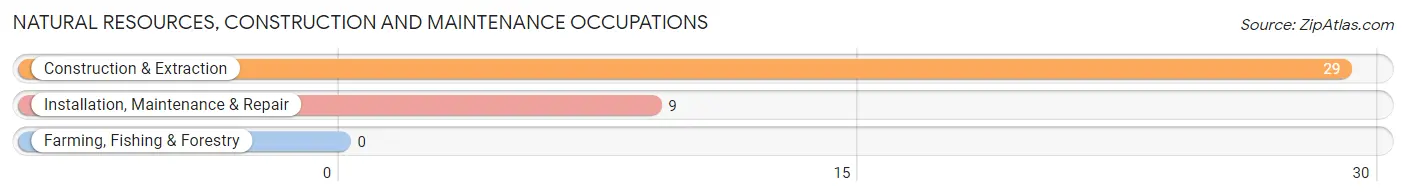
Natural Resources, Construction and Maintenance Occupations by Sex
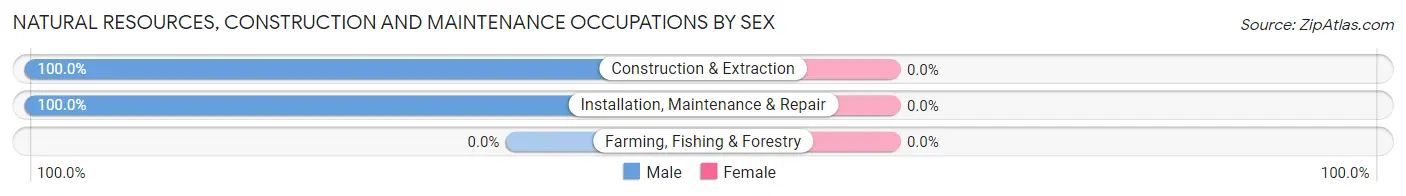
| Occupation | Male | Female |
| Farming, Fishing & Forestry | 0 (0.0%) | 0 (0.0%) |
| Construction & Extraction | 29 (100.0%) | 0 (0.0%) |
| Installation, Maintenance & Repair | 9 (100.0%) | 0 (0.0%) |
| Total (Category) | 38 (100.0%) | 0 (0.0%) |
| Total (Overall) | 218 (37.3%) | 366 (62.7%) |
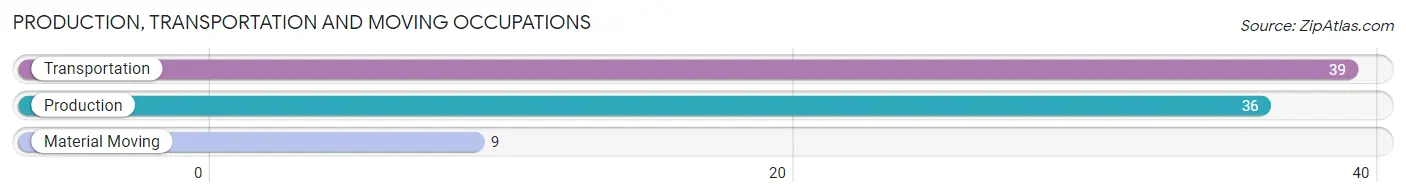
Production, Transportation and Moving Occupations
The most common Production, Transportation and Moving occupations in Cambria are Transportation (39 | 6.7%), Production (36 | 6.2%), and Material Moving (9 | 1.5%).
Production, Transportation and Moving Occupations by Sex
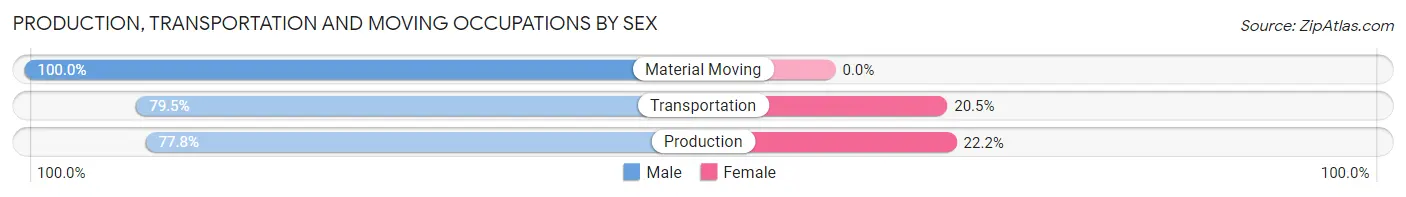
| Occupation | Male | Female |
| Production | 28 (77.8%) | 8 (22.2%) |
| Transportation | 31 (79.5%) | 8 (20.5%) |
| Material Moving | 9 (100.0%) | 0 (0.0%) |
| Total (Category) | 68 (80.9%) | 16 (19.1%) |
| Total (Overall) | 218 (37.3%) | 366 (62.7%) |
Employment Industries by Sex in Cambria
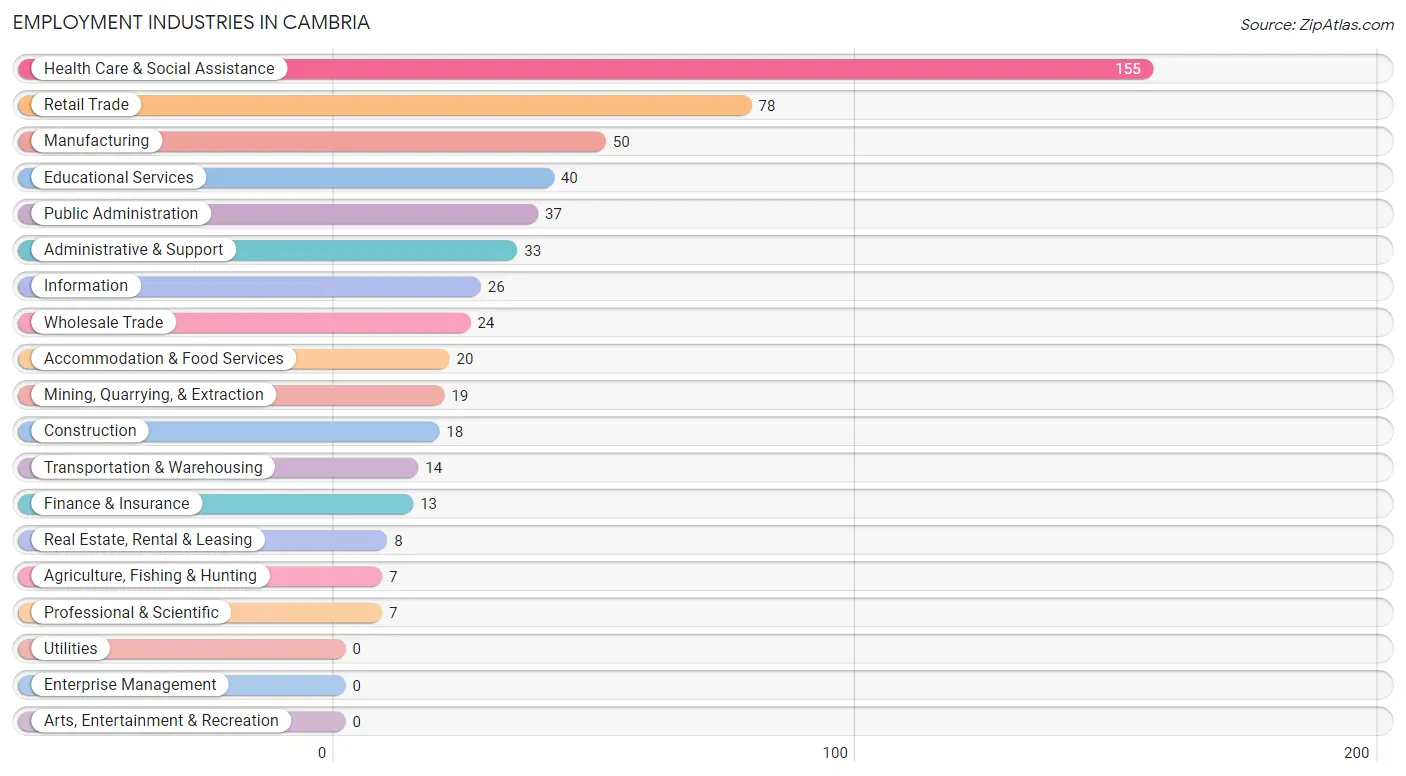
Employment Industries in Cambria
The major employment industries in Cambria include Health Care & Social Assistance (155 | 26.5%), Retail Trade (78 | 13.4%), Manufacturing (50 | 8.6%), Educational Services (40 | 6.9%), and Public Administration (37 | 6.3%).
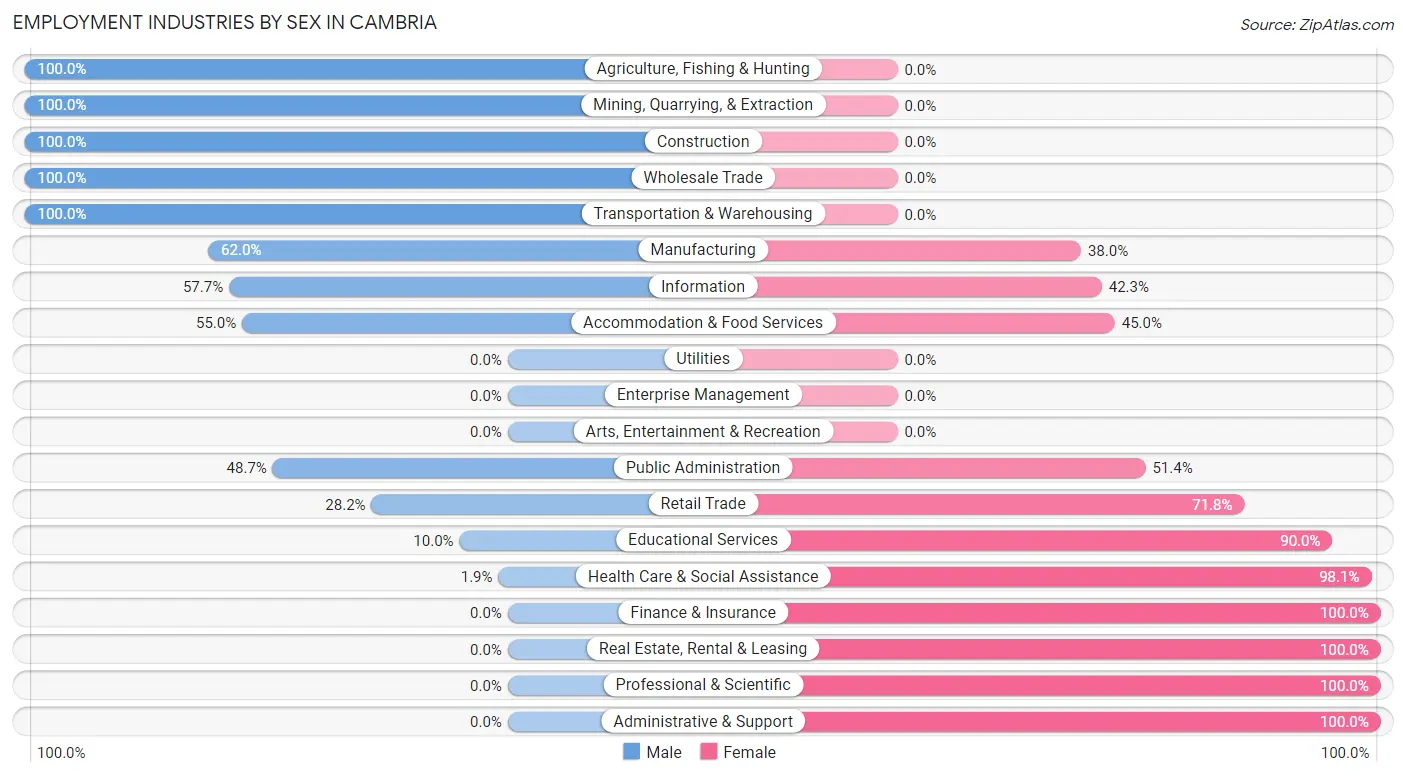
Employment Industries by Sex in Cambria
The Cambria industries that see more men than women are Agriculture, Fishing & Hunting (100.0%), Mining, Quarrying, & Extraction (100.0%), and Construction (100.0%), whereas the industries that tend to have a higher number of women are Finance & Insurance (100.0%), Real Estate, Rental & Leasing (100.0%), and Professional & Scientific (100.0%).
| Industry | Male | Female |
| Agriculture, Fishing & Hunting | 7 (100.0%) | 0 (0.0%) |
| Mining, Quarrying, & Extraction | 19 (100.0%) | 0 (0.0%) |
| Construction | 18 (100.0%) | 0 (0.0%) |
| Manufacturing | 31 (62.0%) | 19 (38.0%) |
| Wholesale Trade | 24 (100.0%) | 0 (0.0%) |
| Retail Trade | 22 (28.2%) | 56 (71.8%) |
| Transportation & Warehousing | 14 (100.0%) | 0 (0.0%) |
| Utilities | 0 (0.0%) | 0 (0.0%) |
| Information | 15 (57.7%) | 11 (42.3%) |
| Finance & Insurance | 0 (0.0%) | 13 (100.0%) |
| Real Estate, Rental & Leasing | 0 (0.0%) | 8 (100.0%) |
| Professional & Scientific | 0 (0.0%) | 7 (100.0%) |
| Enterprise Management | 0 (0.0%) | 0 (0.0%) |
| Administrative & Support | 0 (0.0%) | 33 (100.0%) |
| Educational Services | 4 (10.0%) | 36 (90.0%) |
| Health Care & Social Assistance | 3 (1.9%) | 152 (98.1%) |
| Arts, Entertainment & Recreation | 0 (0.0%) | 0 (0.0%) |
| Accommodation & Food Services | 11 (55.0%) | 9 (45.0%) |
| Public Administration | 18 (48.6%) | 19 (51.3%) |
| Total | 218 (37.3%) | 366 (62.7%) |
Education in Cambria
School Enrollment in Cambria
The most common levels of schooling among the 235 students in Cambria are college / undergraduate (71 | 30.2%), elementary school (59 | 25.1%), and middle school (54 | 23.0%).
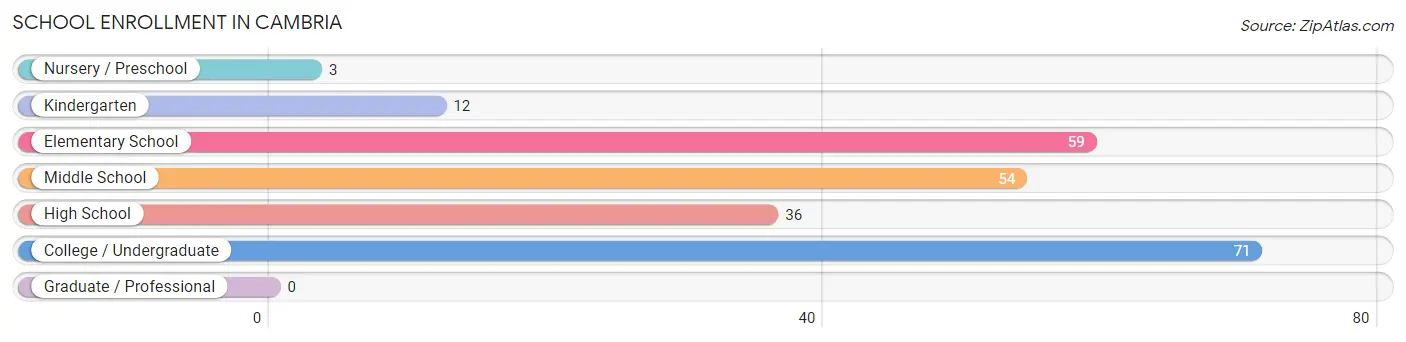
| School Level | # Students | % Students |
| Nursery / Preschool | 3 | 1.3% |
| Kindergarten | 12 | 5.1% |
| Elementary School | 59 | 25.1% |
| Middle School | 54 | 23.0% |
| High School | 36 | 15.3% |
| College / Undergraduate | 71 | 30.2% |
| Graduate / Professional | 0 | 0.0% |
| Total | 235 | 100.0% |
School Enrollment by Age by Funding Source in Cambria
Out of a total of 235 students who are enrolled in schools in Cambria, 37 (15.7%) attend a private institution, while the remaining 198 (84.3%) are enrolled in public schools. The age group of 25 to 34 year olds has the highest likelihood of being enrolled in private schools, with 33 (56.9% in the age bracket) enrolled. Conversely, the age group of 5 to 9 year old has the lowest likelihood of being enrolled in a private school, with 60 (100.0% in the age bracket) attending a public institution.
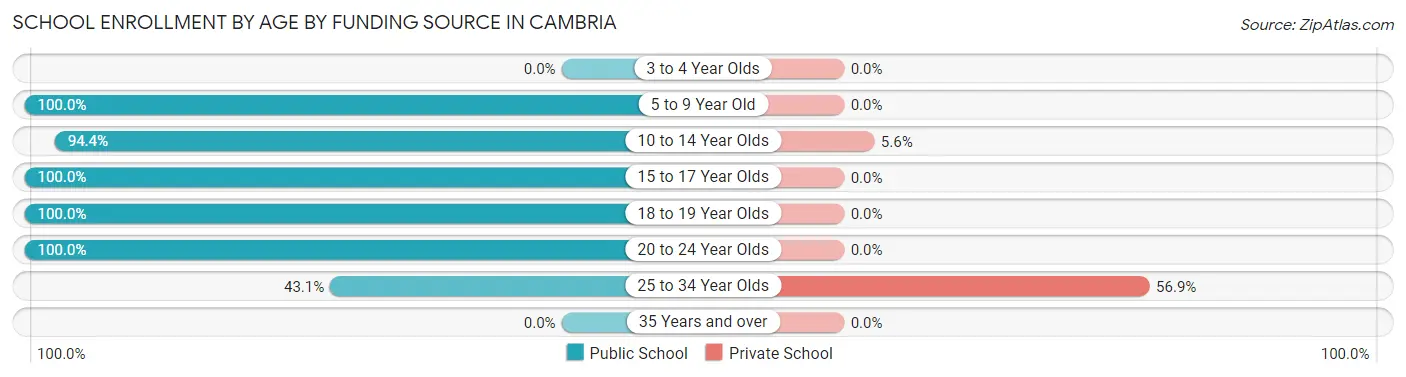
| Age Bracket | Public School | Private School |
| 3 to 4 Year Olds | 0 (0.0%) | 0 (0.0%) |
| 5 to 9 Year Old | 60 (100.0%) | 0 (0.0%) |
| 10 to 14 Year Olds | 67 (94.4%) | 4 (5.6%) |
| 15 to 17 Year Olds | 21 (100.0%) | 0 (0.0%) |
| 18 to 19 Year Olds | 12 (100.0%) | 0 (0.0%) |
| 20 to 24 Year Olds | 13 (100.0%) | 0 (0.0%) |
| 25 to 34 Year Olds | 25 (43.1%) | 33 (56.9%) |
| 35 Years and over | 0 (0.0%) | 0 (0.0%) |
| Total | 198 (84.3%) | 37 (15.7%) |
Educational Attainment by Field of Study in Cambria
Bio, nature & agricultural (34 | 24.3%), education (25 | 17.9%), business (21 | 15.0%), arts & humanities (19 | 13.6%), and visual & performing arts (15 | 10.7%) are the most common fields of study among 140 individuals in Cambria who have obtained a bachelor's degree or higher.
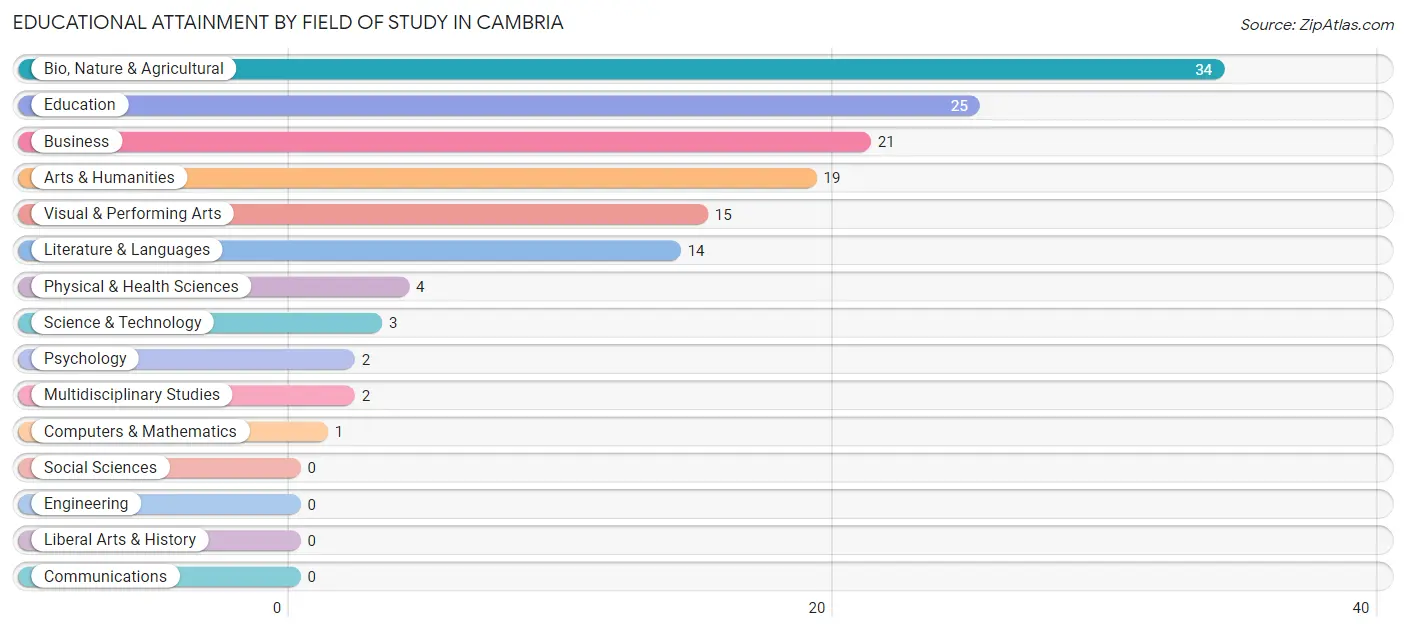
| Field of Study | # Graduates | % Graduates |
| Computers & Mathematics | 1 | 0.7% |
| Bio, Nature & Agricultural | 34 | 24.3% |
| Physical & Health Sciences | 4 | 2.9% |
| Psychology | 2 | 1.4% |
| Social Sciences | 0 | 0.0% |
| Engineering | 0 | 0.0% |
| Multidisciplinary Studies | 2 | 1.4% |
| Science & Technology | 3 | 2.1% |
| Business | 21 | 15.0% |
| Education | 25 | 17.9% |
| Literature & Languages | 14 | 10.0% |
| Liberal Arts & History | 0 | 0.0% |
| Visual & Performing Arts | 15 | 10.7% |
| Communications | 0 | 0.0% |
| Arts & Humanities | 19 | 13.6% |
| Total | 140 | 100.0% |
Transportation & Commute in Cambria
Vehicle Availability by Sex in Cambria
The most prevalent vehicle ownership categories in Cambria are males with 2 vehicles (116, accounting for 53.7%) and females with 2 vehicles (112, making up 32.6%).
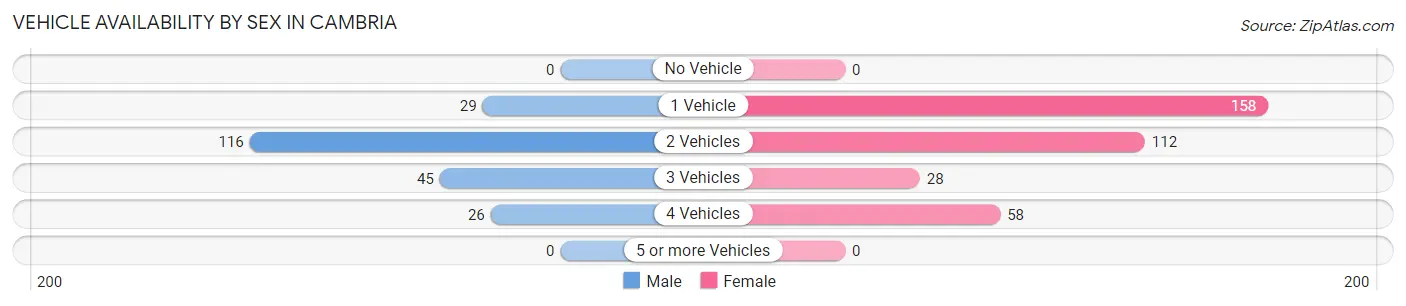
| Vehicles Available | Male | Female |
| No Vehicle | 0 (0.0%) | 0 (0.0%) |
| 1 Vehicle | 29 (13.4%) | 158 (44.4%) |
| 2 Vehicles | 116 (53.7%) | 112 (31.5%) |
| 3 Vehicles | 45 (20.8%) | 28 (7.9%) |
| 4 Vehicles | 26 (12.0%) | 58 (16.3%) |
| 5 or more Vehicles | 0 (0.0%) | 0 (0.0%) |
| Total | 216 (100.0%) | 356 (100.0%) |
Commute Time in Cambria
The most frequently occuring commute durations in Cambria are 15 to 19 minutes (210 commuters, 38.5%), 10 to 14 minutes (96 commuters, 17.6%), and 20 to 24 minutes (81 commuters, 14.8%).
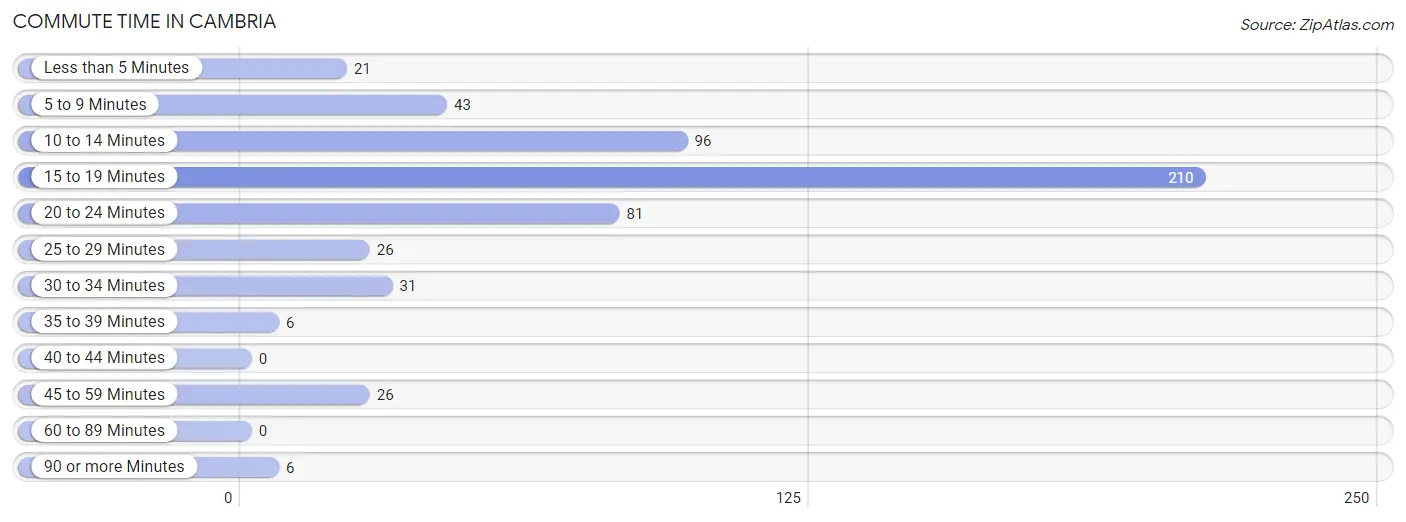
| Commute Time | # Commuters | % Commuters |
| Less than 5 Minutes | 21 | 3.8% |
| 5 to 9 Minutes | 43 | 7.9% |
| 10 to 14 Minutes | 96 | 17.6% |
| 15 to 19 Minutes | 210 | 38.5% |
| 20 to 24 Minutes | 81 | 14.8% |
| 25 to 29 Minutes | 26 | 4.8% |
| 30 to 34 Minutes | 31 | 5.7% |
| 35 to 39 Minutes | 6 | 1.1% |
| 40 to 44 Minutes | 0 | 0.0% |
| 45 to 59 Minutes | 26 | 4.8% |
| 60 to 89 Minutes | 0 | 0.0% |
| 90 or more Minutes | 6 | 1.1% |
Commute Time by Sex in Cambria
The most common commute times in Cambria are 15 to 19 minutes (54 commuters, 27.1%) for males and 15 to 19 minutes (156 commuters, 45.0%) for females.
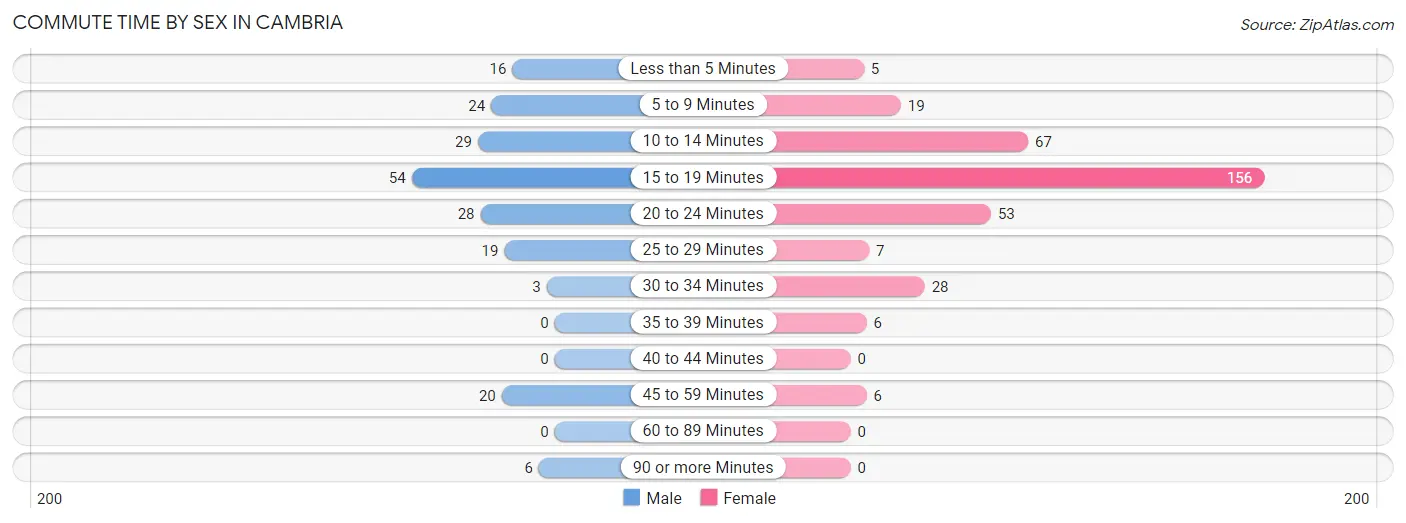
| Commute Time | Male | Female |
| Less than 5 Minutes | 16 (8.0%) | 5 (1.4%) |
| 5 to 9 Minutes | 24 (12.1%) | 19 (5.5%) |
| 10 to 14 Minutes | 29 (14.6%) | 67 (19.3%) |
| 15 to 19 Minutes | 54 (27.1%) | 156 (45.0%) |
| 20 to 24 Minutes | 28 (14.1%) | 53 (15.3%) |
| 25 to 29 Minutes | 19 (9.6%) | 7 (2.0%) |
| 30 to 34 Minutes | 3 (1.5%) | 28 (8.1%) |
| 35 to 39 Minutes | 0 (0.0%) | 6 (1.7%) |
| 40 to 44 Minutes | 0 (0.0%) | 0 (0.0%) |
| 45 to 59 Minutes | 20 (10.1%) | 6 (1.7%) |
| 60 to 89 Minutes | 0 (0.0%) | 0 (0.0%) |
| 90 or more Minutes | 6 (3.0%) | 0 (0.0%) |
Time of Departure to Work by Sex in Cambria
The most frequent times of departure to work in Cambria are 7:30 AM to 7:59 AM (51, 25.6%) for males and 7:30 AM to 7:59 AM (95, 27.4%) for females.
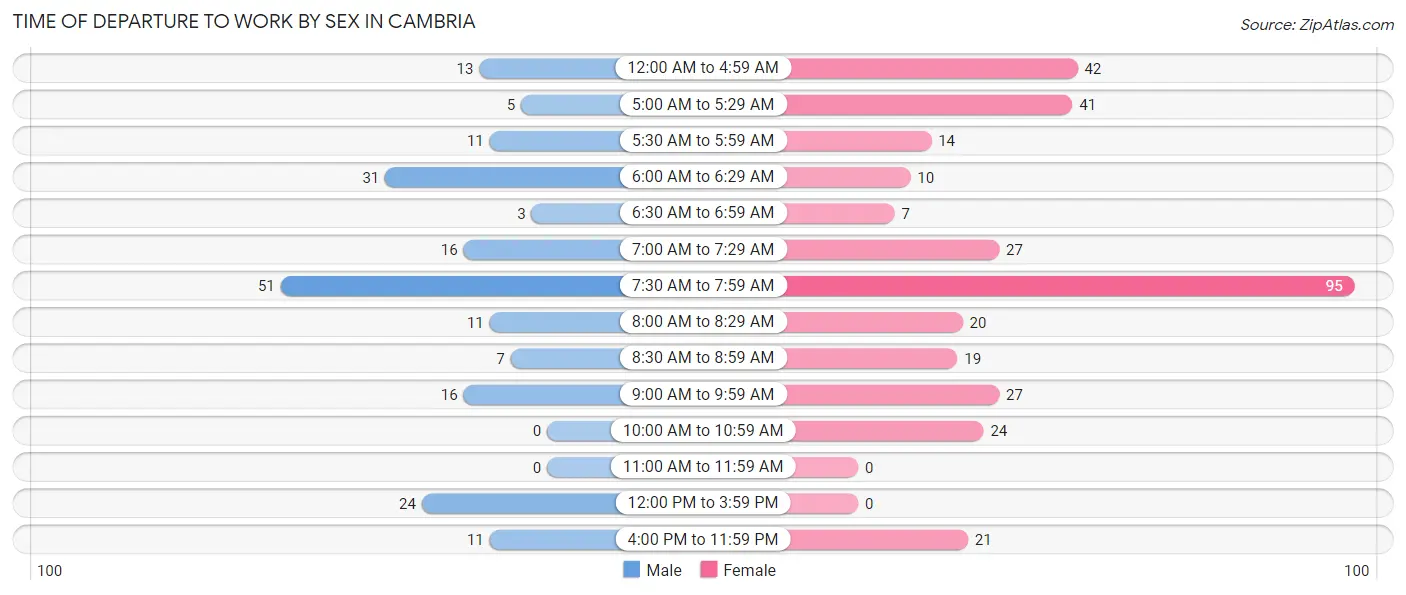
| Time of Departure | Male | Female |
| 12:00 AM to 4:59 AM | 13 (6.5%) | 42 (12.1%) |
| 5:00 AM to 5:29 AM | 5 (2.5%) | 41 (11.8%) |
| 5:30 AM to 5:59 AM | 11 (5.5%) | 14 (4.0%) |
| 6:00 AM to 6:29 AM | 31 (15.6%) | 10 (2.9%) |
| 6:30 AM to 6:59 AM | 3 (1.5%) | 7 (2.0%) |
| 7:00 AM to 7:29 AM | 16 (8.0%) | 27 (7.8%) |
| 7:30 AM to 7:59 AM | 51 (25.6%) | 95 (27.4%) |
| 8:00 AM to 8:29 AM | 11 (5.5%) | 20 (5.8%) |
| 8:30 AM to 8:59 AM | 7 (3.5%) | 19 (5.5%) |
| 9:00 AM to 9:59 AM | 16 (8.0%) | 27 (7.8%) |
| 10:00 AM to 10:59 AM | 0 (0.0%) | 24 (6.9%) |
| 11:00 AM to 11:59 AM | 0 (0.0%) | 0 (0.0%) |
| 12:00 PM to 3:59 PM | 24 (12.1%) | 0 (0.0%) |
| 4:00 PM to 11:59 PM | 11 (5.5%) | 21 (6.0%) |
| Total | 199 (100.0%) | 347 (100.0%) |
Housing Occupancy in Cambria
Occupancy by Ownership in Cambria
Of the total 634 dwellings in Cambria, owner-occupied units account for 265 (41.8%), while renter-occupied units make up 369 (58.2%).
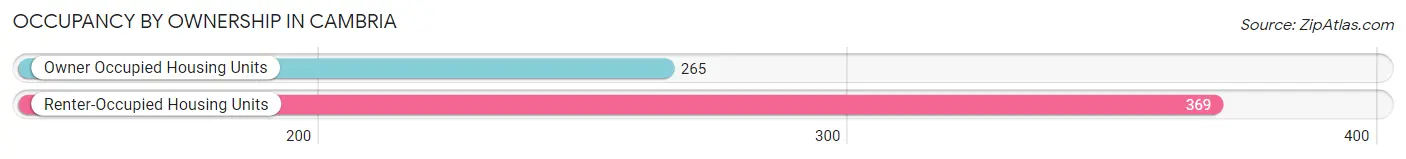
| Occupancy | # Housing Units | % Housing Units |
| Owner Occupied Housing Units | 265 | 41.8% |
| Renter-Occupied Housing Units | 369 | 58.2% |
| Total Occupied Housing Units | 634 | 100.0% |
Occupancy by Household Size in Cambria
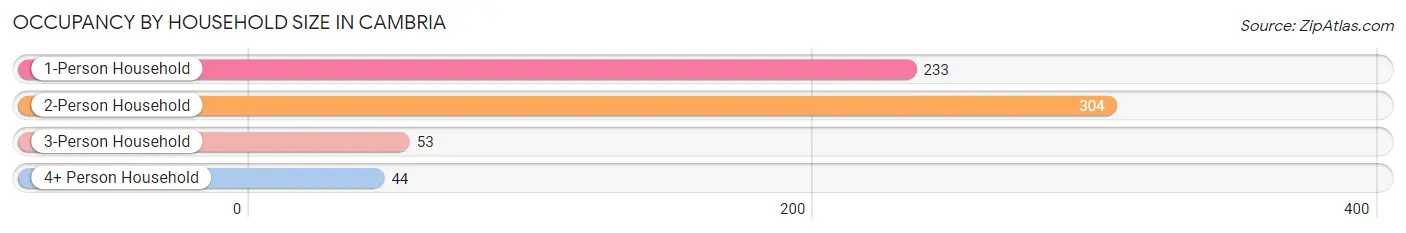
| Household Size | # Housing Units | % Housing Units |
| 1-Person Household | 233 | 36.7% |
| 2-Person Household | 304 | 47.9% |
| 3-Person Household | 53 | 8.4% |
| 4+ Person Household | 44 | 6.9% |
| Total Housing Units | 634 | 100.0% |
Occupancy by Ownership by Household Size in Cambria
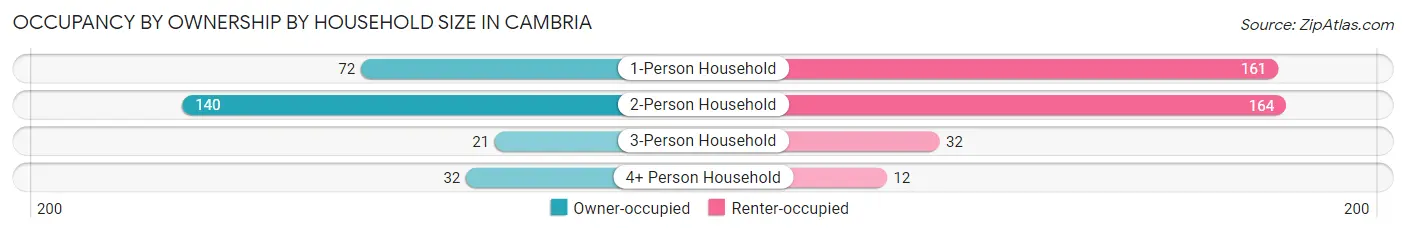
| Household Size | Owner-occupied | Renter-occupied |
| 1-Person Household | 72 (30.9%) | 161 (69.1%) |
| 2-Person Household | 140 (46.1%) | 164 (53.9%) |
| 3-Person Household | 21 (39.6%) | 32 (60.4%) |
| 4+ Person Household | 32 (72.7%) | 12 (27.3%) |
| Total Housing Units | 265 (41.8%) | 369 (58.2%) |
Occupancy by Educational Attainment in Cambria
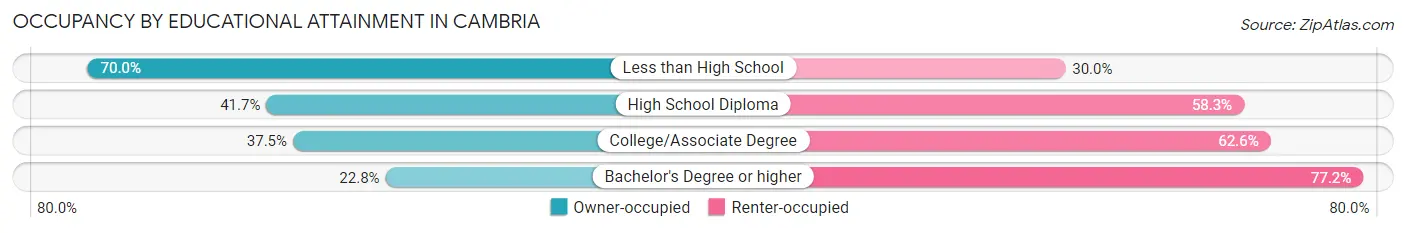
| Household Size | Owner-occupied | Renter-occupied |
| Less than High School | 77 (70.0%) | 33 (30.0%) |
| High School Diploma | 65 (41.7%) | 91 (58.3%) |
| College/Associate Degree | 100 (37.4%) | 167 (62.5%) |
| Bachelor's Degree or higher | 23 (22.8%) | 78 (77.2%) |
Occupancy by Age of Householder in Cambria
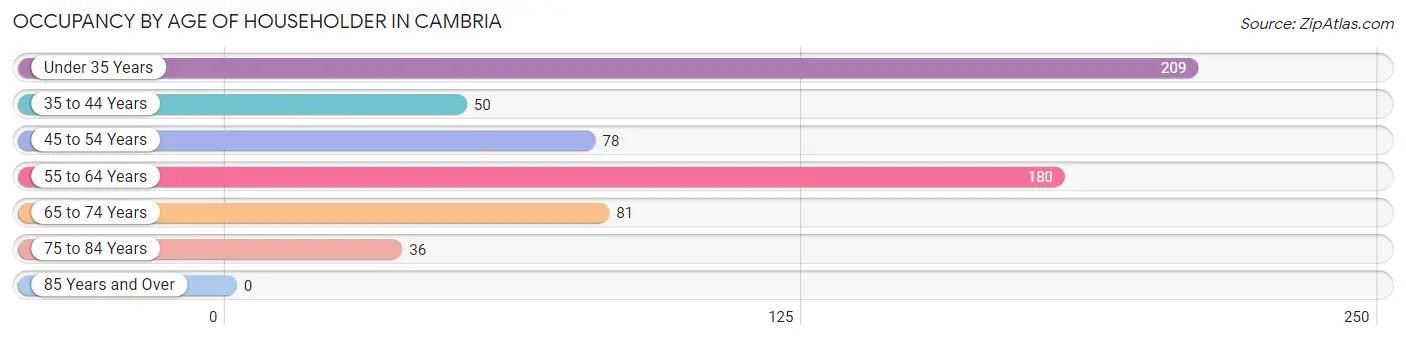
| Age Bracket | # Households | % Households |
| Under 35 Years | 209 | 33.0% |
| 35 to 44 Years | 50 | 7.9% |
| 45 to 54 Years | 78 | 12.3% |
| 55 to 64 Years | 180 | 28.4% |
| 65 to 74 Years | 81 | 12.8% |
| 75 to 84 Years | 36 | 5.7% |
| 85 Years and Over | 0 | 0.0% |
| Total | 634 | 100.0% |
Housing Finances in Cambria
Median Income by Occupancy in Cambria
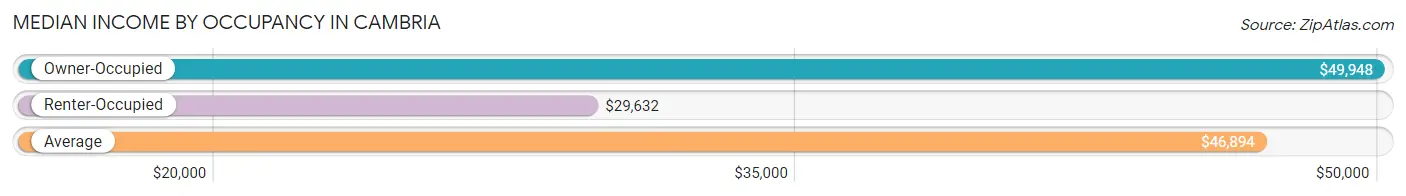
| Occupancy Type | # Households | Median Income |
| Owner-Occupied | 265 (41.8%) | $49,948 |
| Renter-Occupied | 369 (58.2%) | $29,632 |
| Average | 634 (100.0%) | $46,894 |
Occupancy by Householder Income Bracket in Cambria
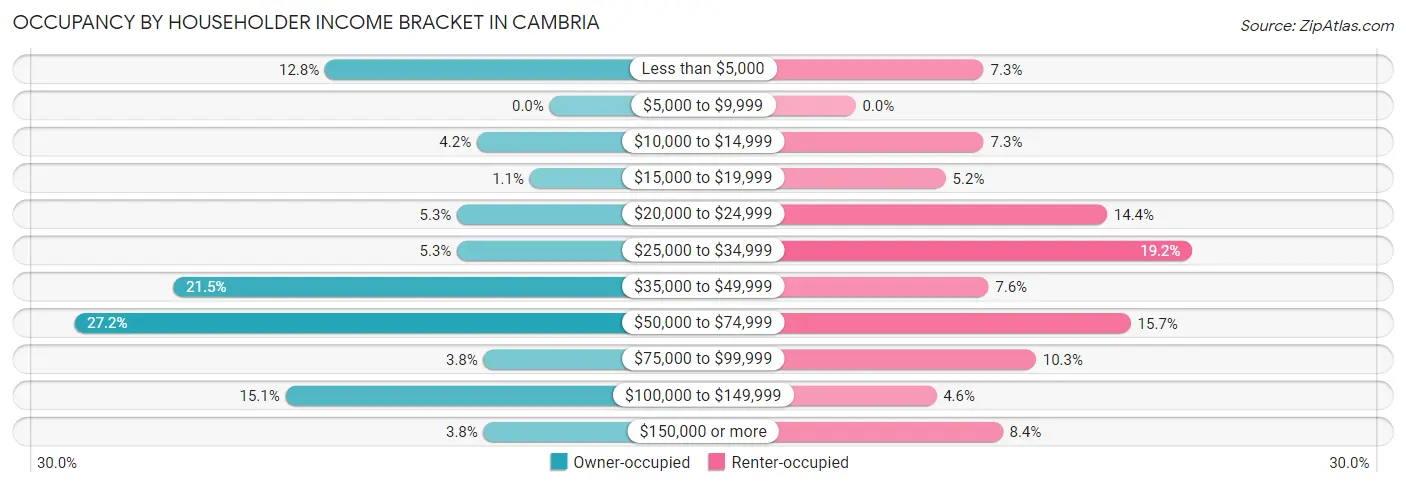
| Income Bracket | Owner-occupied | Renter-occupied |
| Less than $5,000 | 34 (12.8%) | 27 (7.3%) |
| $5,000 to $9,999 | 0 (0.0%) | 0 (0.0%) |
| $10,000 to $14,999 | 11 (4.2%) | 27 (7.3%) |
| $15,000 to $19,999 | 3 (1.1%) | 19 (5.1%) |
| $20,000 to $24,999 | 14 (5.3%) | 53 (14.4%) |
| $25,000 to $34,999 | 14 (5.3%) | 71 (19.2%) |
| $35,000 to $49,999 | 57 (21.5%) | 28 (7.6%) |
| $50,000 to $74,999 | 72 (27.2%) | 58 (15.7%) |
| $75,000 to $99,999 | 10 (3.8%) | 38 (10.3%) |
| $100,000 to $149,999 | 40 (15.1%) | 17 (4.6%) |
| $150,000 or more | 10 (3.8%) | 31 (8.4%) |
| Total | 265 (100.0%) | 369 (100.0%) |
Monthly Housing Cost Tiers in Cambria
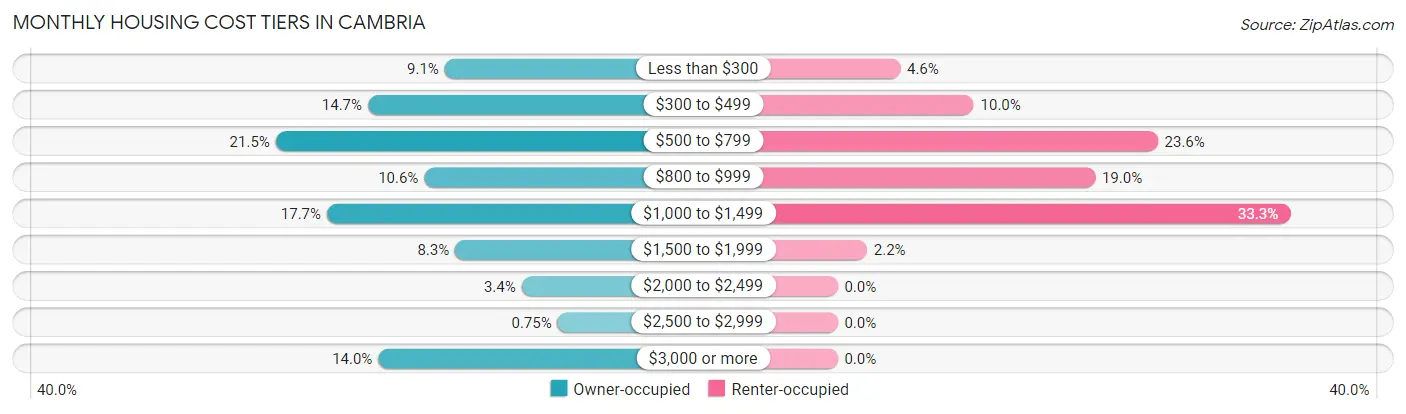
| Monthly Cost | Owner-occupied | Renter-occupied |
| Less than $300 | 24 (9.1%) | 17 (4.6%) |
| $300 to $499 | 39 (14.7%) | 37 (10.0%) |
| $500 to $799 | 57 (21.5%) | 87 (23.6%) |
| $800 to $999 | 28 (10.6%) | 70 (19.0%) |
| $1,000 to $1,499 | 47 (17.7%) | 123 (33.3%) |
| $1,500 to $1,999 | 22 (8.3%) | 8 (2.2%) |
| $2,000 to $2,499 | 9 (3.4%) | 0 (0.0%) |
| $2,500 to $2,999 | 2 (0.7%) | 0 (0.0%) |
| $3,000 or more | 37 (14.0%) | 0 (0.0%) |
| Total | 265 (100.0%) | 369 (100.0%) |
Physical Housing Characteristics in Cambria
Housing Structures in Cambria
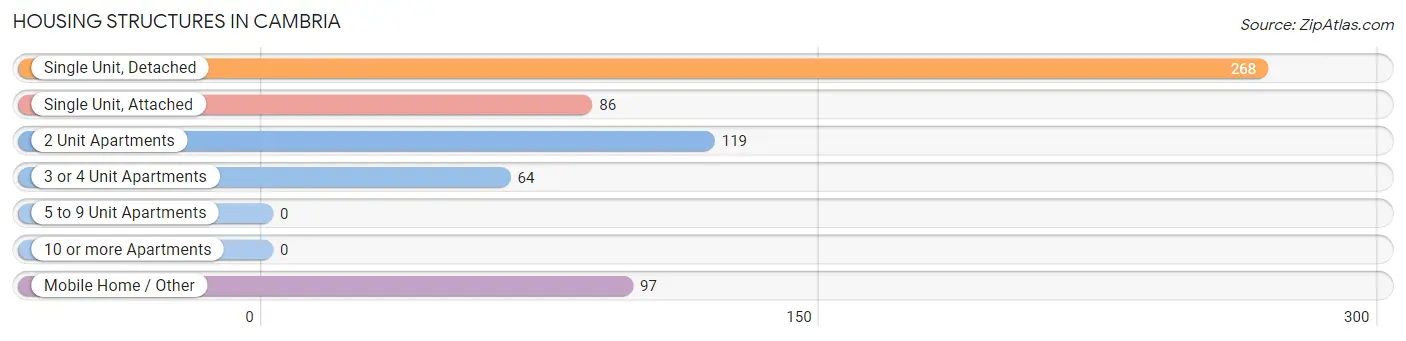
| Structure Type | # Housing Units | % Housing Units |
| Single Unit, Detached | 268 | 42.3% |
| Single Unit, Attached | 86 | 13.6% |
| 2 Unit Apartments | 119 | 18.8% |
| 3 or 4 Unit Apartments | 64 | 10.1% |
| 5 to 9 Unit Apartments | 0 | 0.0% |
| 10 or more Apartments | 0 | 0.0% |
| Mobile Home / Other | 97 | 15.3% |
| Total | 634 | 100.0% |
Housing Structures by Occupancy in Cambria
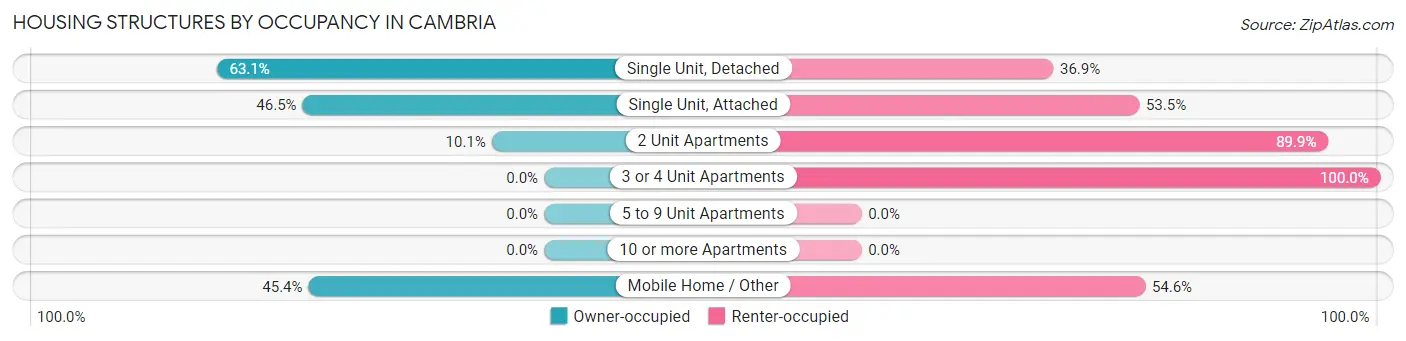
| Structure Type | Owner-occupied | Renter-occupied |
| Single Unit, Detached | 169 (63.1%) | 99 (36.9%) |
| Single Unit, Attached | 40 (46.5%) | 46 (53.5%) |
| 2 Unit Apartments | 12 (10.1%) | 107 (89.9%) |
| 3 or 4 Unit Apartments | 0 (0.0%) | 64 (100.0%) |
| 5 to 9 Unit Apartments | 0 (0.0%) | 0 (0.0%) |
| 10 or more Apartments | 0 (0.0%) | 0 (0.0%) |
| Mobile Home / Other | 44 (45.4%) | 53 (54.6%) |
| Total | 265 (41.8%) | 369 (58.2%) |
Housing Structures by Number of Rooms in Cambria
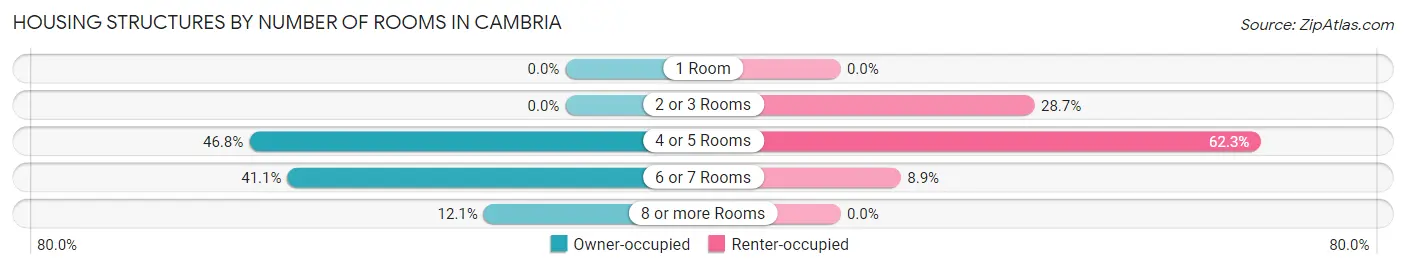
| Number of Rooms | Owner-occupied | Renter-occupied |
| 1 Room | 0 (0.0%) | 0 (0.0%) |
| 2 or 3 Rooms | 0 (0.0%) | 106 (28.7%) |
| 4 or 5 Rooms | 124 (46.8%) | 230 (62.3%) |
| 6 or 7 Rooms | 109 (41.1%) | 33 (8.9%) |
| 8 or more Rooms | 32 (12.1%) | 0 (0.0%) |
| Total | 265 (100.0%) | 369 (100.0%) |
Housing Structure by Heating Type in Cambria
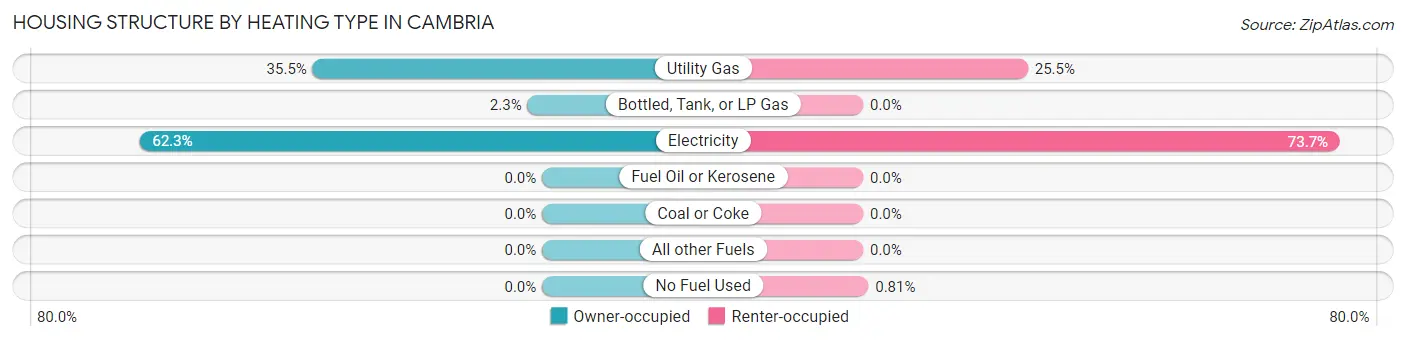
| Heating Type | Owner-occupied | Renter-occupied |
| Utility Gas | 94 (35.5%) | 94 (25.5%) |
| Bottled, Tank, or LP Gas | 6 (2.3%) | 0 (0.0%) |
| Electricity | 165 (62.3%) | 272 (73.7%) |
| Fuel Oil or Kerosene | 0 (0.0%) | 0 (0.0%) |
| Coal or Coke | 0 (0.0%) | 0 (0.0%) |
| All other Fuels | 0 (0.0%) | 0 (0.0%) |
| No Fuel Used | 0 (0.0%) | 3 (0.8%) |
| Total | 265 (100.0%) | 369 (100.0%) |
Household Vehicle Usage in Cambria
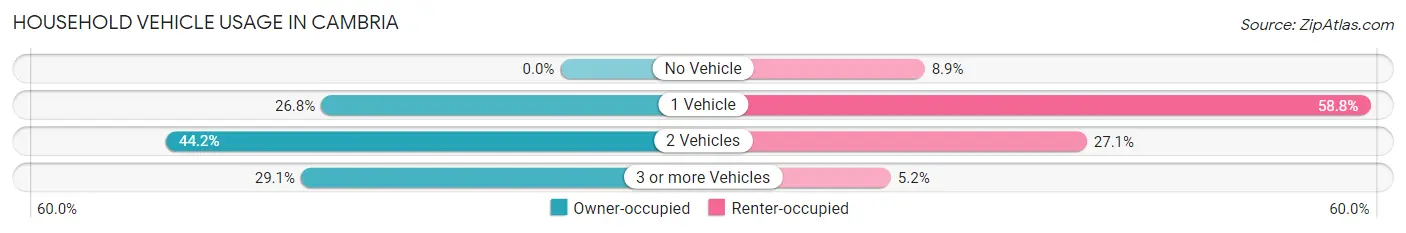
| Vehicles per Household | Owner-occupied | Renter-occupied |
| No Vehicle | 0 (0.0%) | 33 (8.9%) |
| 1 Vehicle | 71 (26.8%) | 217 (58.8%) |
| 2 Vehicles | 117 (44.2%) | 100 (27.1%) |
| 3 or more Vehicles | 77 (29.1%) | 19 (5.1%) |
| Total | 265 (100.0%) | 369 (100.0%) |
Real Estate & Mortgages in Cambria
Real Estate and Mortgage Overview in Cambria
| Characteristic | Without Mortgage | With Mortgage |
| Housing Units | 123 | 142 |
| Median Property Value | $80,400 | $225,900 |
| Median Household Income | $49,821 | $7 |
| Monthly Housing Costs | $524 | $37 |
| Real Estate Taxes | $1,250 | $5 |
Property Value by Mortgage Status in Cambria
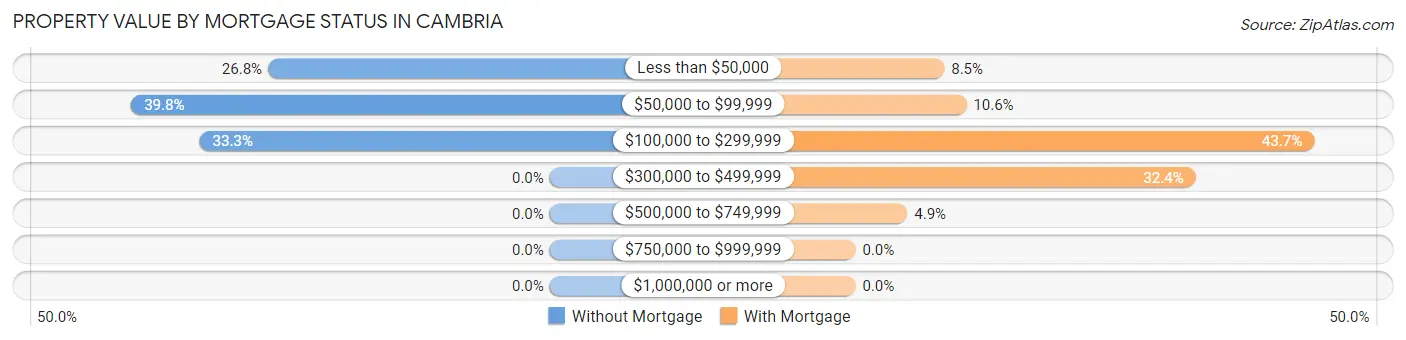
| Property Value | Without Mortgage | With Mortgage |
| Less than $50,000 | 33 (26.8%) | 12 (8.5%) |
| $50,000 to $99,999 | 49 (39.8%) | 15 (10.6%) |
| $100,000 to $299,999 | 41 (33.3%) | 62 (43.7%) |
| $300,000 to $499,999 | 0 (0.0%) | 46 (32.4%) |
| $500,000 to $749,999 | 0 (0.0%) | 7 (4.9%) |
| $750,000 to $999,999 | 0 (0.0%) | 0 (0.0%) |
| $1,000,000 or more | 0 (0.0%) | 0 (0.0%) |
| Total | 123 (100.0%) | 142 (100.0%) |
Household Income by Mortgage Status in Cambria
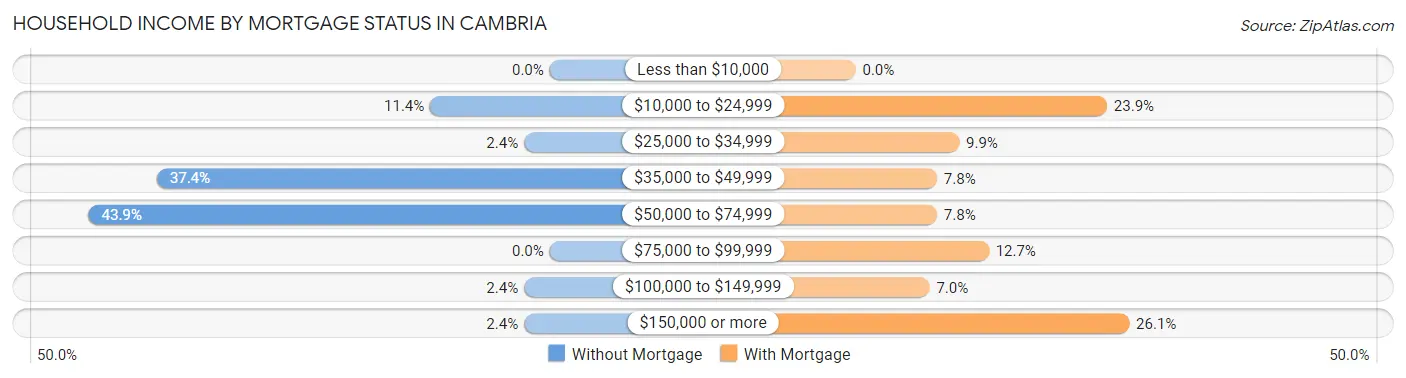
| Household Income | Without Mortgage | With Mortgage |
| Less than $10,000 | 0 (0.0%) | 0 (0.0%) |
| $10,000 to $24,999 | 14 (11.4%) | 34 (23.9%) |
| $25,000 to $34,999 | 3 (2.4%) | 14 (9.9%) |
| $35,000 to $49,999 | 46 (37.4%) | 11 (7.7%) |
| $50,000 to $74,999 | 54 (43.9%) | 11 (7.7%) |
| $75,000 to $99,999 | 0 (0.0%) | 18 (12.7%) |
| $100,000 to $149,999 | 3 (2.4%) | 10 (7.0%) |
| $150,000 or more | 3 (2.4%) | 37 (26.1%) |
| Total | 123 (100.0%) | 142 (100.0%) |
Property Value to Household Income Ratio in Cambria
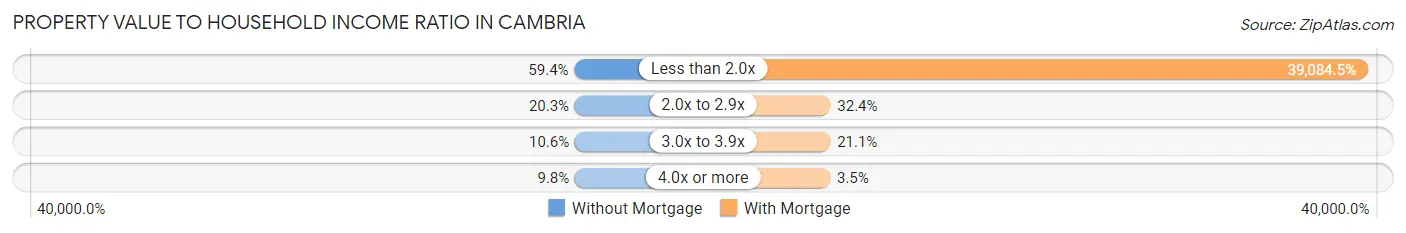
| Value-to-Income Ratio | Without Mortgage | With Mortgage |
| Less than 2.0x | 73 (59.4%) | 55,500 (39,084.5%) |
| 2.0x to 2.9x | 25 (20.3%) | 46 (32.4%) |
| 3.0x to 3.9x | 13 (10.6%) | 30 (21.1%) |
| 4.0x or more | 12 (9.8%) | 5 (3.5%) |
| Total | 123 (100.0%) | 142 (100.0%) |
Real Estate Taxes by Mortgage Status in Cambria
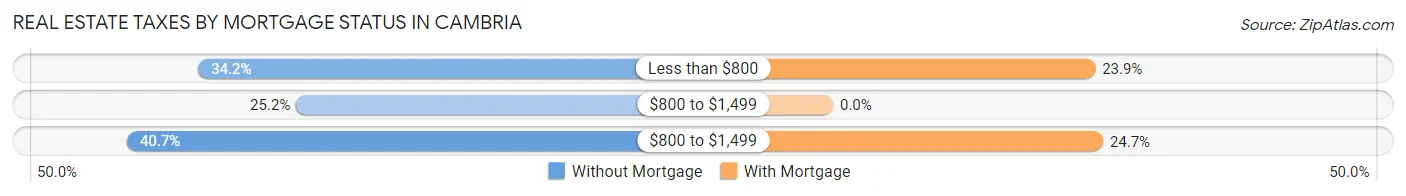
| Property Taxes | Without Mortgage | With Mortgage |
| Less than $800 | 42 (34.2%) | 34 (23.9%) |
| $800 to $1,499 | 31 (25.2%) | 0 (0.0%) |
| $800 to $1,499 | 50 (40.6%) | 35 (24.6%) |
| Total | 123 (100.0%) | 142 (100.0%) |
Health & Disability in Cambria
Health Insurance Coverage by Age in Cambria
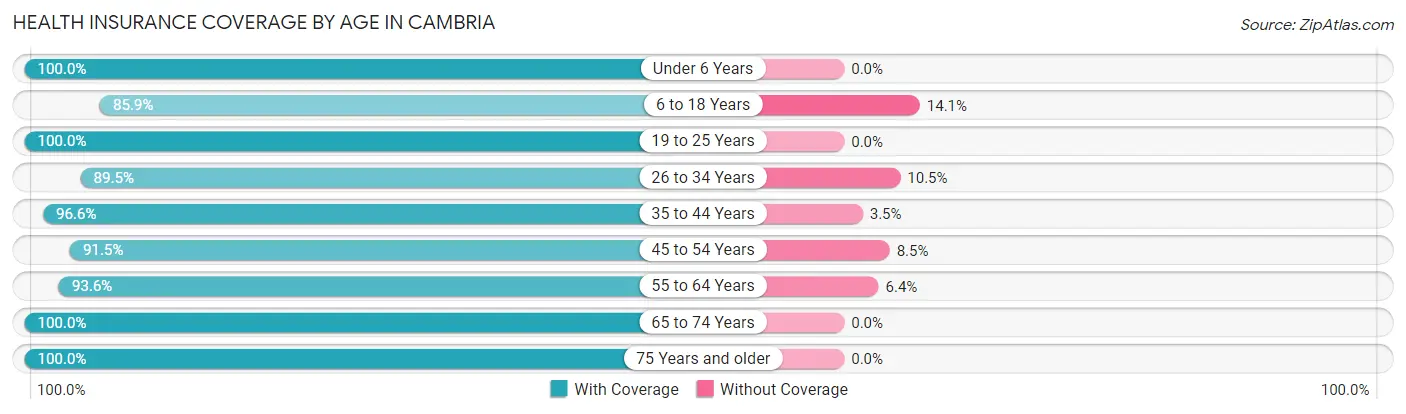
| Age Bracket | With Coverage | Without Coverage |
| Under 6 Years | 106 (100.0%) | 0 (0.0%) |
| 6 to 18 Years | 128 (85.9%) | 21 (14.1%) |
| 19 to 25 Years | 102 (100.0%) | 0 (0.0%) |
| 26 to 34 Years | 214 (89.5%) | 25 (10.5%) |
| 35 to 44 Years | 84 (96.6%) | 3 (3.5%) |
| 45 to 54 Years | 108 (91.5%) | 10 (8.5%) |
| 55 to 64 Years | 234 (93.6%) | 16 (6.4%) |
| 65 to 74 Years | 119 (100.0%) | 0 (0.0%) |
| 75 Years and older | 51 (100.0%) | 0 (0.0%) |
| Total | 1,146 (93.9%) | 75 (6.1%) |
Health Insurance Coverage by Citizenship Status in Cambria
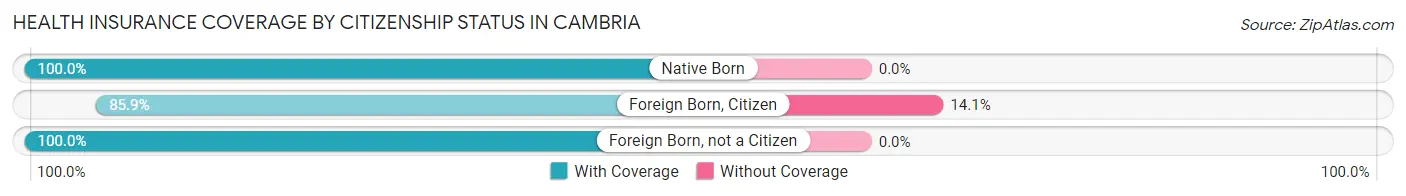
| Citizenship Status | With Coverage | Without Coverage |
| Native Born | 106 (100.0%) | 0 (0.0%) |
| Foreign Born, Citizen | 128 (85.9%) | 21 (14.1%) |
| Foreign Born, not a Citizen | 102 (100.0%) | 0 (0.0%) |
Health Insurance Coverage by Household Income in Cambria
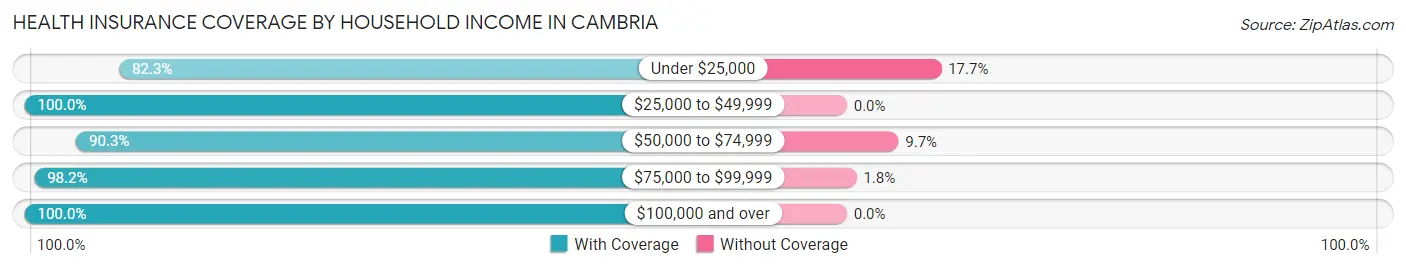
| Household Income | With Coverage | Without Coverage |
| Under $25,000 | 228 (82.3%) | 49 (17.7%) |
| $25,000 to $49,999 | 287 (100.0%) | 0 (0.0%) |
| $50,000 to $74,999 | 215 (90.3%) | 23 (9.7%) |
| $75,000 to $99,999 | 163 (98.2%) | 3 (1.8%) |
| $100,000 and over | 253 (100.0%) | 0 (0.0%) |
Public vs Private Health Insurance Coverage by Age in Cambria
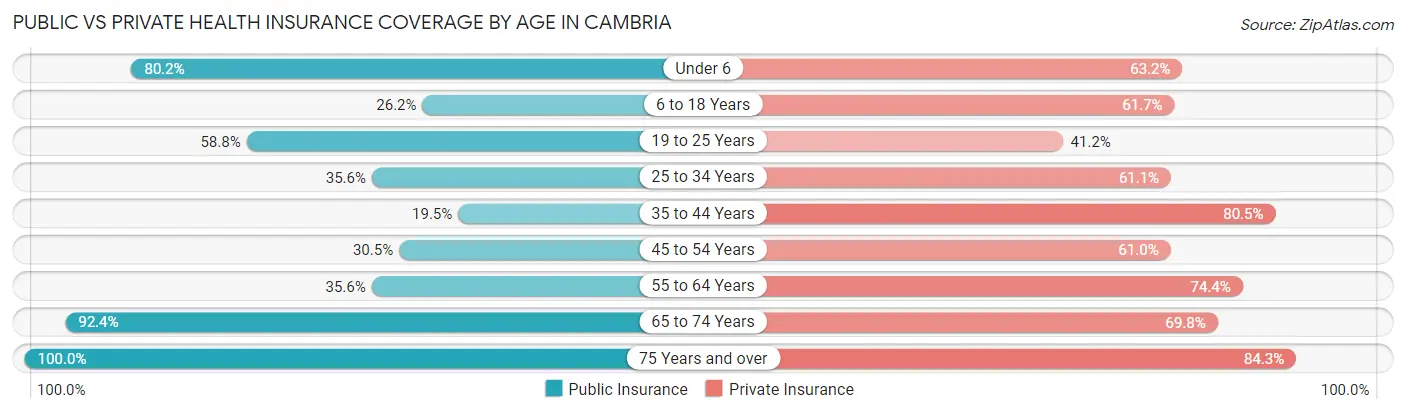
| Age Bracket | Public Insurance | Private Insurance |
| Under 6 | 85 (80.2%) | 67 (63.2%) |
| 6 to 18 Years | 39 (26.2%) | 92 (61.7%) |
| 19 to 25 Years | 60 (58.8%) | 42 (41.2%) |
| 25 to 34 Years | 85 (35.6%) | 146 (61.1%) |
| 35 to 44 Years | 17 (19.5%) | 70 (80.5%) |
| 45 to 54 Years | 36 (30.5%) | 72 (61.0%) |
| 55 to 64 Years | 89 (35.6%) | 186 (74.4%) |
| 65 to 74 Years | 110 (92.4%) | 83 (69.8%) |
| 75 Years and over | 51 (100.0%) | 43 (84.3%) |
| Total | 572 (46.9%) | 801 (65.6%) |
Disability Status by Sex by Age in Cambria
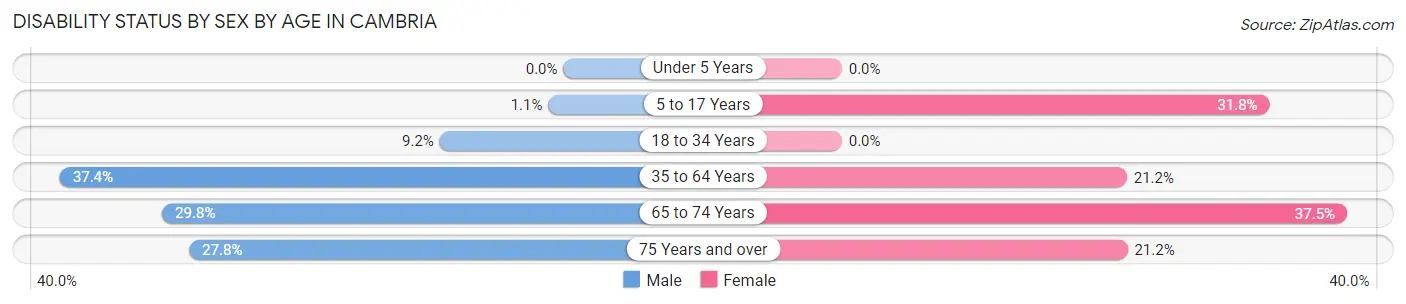
| Age Bracket | Male | Female |
| Under 5 Years | 0 (0.0%) | 0 (0.0%) |
| 5 to 17 Years | 1 (1.1%) | 20 (31.8%) |
| 18 to 34 Years | 9 (9.2%) | 0 (0.0%) |
| 35 to 64 Years | 80 (37.4%) | 51 (21.2%) |
| 65 to 74 Years | 14 (29.8%) | 27 (37.5%) |
| 75 Years and over | 5 (27.8%) | 7 (21.2%) |
Disability Class by Sex by Age in Cambria
Disability Class: Hearing Difficulty
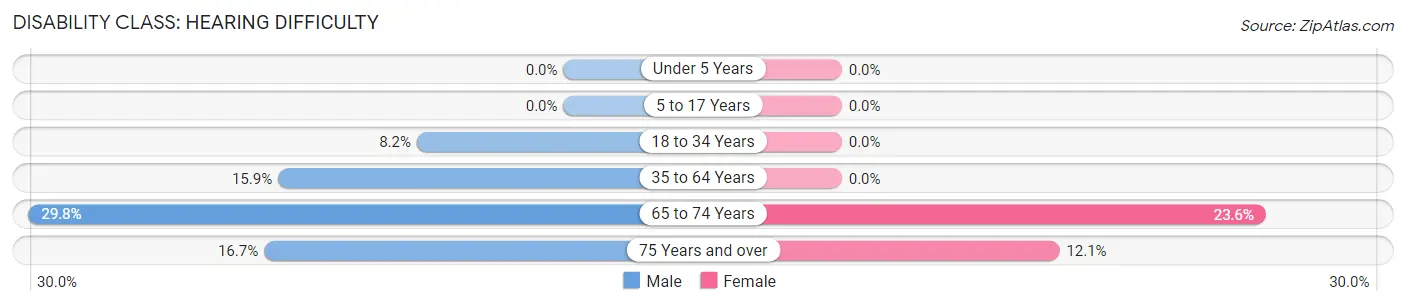
| Age Bracket | Male | Female |
| Under 5 Years | 0 (0.0%) | 0 (0.0%) |
| 5 to 17 Years | 0 (0.0%) | 0 (0.0%) |
| 18 to 34 Years | 8 (8.2%) | 0 (0.0%) |
| 35 to 64 Years | 34 (15.9%) | 0 (0.0%) |
| 65 to 74 Years | 14 (29.8%) | 17 (23.6%) |
| 75 Years and over | 3 (16.7%) | 4 (12.1%) |
Disability Class: Vision Difficulty
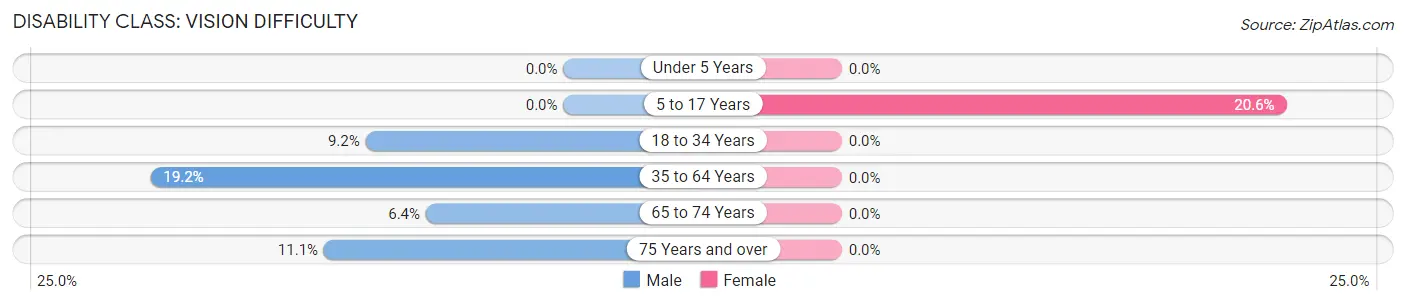
| Age Bracket | Male | Female |
| Under 5 Years | 0 (0.0%) | 0 (0.0%) |
| 5 to 17 Years | 0 (0.0%) | 13 (20.6%) |
| 18 to 34 Years | 9 (9.2%) | 0 (0.0%) |
| 35 to 64 Years | 41 (19.2%) | 0 (0.0%) |
| 65 to 74 Years | 3 (6.4%) | 0 (0.0%) |
| 75 Years and over | 2 (11.1%) | 0 (0.0%) |
Disability Class: Cognitive Difficulty
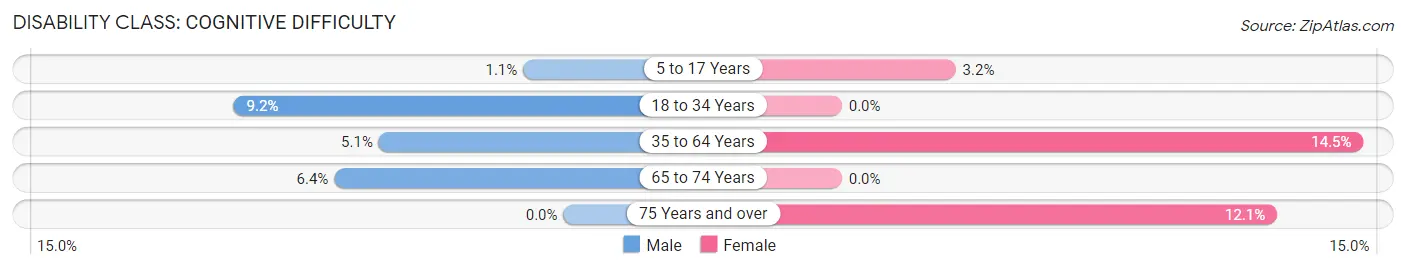
| Age Bracket | Male | Female |
| 5 to 17 Years | 1 (1.1%) | 2 (3.2%) |
| 18 to 34 Years | 9 (9.2%) | 0 (0.0%) |
| 35 to 64 Years | 11 (5.1%) | 35 (14.5%) |
| 65 to 74 Years | 3 (6.4%) | 0 (0.0%) |
| 75 Years and over | 0 (0.0%) | 4 (12.1%) |
Disability Class: Ambulatory Difficulty
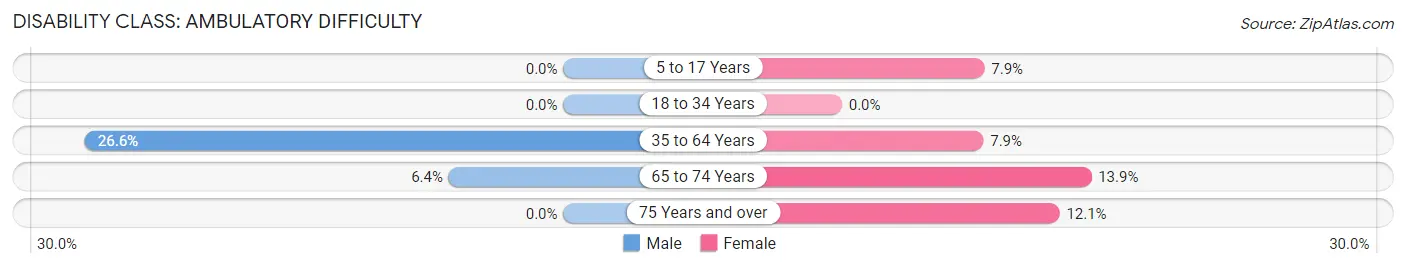
| Age Bracket | Male | Female |
| 5 to 17 Years | 0 (0.0%) | 5 (7.9%) |
| 18 to 34 Years | 0 (0.0%) | 0 (0.0%) |
| 35 to 64 Years | 57 (26.6%) | 19 (7.9%) |
| 65 to 74 Years | 3 (6.4%) | 10 (13.9%) |
| 75 Years and over | 0 (0.0%) | 4 (12.1%) |
Disability Class: Self-Care Difficulty
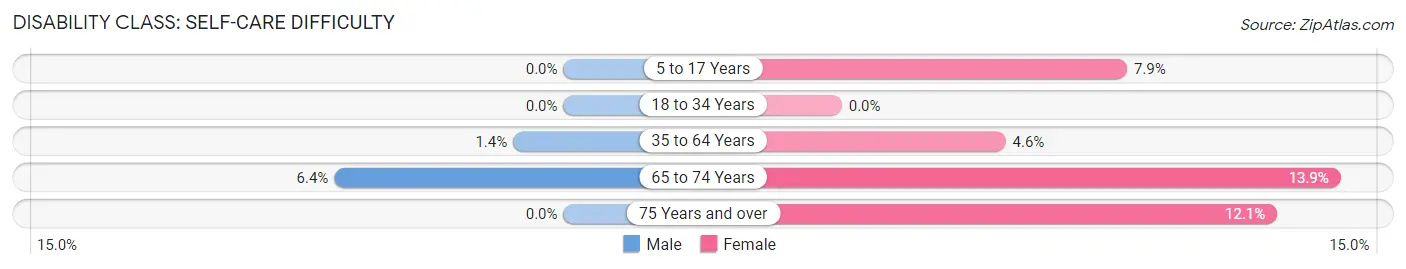
| Age Bracket | Male | Female |
| 5 to 17 Years | 0 (0.0%) | 5 (7.9%) |
| 18 to 34 Years | 0 (0.0%) | 0 (0.0%) |
| 35 to 64 Years | 3 (1.4%) | 11 (4.6%) |
| 65 to 74 Years | 3 (6.4%) | 10 (13.9%) |
| 75 Years and over | 0 (0.0%) | 4 (12.1%) |
Technology Access in Cambria
Computing Device Access in Cambria
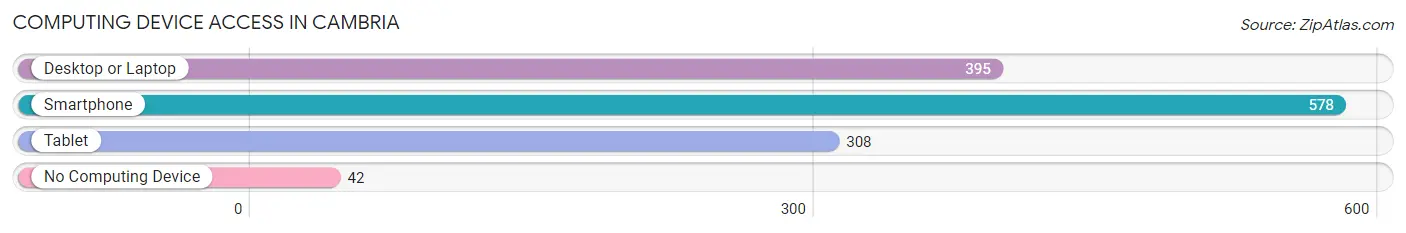
| Device Type | # Households | % Households |
| Desktop or Laptop | 395 | 62.3% |
| Smartphone | 578 | 91.2% |
| Tablet | 308 | 48.6% |
| No Computing Device | 42 | 6.6% |
| Total | 634 | 100.0% |
Internet Access in Cambria
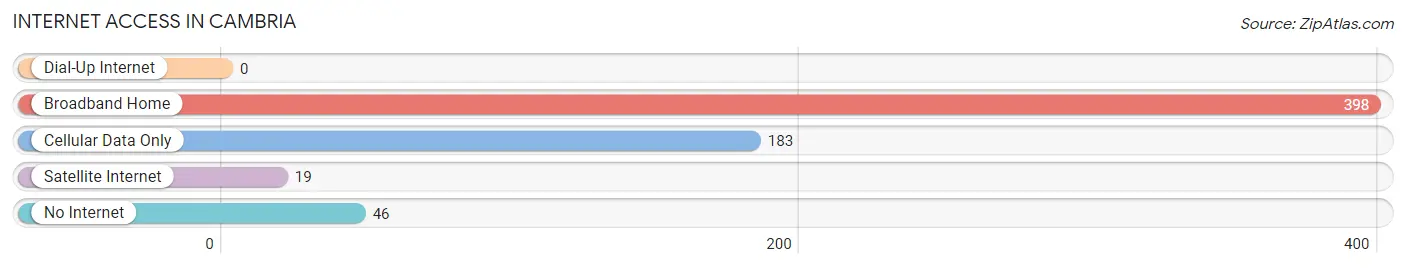
| Internet Type | # Households | % Households |
| Dial-Up Internet | 0 | 0.0% |
| Broadband Home | 398 | 62.8% |
| Cellular Data Only | 183 | 28.9% |
| Satellite Internet | 19 | 3.0% |
| No Internet | 46 | 7.3% |
| Total | 634 | 100.0% |
Cambria Summary
Cambria is a small village located in the state of Illinois, in the United States. It is situated in the county of Macoupin, and is part of the St. Louis Metropolitan Statistical Area. The village has a population of approximately 1,000 people, and is located about 25 miles south of Springfield, the state capital.
History
Cambria was founded in 1854 by a group of settlers from the nearby town of Carlinville. The settlers were looking for a place to settle and start a new life, and they chose the area that is now Cambria. The village was named after the Cambrian period, which is a period of geological time. The first settlers built a log cabin and a small store, and the village quickly grew. By the late 1800s, Cambria had become a thriving community, with a post office, a school, a church, and several businesses.
Geography
Cambria is located in the central part of Macoupin County, in the state of Illinois. It is situated about 25 miles south of Springfield, the state capital. The village is located in a rural area, and is surrounded by farmland and rolling hills. The nearest major city is St. Louis, which is about 90 miles away. The village is located on the banks of the Macoupin Creek, which is a tributary of the Illinois River.
Economy
Cambria’s economy is largely based on agriculture. The village is surrounded by farmland, and many of the residents are involved in farming and related activities. The village also has several small businesses, including a grocery store, a hardware store, and a few restaurants. The village also has a post office, a bank, and a few other services.
Demographics
As of the 2010 census, Cambria had a population of 1,000 people. The racial makeup of the village was 97.2% White, 0.7% African American, 0.3% Native American, 0.2% Asian, and 1.6% from other races. The median household income was $41,250, and the median family income was $48,750. The per capita income was $19,845.
Cambria is a small village with a rich history and a strong sense of community. The village is surrounded by farmland, and the economy is largely based on agriculture. The village has a population of 1,000 people, and the racial makeup is predominantly White. The median household income is $41,250, and the per capita income is $19,845.
Common Questions
What is Per Capita Income in Cambria?
Per Capita income in Cambria is $33,665.
What is the Median Family Income in Cambria?
Median Family Income in Cambria is $47,104.
What is the Median Household income in Cambria?
Median Household Income in Cambria is $46,894.
What is Income or Wage Gap in Cambria?
Income or Wage Gap in Cambria is 31.5%.
Women in Cambria earn 68.5 cents for every dollar earned by a man.
What is Inequality or Gini Index in Cambria?
Inequality or Gini Index in Cambria is 0.51.
What is the Total Population of Cambria?
Total Population of Cambria is 1,231.
What is the Total Male Population of Cambria?
Total Male Population of Cambria is 520.
What is the Total Female Population of Cambria?
Total Female Population of Cambria is 711.
What is the Ratio of Males per 100 Females in Cambria?
There are 73.14 Males per 100 Females in Cambria.
What is the Ratio of Females per 100 Males in Cambria?
There are 136.73 Females per 100 Males in Cambria.
What is the Median Population Age in Cambria?
Median Population Age in Cambria is 35.4 Years.
What is the Average Family Size in Cambria
Average Family Size in Cambria is 2.4 People.
What is the Average Household Size in Cambria
Average Household Size in Cambria is 1.9 People.
How Large is the Labor Force in Cambria?
There are 628 People in the Labor Forcein in Cambria.
What is the Percentage of People in the Labor Force in Cambria?
62.2% of People are in the Labor Force in Cambria.
What is the Unemployment Rate in Cambria?
Unemployment Rate in Cambria is 5.5%.