Mound City, IL Map & Demographics
Mound City Map
Mound City Overview
$20,221
PER CAPITA INCOME
$61,875
AVG FAMILY INCOME
$37,500
AVG HOUSEHOLD INCOME
$11,564
FAMILY INCOME DEFICIT
0.46
INEQUALITY / GINI INDEX
798
TOTAL POPULATION
457
MALE POPULATION
341
FEMALE POPULATION
134.02
MALES / 100 FEMALES
74.62
FEMALES / 100 MALES
39.3
MEDIAN AGE
4.4
AVG FAMILY SIZE
3.4
AVG HOUSEHOLD SIZE
312
LABOR FORCE [ PEOPLE ]
53.0%
PERCENT IN LABOR FORCE
3.8%
UNEMPLOYMENT RATE
Mound City Zip Codes
Mound City Area Codes
Income in Mound City
Income Overview in Mound City
Per Capita Income in Mound City is $20,221, while median incomes of families and households are $61,875 and $37,500 respectively.
| Characteristic | Number | Measure |
| Per Capita Income | 798 | $20,221 |
| Median Family Income | 155 | $61,875 |
| Mean Family Income | 155 | $61,779 |
| Median Household Income | 232 | $37,500 |
| Mean Household Income | 232 | $51,819 |
| Income Deficit | 155 | $11,564 |
| Wage / Income Gap (%) | 798 | 0.00% |
| Wage / Income Gap ($) | 798 | 100.00¢ per $1 |
| Gini / Inequality Index | 798 | 0.46 |
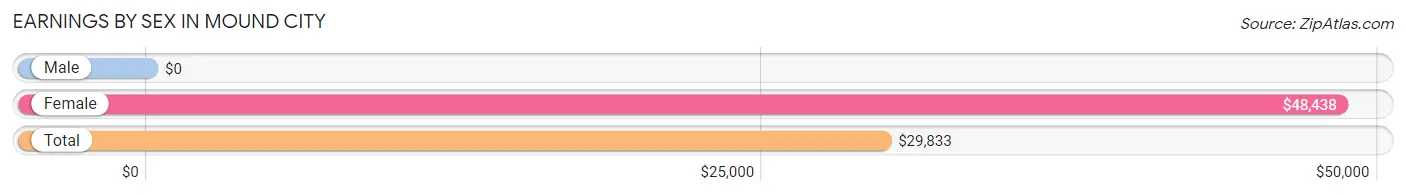
Earnings by Sex in Mound City
| Sex | Number | Average Earnings |
| Male | 204 (68.0%) | $0 |
| Female | 96 (32.0%) | $48,438 |
| Total | 300 (100.0%) | $29,833 |
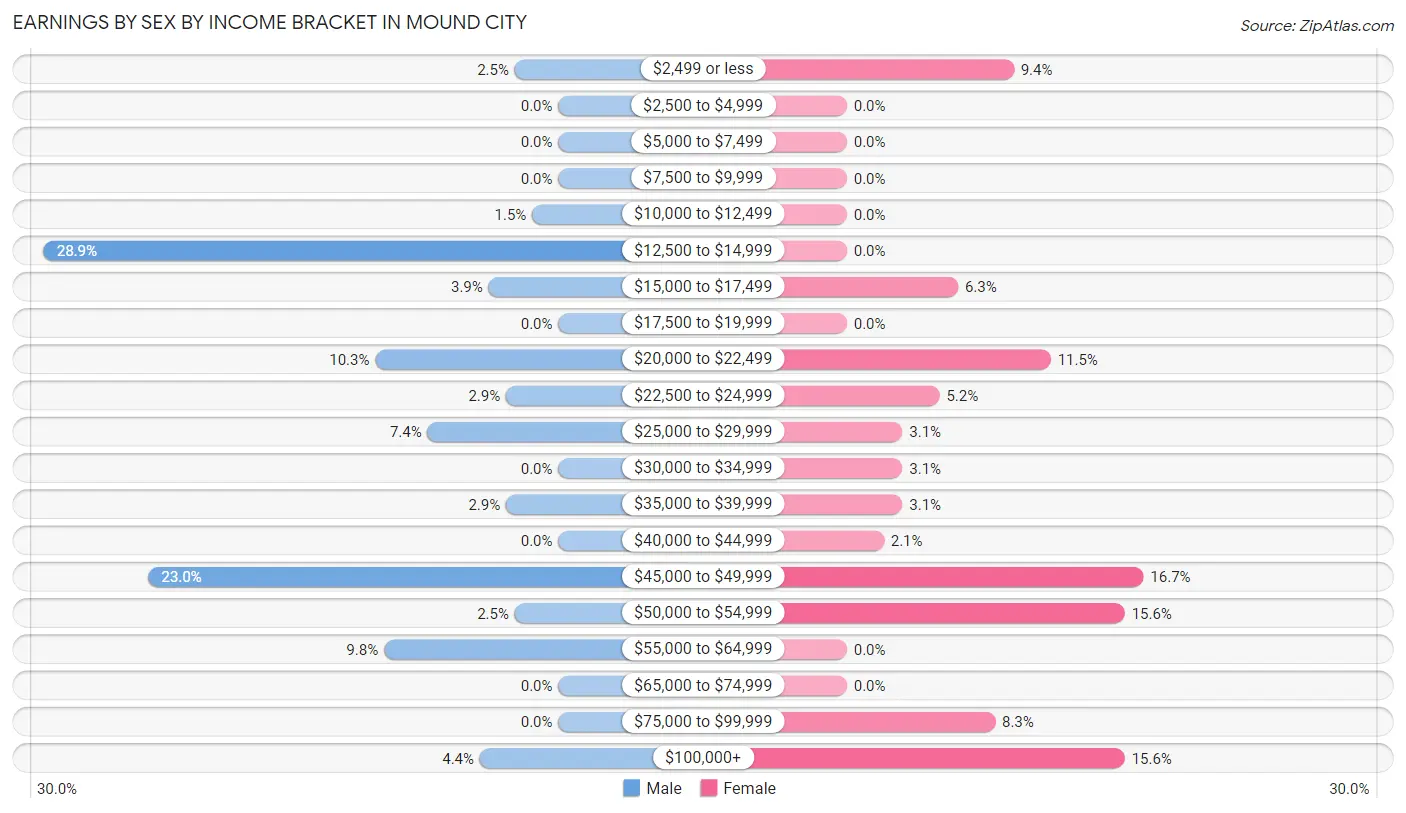
Earnings by Sex by Income Bracket in Mound City
The most common earnings brackets in Mound City are $12,500 to $14,999 for men (59 | 28.9%) and $45,000 to $49,999 for women (16 | 16.7%).
| Income | Male | Female |
| $2,499 or less | 5 (2.5%) | 9 (9.4%) |
| $2,500 to $4,999 | 0 (0.0%) | 0 (0.0%) |
| $5,000 to $7,499 | 0 (0.0%) | 0 (0.0%) |
| $7,500 to $9,999 | 0 (0.0%) | 0 (0.0%) |
| $10,000 to $12,499 | 3 (1.5%) | 0 (0.0%) |
| $12,500 to $14,999 | 59 (28.9%) | 0 (0.0%) |
| $15,000 to $17,499 | 8 (3.9%) | 6 (6.2%) |
| $17,500 to $19,999 | 0 (0.0%) | 0 (0.0%) |
| $20,000 to $22,499 | 21 (10.3%) | 11 (11.5%) |
| $22,500 to $24,999 | 6 (2.9%) | 5 (5.2%) |
| $25,000 to $29,999 | 15 (7.3%) | 3 (3.1%) |
| $30,000 to $34,999 | 0 (0.0%) | 3 (3.1%) |
| $35,000 to $39,999 | 6 (2.9%) | 3 (3.1%) |
| $40,000 to $44,999 | 0 (0.0%) | 2 (2.1%) |
| $45,000 to $49,999 | 47 (23.0%) | 16 (16.7%) |
| $50,000 to $54,999 | 5 (2.5%) | 15 (15.6%) |
| $55,000 to $64,999 | 20 (9.8%) | 0 (0.0%) |
| $65,000 to $74,999 | 0 (0.0%) | 0 (0.0%) |
| $75,000 to $99,999 | 0 (0.0%) | 8 (8.3%) |
| $100,000+ | 9 (4.4%) | 15 (15.6%) |
| Total | 204 (100.0%) | 96 (100.0%) |
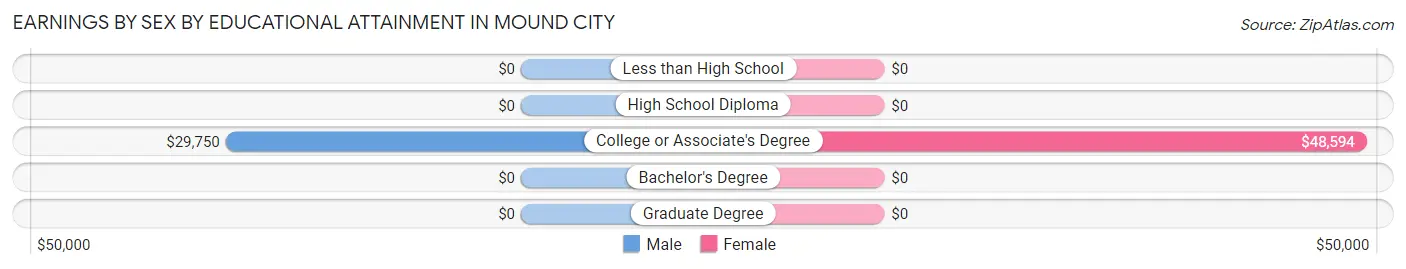
Earnings by Sex by Educational Attainment in Mound City
| Educational Attainment | Male Income | Female Income |
| Less than High School | - | - |
| High School Diploma | - | - |
| College or Associate's Degree | $29,750 | $48,594 |
| Bachelor's Degree | - | - |
| Graduate Degree | - | - |
| Total | - | - |
Family Income in Mound City
Family Income Brackets in Mound City
According to the Mound City family income data, there are 33 families falling into the $100,000 to $149,999 income range, which is the most common income bracket and makes up 21.3% of all families.
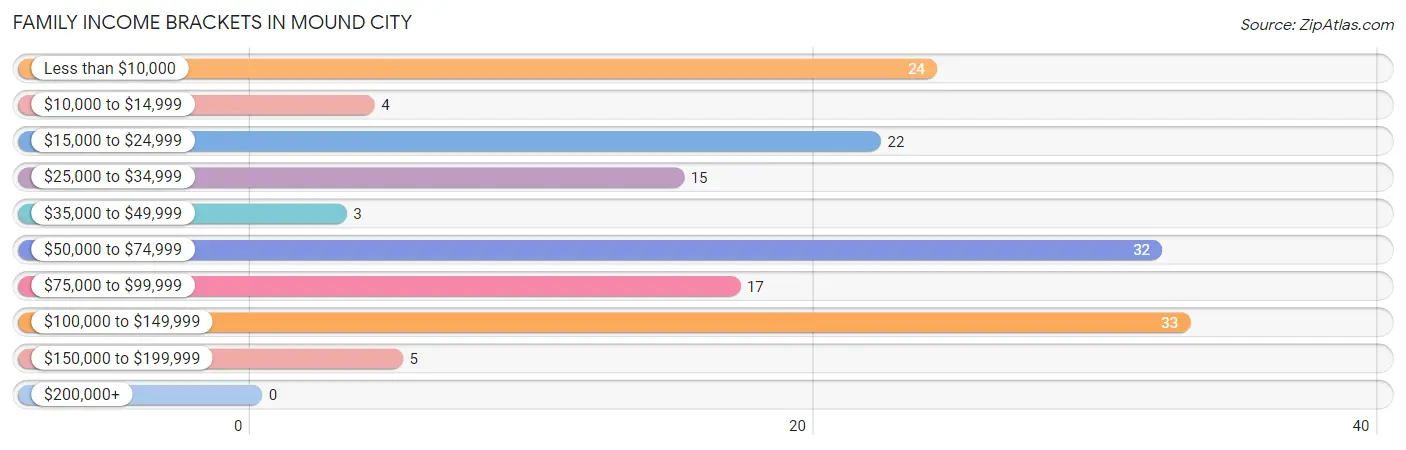
| Income Bracket | # Families | % Families |
| Less than $10,000 | 24 | 15.5% |
| $10,000 to $14,999 | 4 | 2.6% |
| $15,000 to $24,999 | 22 | 14.2% |
| $25,000 to $34,999 | 15 | 9.7% |
| $35,000 to $49,999 | 3 | 1.9% |
| $50,000 to $74,999 | 32 | 20.6% |
| $75,000 to $99,999 | 17 | 11.0% |
| $100,000 to $149,999 | 33 | 21.3% |
| $150,000 to $199,999 | 5 | 3.2% |
| $200,000+ | 0 | 0.0% |
Family Income by Famaliy Size in Mound City
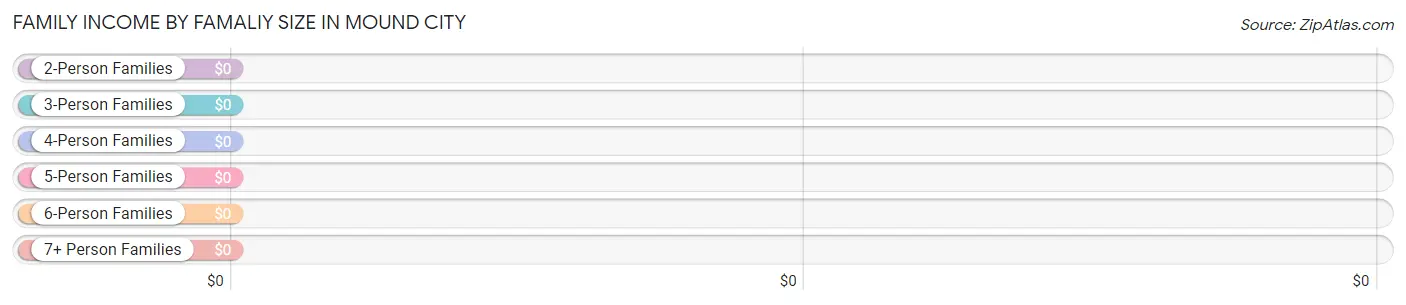
| Income Bracket | # Families | Median Income |
| 2-Person Families | 72 (46.5%) | $0 |
| 3-Person Families | 36 (23.2%) | $0 |
| 4-Person Families | 26 (16.8%) | $0 |
| 5-Person Families | 18 (11.6%) | $0 |
| 6-Person Families | 3 (1.9%) | $0 |
| 7+ Person Families | 0 (0.0%) | $0 |
| Total | 155 (100.0%) | $61,875 |
Family Income by Number of Earners in Mound City
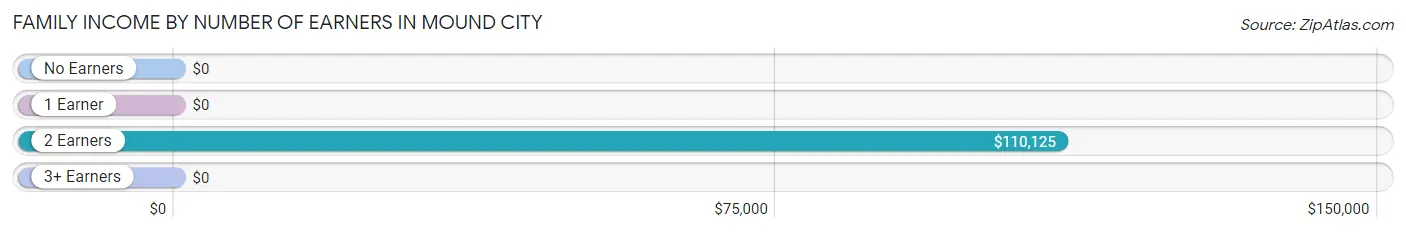
| Number of Earners | # Families | Median Income |
| No Earners | 46 (29.7%) | $0 |
| 1 Earner | 48 (31.0%) | $0 |
| 2 Earners | 59 (38.1%) | $110,125 |
| 3+ Earners | 2 (1.3%) | $0 |
| Total | 155 (100.0%) | $61,875 |
Household Income in Mound City
Household Income Brackets in Mound City
With 40 households falling in the category, the $50,000 to $74,999 income range is the most frequent in Mound City, accounting for 17.2% of all households.
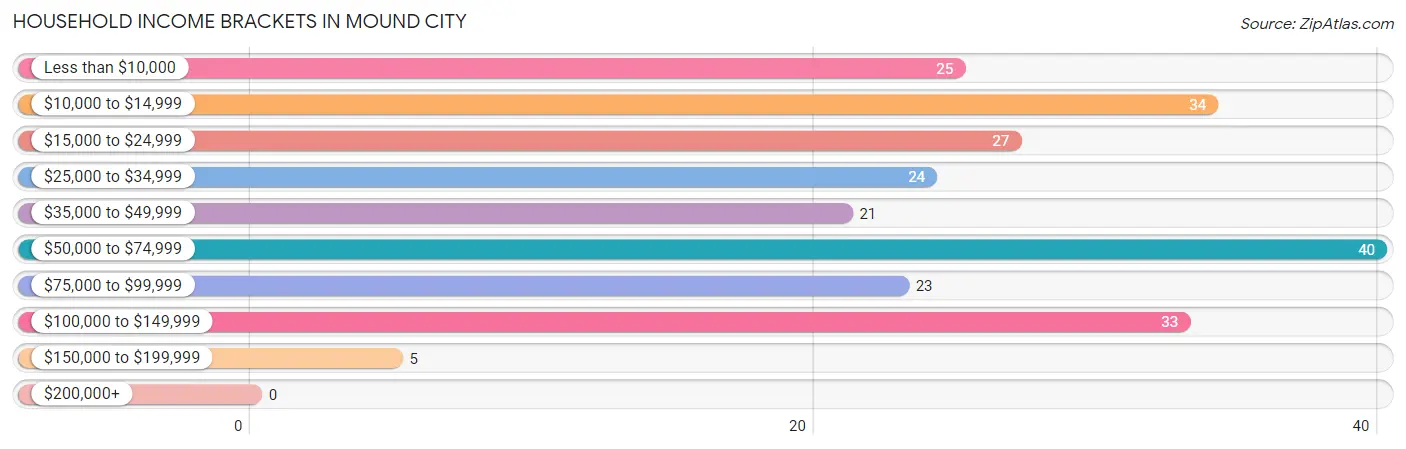
| Income Bracket | # Households | % Households |
| Less than $10,000 | 25 | 10.8% |
| $10,000 to $14,999 | 34 | 14.7% |
| $15,000 to $24,999 | 27 | 11.6% |
| $25,000 to $34,999 | 24 | 10.3% |
| $35,000 to $49,999 | 21 | 9.1% |
| $50,000 to $74,999 | 40 | 17.2% |
| $75,000 to $99,999 | 23 | 9.9% |
| $100,000 to $149,999 | 33 | 14.2% |
| $150,000 to $199,999 | 5 | 2.2% |
| $200,000+ | 0 | 0.0% |
Household Income by Householder Age in Mound City
The median household income in Mound City is $37,500, with the highest median household income of $70,234 found in the 25 to 44 years age bracket for the primary householder. A total of 67 households (28.9%) fall into this category. Meanwhile, the 15 to 24 years age bracket for the primary householder has the lowest median household income of $0, with 1 households (0.4%) in this group.
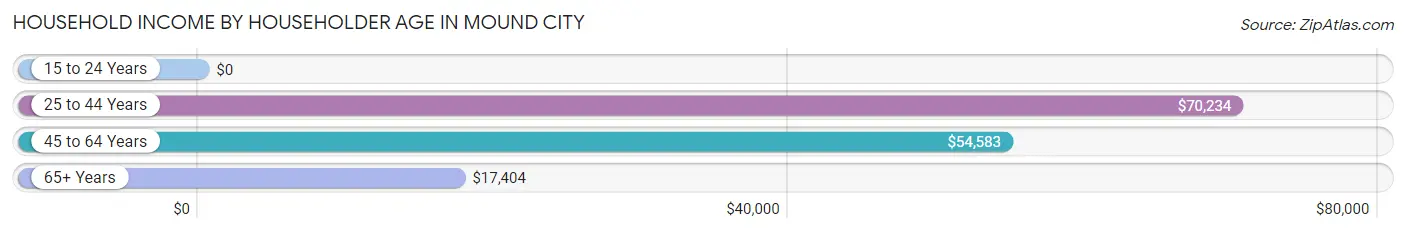
| Income Bracket | # Households | Median Income |
| 15 to 24 Years | 1 (0.4%) | $0 |
| 25 to 44 Years | 67 (28.9%) | $70,234 |
| 45 to 64 Years | 93 (40.1%) | $54,583 |
| 65+ Years | 71 (30.6%) | $17,404 |
| Total | 232 (100.0%) | $37,500 |
Poverty in Mound City
Income Below Poverty by Sex and Age in Mound City
With 12.9% poverty level for males and 25.8% for females among the residents of Mound City, 6 to 11 year old males and under 5 year old females are the most vulnerable to poverty, with 8 males (100.0%) and 6 females (100.0%) in their respective age groups living below the poverty level.
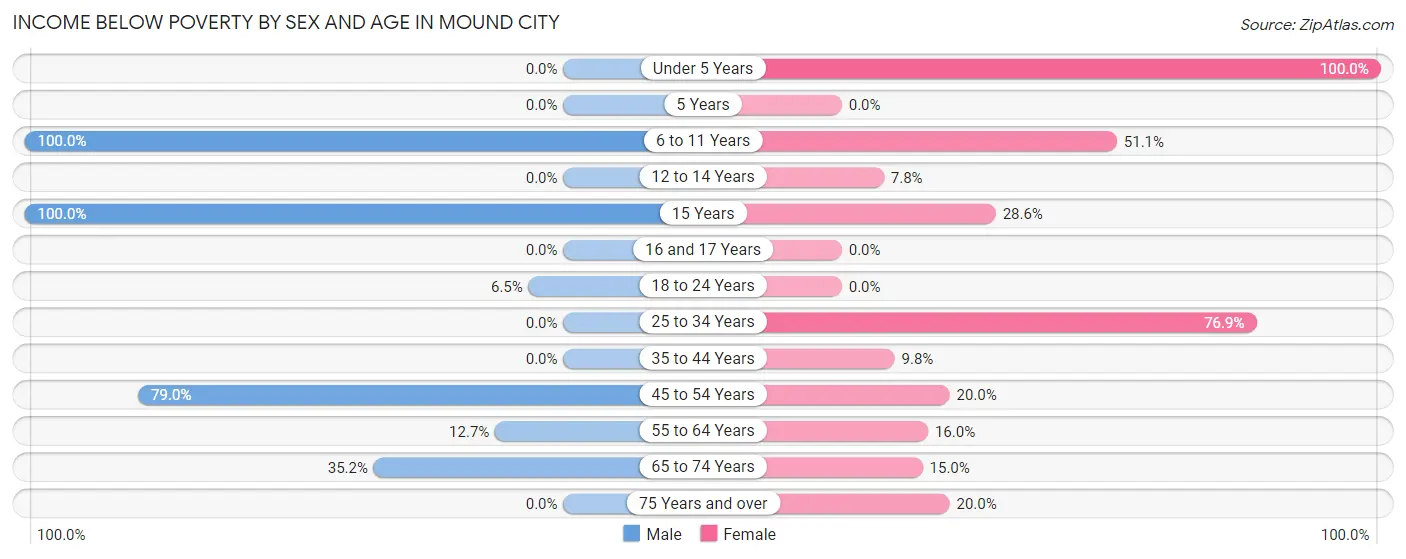
| Age Bracket | Male | Female |
| Under 5 Years | 0 (0.0%) | 6 (100.0%) |
| 5 Years | 0 (0.0%) | 0 (0.0%) |
| 6 to 11 Years | 8 (100.0%) | 24 (51.1%) |
| 12 to 14 Years | 0 (0.0%) | 5 (7.8%) |
| 15 Years | 3 (100.0%) | 8 (28.6%) |
| 16 and 17 Years | 0 (0.0%) | 0 (0.0%) |
| 18 to 24 Years | 4 (6.5%) | 0 (0.0%) |
| 25 to 34 Years | 0 (0.0%) | 20 (76.9%) |
| 35 to 44 Years | 0 (0.0%) | 5 (9.8%) |
| 45 to 54 Years | 15 (78.9%) | 6 (20.0%) |
| 55 to 64 Years | 10 (12.7%) | 4 (16.0%) |
| 65 to 74 Years | 19 (35.2%) | 3 (15.0%) |
| 75 Years and over | 0 (0.0%) | 7 (20.0%) |
| Total | 59 (12.9%) | 88 (25.8%) |
Income Above Poverty by Sex and Age in Mound City
According to the poverty statistics in Mound City, males aged under 5 years and females aged 18 to 24 years are the age groups that are most secure financially, with 100.0% of males and 100.0% of females in these age groups living above the poverty line.
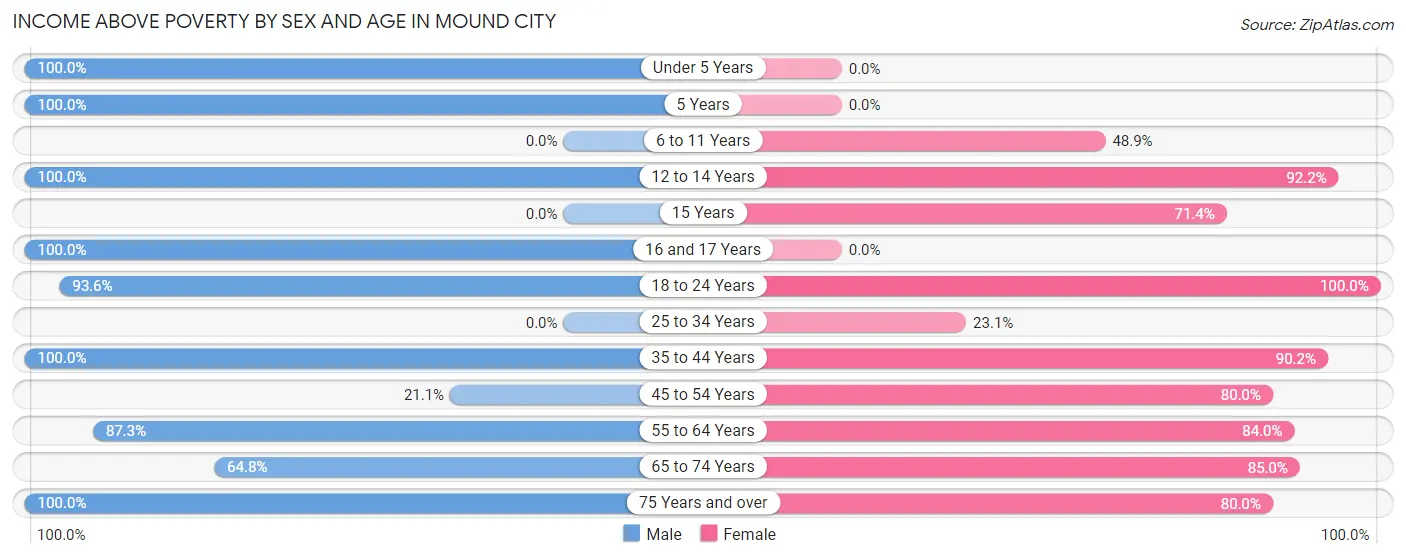
| Age Bracket | Male | Female |
| Under 5 Years | 19 (100.0%) | 0 (0.0%) |
| 5 Years | 19 (100.0%) | 0 (0.0%) |
| 6 to 11 Years | 0 (0.0%) | 23 (48.9%) |
| 12 to 14 Years | 15 (100.0%) | 59 (92.2%) |
| 15 Years | 0 (0.0%) | 20 (71.4%) |
| 16 and 17 Years | 19 (100.0%) | 0 (0.0%) |
| 18 to 24 Years | 58 (93.5%) | 9 (100.0%) |
| 25 to 34 Years | 0 (0.0%) | 6 (23.1%) |
| 35 to 44 Years | 143 (100.0%) | 46 (90.2%) |
| 45 to 54 Years | 4 (21.0%) | 24 (80.0%) |
| 55 to 64 Years | 69 (87.3%) | 21 (84.0%) |
| 65 to 74 Years | 35 (64.8%) | 17 (85.0%) |
| 75 Years and over | 17 (100.0%) | 28 (80.0%) |
| Total | 398 (87.1%) | 253 (74.2%) |
Income Below Poverty Among Married-Couple Families in Mound City
The poverty statistics for married-couple families in Mound City show that 18.6% or 13 of the total 70 families live below the poverty line. Families with no children have the highest poverty rate of 23.1%, comprising of 9 families. On the other hand, families with 1 or 2 children have the lowest poverty rate of 12.9%, which includes 4 families.
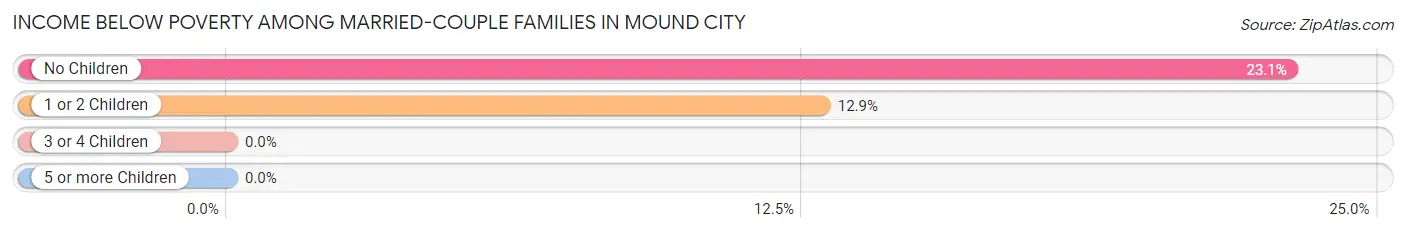
| Children | Above Poverty | Below Poverty |
| No Children | 30 (76.9%) | 9 (23.1%) |
| 1 or 2 Children | 27 (87.1%) | 4 (12.9%) |
| 3 or 4 Children | 0 (0.0%) | 0 (0.0%) |
| 5 or more Children | 0 (0.0%) | 0 (0.0%) |
| Total | 57 (81.4%) | 13 (18.6%) |
Income Below Poverty Among Single-Parent Households in Mound City
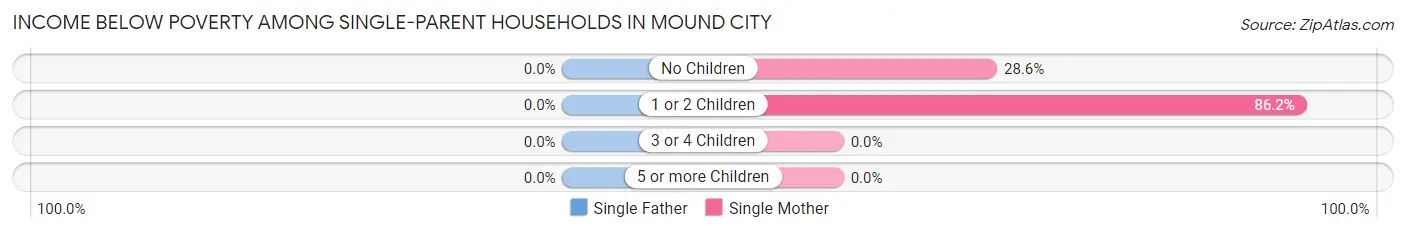
| Children | Single Father | Single Mother |
| No Children | 0 (0.0%) | 6 (28.6%) |
| 1 or 2 Children | 0 (0.0%) | 25 (86.2%) |
| 3 or 4 Children | 0 (0.0%) | 0 (0.0%) |
| 5 or more Children | 0 (0.0%) | 0 (0.0%) |
| Total | 0 (0.0%) | 31 (47.0%) |
Income Below Poverty Among Married-Couple vs Single-Parent Households in Mound City
The poverty data for Mound City shows that 13 of the married-couple family households (18.6%) and 31 of the single-parent households (36.5%) are living below the poverty level. Within the married-couple family households, those with no children have the highest poverty rate, with 9 households (23.1%) falling below the poverty line. Among the single-parent households, those with 1 or 2 children have the highest poverty rate, with 25 household (64.1%) living below poverty.
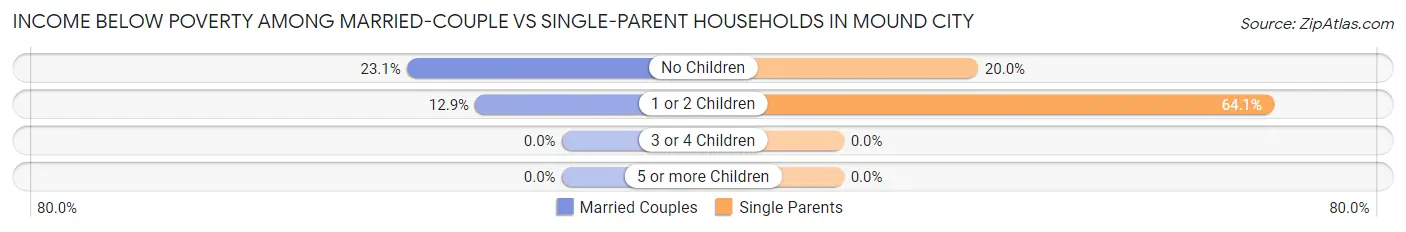
| Children | Married-Couple Families | Single-Parent Households |
| No Children | 9 (23.1%) | 6 (20.0%) |
| 1 or 2 Children | 4 (12.9%) | 25 (64.1%) |
| 3 or 4 Children | 0 (0.0%) | 0 (0.0%) |
| 5 or more Children | 0 (0.0%) | 0 (0.0%) |
| Total | 13 (18.6%) | 31 (36.5%) |
Race in Mound City
The most populous races in Mound City are White / Caucasian (418 | 52.4%), Black / African American (345 | 43.2%), and Two or more Races (27 | 3.4%).
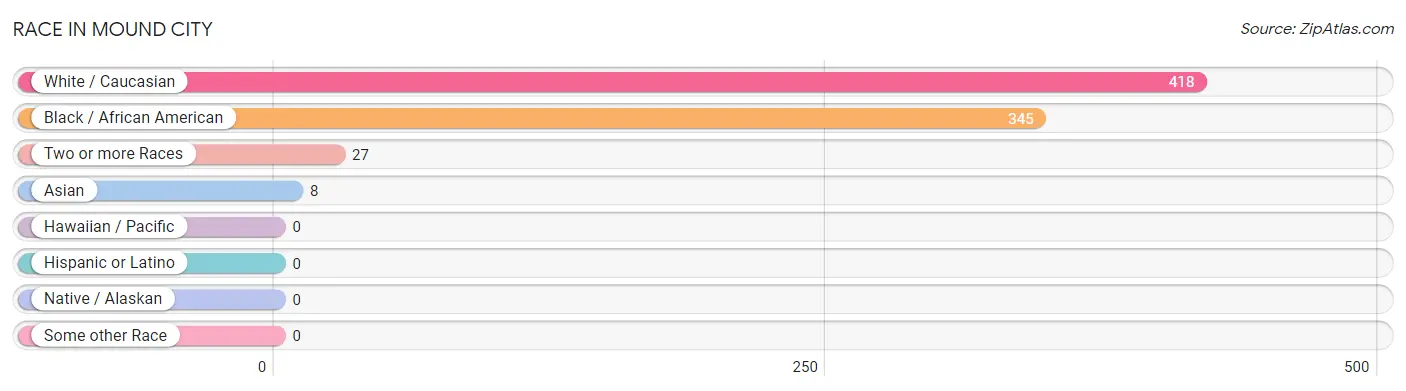
| Race | # Population | % Population |
| Asian | 8 | 1.0% |
| Black / African American | 345 | 43.2% |
| Hawaiian / Pacific | 0 | 0.0% |
| Hispanic or Latino | 0 | 0.0% |
| Native / Alaskan | 0 | 0.0% |
| White / Caucasian | 418 | 52.4% |
| Two or more Races | 27 | 3.4% |
| Some other Race | 0 | 0.0% |
| Total | 798 | 100.0% |
Ancestry in Mound City
The most populous ancestries reported in Mound City are American (43 | 5.4%), German (37 | 4.6%), Arab (24 | 3.0%), Irish (23 | 2.9%), and Korean (8 | 1.0%), together accounting for 16.9% of all Mound City residents.
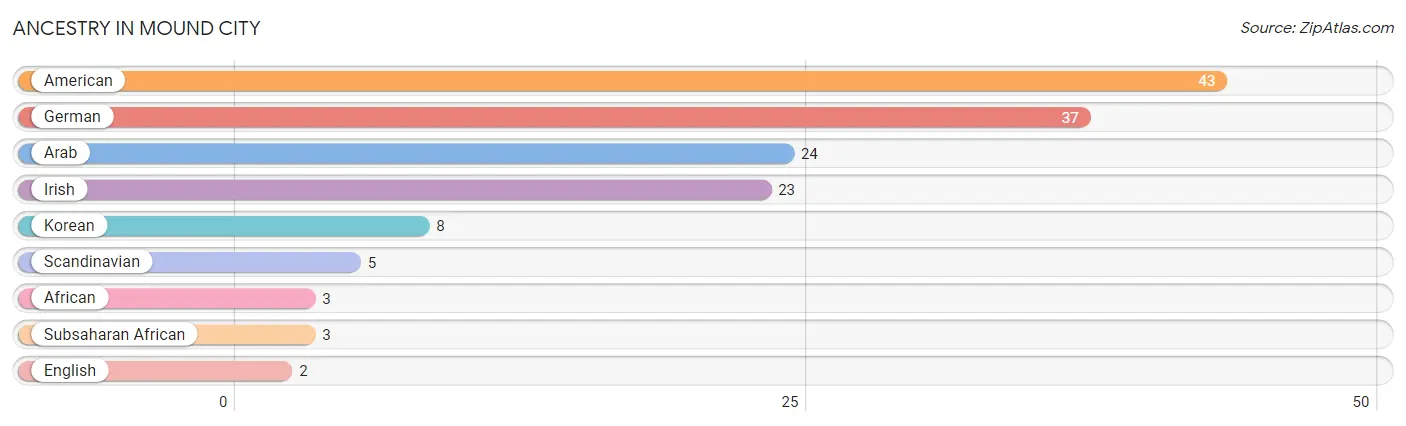
| Ancestry | # Population | % Population |
| African | 3 | 0.4% |
| American | 43 | 5.4% |
| Arab | 24 | 3.0% |
| English | 2 | 0.3% |
| German | 37 | 4.6% |
| Irish | 23 | 2.9% |
| Korean | 8 | 1.0% |
| Scandinavian | 5 | 0.6% |
| Subsaharan African | 3 | 0.4% | View All 9 Rows |
Immigrants in Mound City
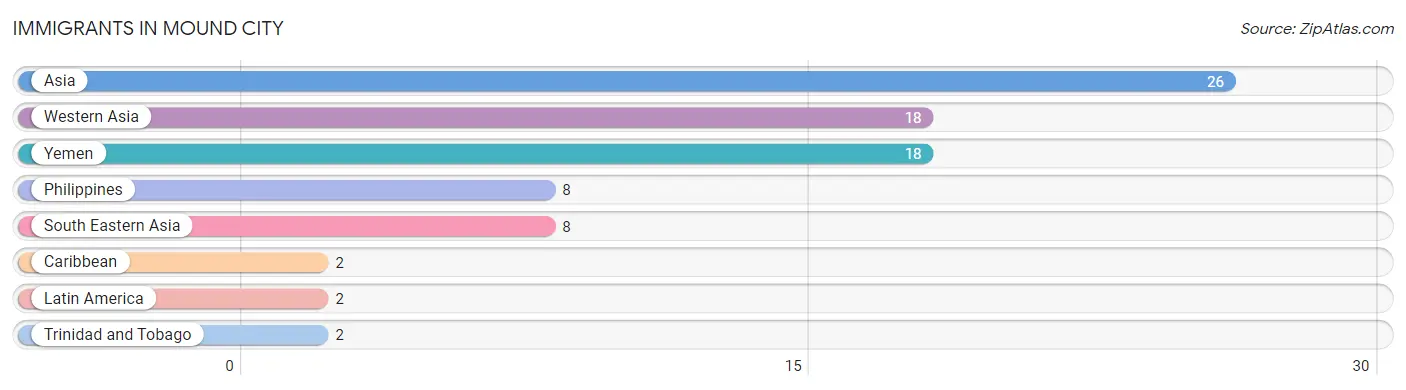
The most numerous immigrant groups reported in Mound City came from Asia (26 | 3.3%), Western Asia (18 | 2.3%), Yemen (18 | 2.3%), Philippines (8 | 1.0%), and South Eastern Asia (8 | 1.0%), together accounting for 9.8% of all Mound City residents.
| Immigration Origin | # Population | % Population |
| Asia | 26 | 3.3% |
| Caribbean | 2 | 0.3% |
| Latin America | 2 | 0.3% |
| Philippines | 8 | 1.0% |
| South Eastern Asia | 8 | 1.0% |
| Trinidad and Tobago | 2 | 0.3% |
| Western Asia | 18 | 2.3% |
| Yemen | 18 | 2.3% | View All 8 Rows |
Sex and Age in Mound City
Sex and Age in Mound City
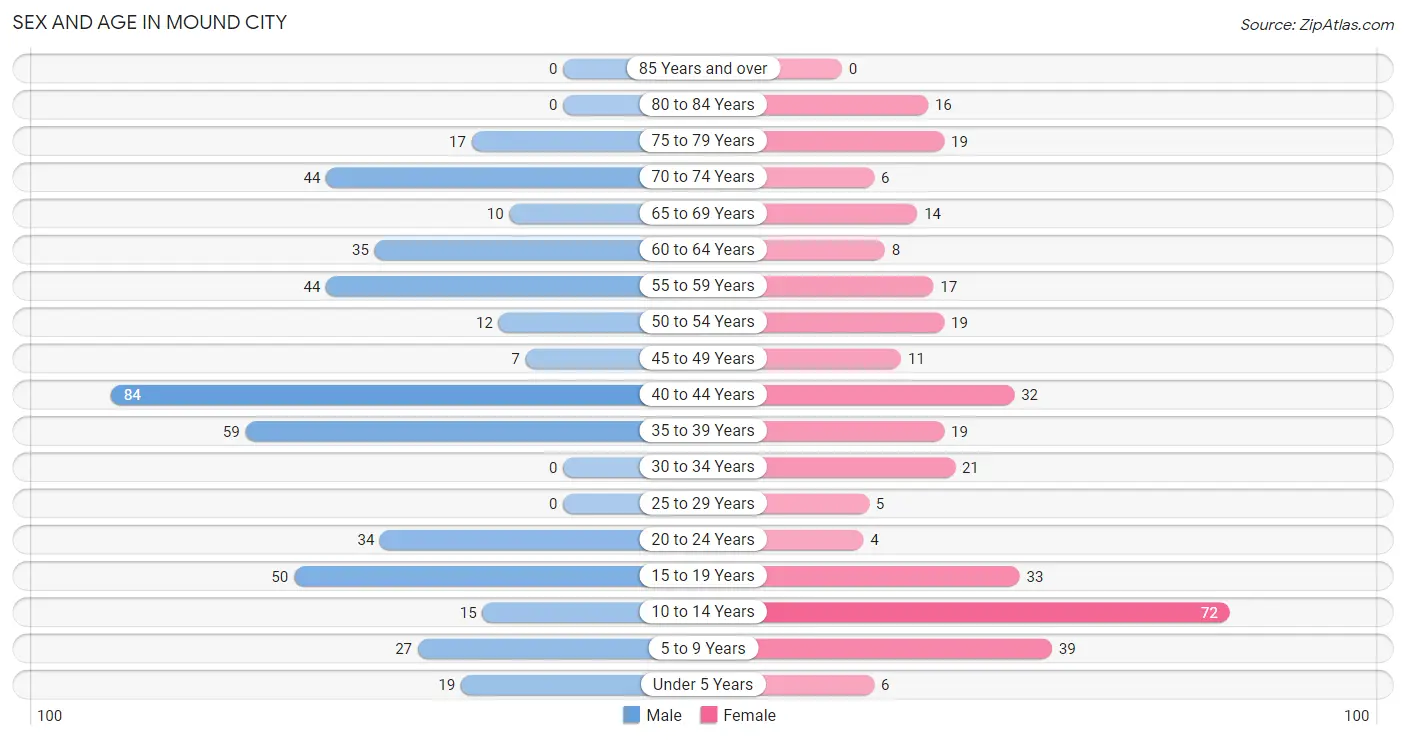
The most populous age groups in Mound City are 40 to 44 Years (84 | 18.4%) for men and 10 to 14 Years (72 | 21.1%) for women.
| Age Bracket | Male | Female |
| Under 5 Years | 19 (4.2%) | 6 (1.8%) |
| 5 to 9 Years | 27 (5.9%) | 39 (11.4%) |
| 10 to 14 Years | 15 (3.3%) | 72 (21.1%) |
| 15 to 19 Years | 50 (10.9%) | 33 (9.7%) |
| 20 to 24 Years | 34 (7.4%) | 4 (1.2%) |
| 25 to 29 Years | 0 (0.0%) | 5 (1.5%) |
| 30 to 34 Years | 0 (0.0%) | 21 (6.2%) |
| 35 to 39 Years | 59 (12.9%) | 19 (5.6%) |
| 40 to 44 Years | 84 (18.4%) | 32 (9.4%) |
| 45 to 49 Years | 7 (1.5%) | 11 (3.2%) |
| 50 to 54 Years | 12 (2.6%) | 19 (5.6%) |
| 55 to 59 Years | 44 (9.6%) | 17 (5.0%) |
| 60 to 64 Years | 35 (7.7%) | 8 (2.4%) |
| 65 to 69 Years | 10 (2.2%) | 14 (4.1%) |
| 70 to 74 Years | 44 (9.6%) | 6 (1.8%) |
| 75 to 79 Years | 17 (3.7%) | 19 (5.6%) |
| 80 to 84 Years | 0 (0.0%) | 16 (4.7%) |
| 85 Years and over | 0 (0.0%) | 0 (0.0%) |
| Total | 457 (100.0%) | 341 (100.0%) |
Families and Households in Mound City
Median Family Size in Mound City
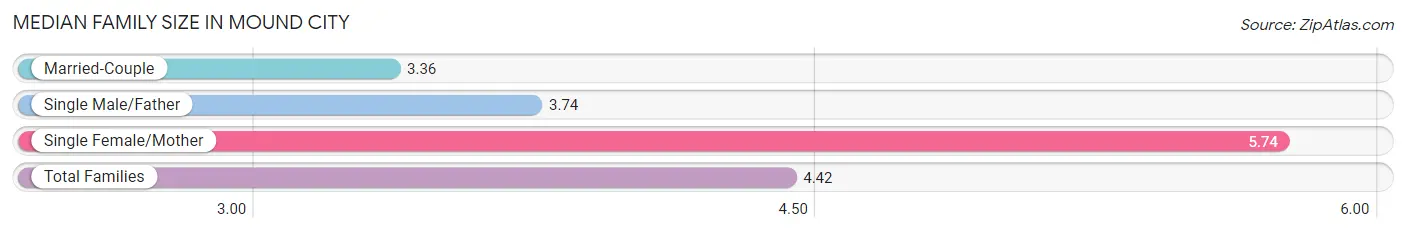
The median family size in Mound City is 4.42 persons per family, with single female/mother families (66 | 42.6%) accounting for the largest median family size of 5.74 persons per family. On the other hand, married-couple families (70 | 45.2%) represent the smallest median family size with 3.36 persons per family.
| Family Type | # Families | Family Size |
| Married-Couple | 70 (45.2%) | 3.36 |
| Single Male/Father | 19 (12.3%) | 3.74 |
| Single Female/Mother | 66 (42.6%) | 5.74 |
| Total Families | 155 (100.0%) | 4.42 |
Median Household Size in Mound City
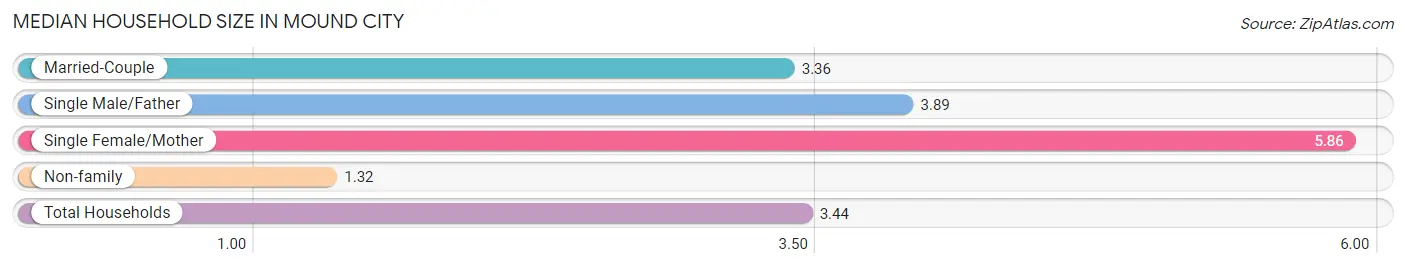
The median household size in Mound City is 3.44 persons per household, with single female/mother households (66 | 28.4%) accounting for the largest median household size of 5.86 persons per household. non-family households (77 | 33.2%) represent the smallest median household size with 1.32 persons per household.
| Household Type | # Households | Household Size |
| Married-Couple | 70 (30.2%) | 3.36 |
| Single Male/Father | 19 (8.2%) | 3.89 |
| Single Female/Mother | 66 (28.4%) | 5.86 |
| Non-family | 77 (33.2%) | 1.32 |
| Total Households | 232 (100.0%) | 3.44 |
Household Size by Marriage Status in Mound City
Out of a total of 232 households in Mound City, 155 (66.8%) are family households, while 77 (33.2%) are nonfamily households. The most numerous type of family households are 2-person households, comprising 64, and the most common type of nonfamily households are 1-person households, comprising 72.
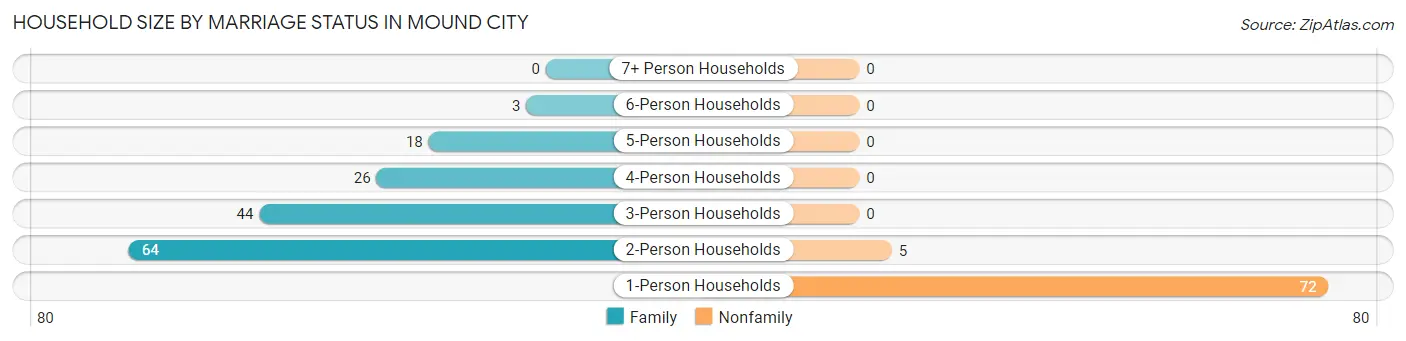
| Household Size | Family Households | Nonfamily Households |
| 1-Person Households | - | 72 (31.0%) |
| 2-Person Households | 64 (27.6%) | 5 (2.2%) |
| 3-Person Households | 44 (19.0%) | 0 (0.0%) |
| 4-Person Households | 26 (11.2%) | 0 (0.0%) |
| 5-Person Households | 18 (7.8%) | 0 (0.0%) |
| 6-Person Households | 3 (1.3%) | 0 (0.0%) |
| 7+ Person Households | 0 (0.0%) | 0 (0.0%) |
| Total | 155 (66.8%) | 77 (33.2%) |
Female Fertility in Mound City
Fertility by Age in Mound City
| Age Bracket | Women with Births | Births / 1,000 Women |
| 15 to 19 years | 0 (0.0%) | 0.0 |
| 20 to 34 years | 0 (0.0%) | 0.0 |
| 35 to 50 years | 0 (0.0%) | 0.0 |
| Total | 0 (0.0%) | 0.0 |
Fertility by Age by Marriage Status in Mound City
| Age Bracket | Married | Unmarried |
| 15 to 19 years | 0 (0.0%) | 0 (0.0%) |
| 20 to 34 years | 0 (0.0%) | 0 (0.0%) |
| 35 to 50 years | 0 (0.0%) | 0 (0.0%) |
| Total | 0 (0.0%) | 0 (0.0%) |
Fertility by Education in Mound City
| Educational Attainment | Women with Births | Births / 1,000 Women |
| Less than High School | 0 (0.0%) | 0.0 |
| High School Diploma | 0 (0.0%) | 0.0 |
| College or Associate's Degree | 0 (0.0%) | 0.0 |
| Bachelor's Degree | 0 (0.0%) | 0.0 |
| Graduate Degree | 0 (0.0%) | 0.0 |
| Total | 0 (0.0%) | 0.0 |
Fertility by Education by Marriage Status in Mound City
| Educational Attainment | Married | Unmarried |
| Less than High School | 0 (0.0%) | 0 (0.0%) |
| High School Diploma | 0 (0.0%) | 0 (0.0%) |
| College or Associate's Degree | 0 (0.0%) | 0 (0.0%) |
| Bachelor's Degree | 0 (0.0%) | 0 (0.0%) |
| Graduate Degree | 0 (0.0%) | 0 (0.0%) |
| Total | 0 (0.0%) | 0 (0.0%) |
Employment Characteristics in Mound City
Employment by Class of Employer in Mound City
Among the 237 employed individuals in Mound City, private company employees (187 | 78.9%), state government employees (21 | 8.9%), and local government employees (11 | 4.6%) make up the most common classes of employment.
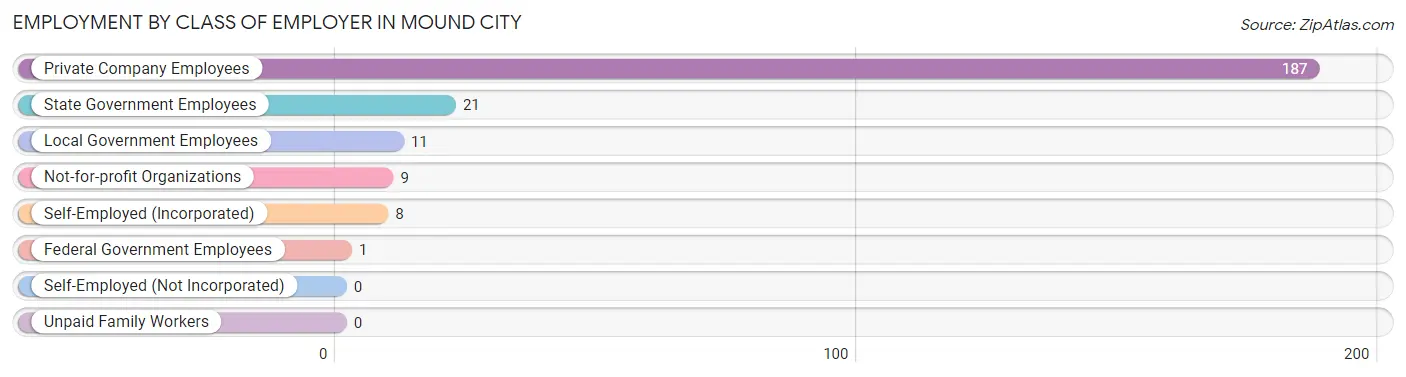
| Employer Class | # Employees | % Employees |
| Private Company Employees | 187 | 78.9% |
| Self-Employed (Incorporated) | 8 | 3.4% |
| Self-Employed (Not Incorporated) | 0 | 0.0% |
| Not-for-profit Organizations | 9 | 3.8% |
| Local Government Employees | 11 | 4.6% |
| State Government Employees | 21 | 8.9% |
| Federal Government Employees | 1 | 0.4% |
| Unpaid Family Workers | 0 | 0.0% |
| Total | 237 | 100.0% |
Employment Status by Age in Mound City
According to the labor force statistics for Mound City, out of the total population over 16 years of age (589), 53.0% or 312 individuals are in the labor force, with 3.8% or 12 of them unemployed. The age group with the highest labor force participation rate is 25 to 29 years, with 100.0% or 5 individuals in the labor force. Within the labor force, the 30 to 34 years age range has the highest percentage of unemployed individuals, with 46.2% or 6 of them being unemployed.
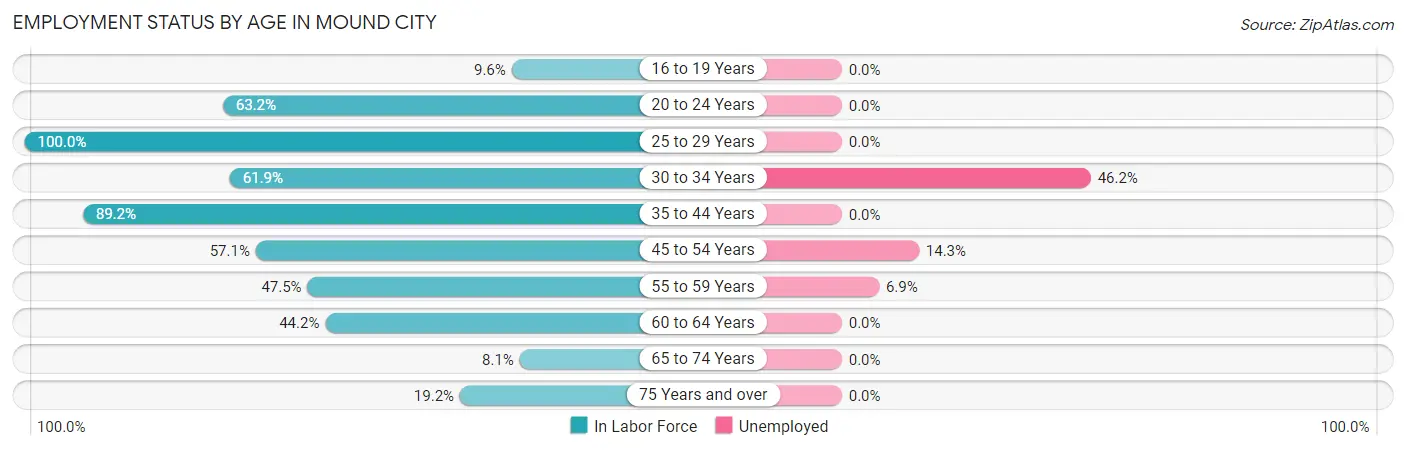
| Age Bracket | In Labor Force | Unemployed |
| 16 to 19 Years | 5 (9.6%) | 0 (0.0%) |
| 20 to 24 Years | 24 (63.2%) | 0 (0.0%) |
| 25 to 29 Years | 5 (100.0%) | 0 (0.0%) |
| 30 to 34 Years | 13 (61.9%) | 6 (46.2%) |
| 35 to 44 Years | 173 (89.2%) | 0 (0.0%) |
| 45 to 54 Years | 28 (57.1%) | 4 (14.3%) |
| 55 to 59 Years | 29 (47.5%) | 2 (6.9%) |
| 60 to 64 Years | 19 (44.2%) | 0 (0.0%) |
| 65 to 74 Years | 6 (8.1%) | 0 (0.0%) |
| 75 Years and over | 10 (19.2%) | 0 (0.0%) |
| Total | 312 (53.0%) | 12 (3.8%) |
Employment Status by Educational Attainment in Mound City
According to labor force statistics for Mound City, 71.6% of individuals (267) out of the total population between 25 and 64 years of age (373) are in the labor force, with 4.5% or 12 of them being unemployed. The group with the highest labor force participation rate are those with the educational attainment of bachelor's degree or higher, with 100.0% or 13 individuals in the labor force. Within the labor force, individuals with less than high school education have the highest percentage of unemployment, with 46.2% or 6 of them being unemployed.
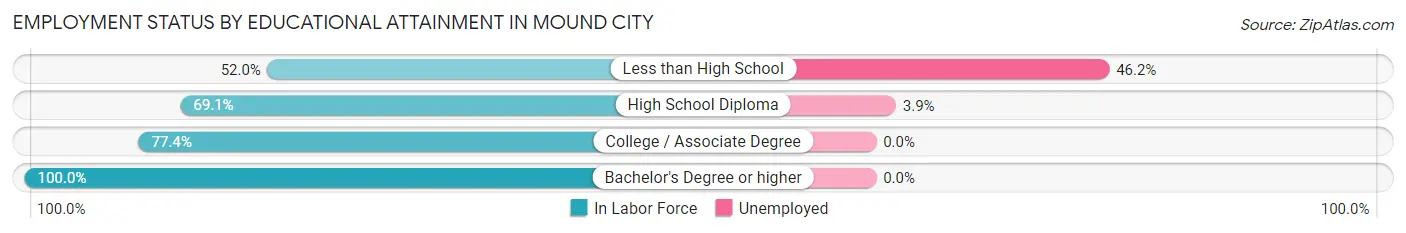
| Educational Attainment | In Labor Force | Unemployed |
| Less than High School | 13 (52.0%) | 12 (46.2%) |
| High School Diploma | 152 (69.1%) | 9 (3.9%) |
| College / Associate Degree | 89 (77.4%) | 0 (0.0%) |
| Bachelor's Degree or higher | 13 (100.0%) | 0 (0.0%) |
| Total | 267 (71.6%) | 17 (4.5%) |
Employment Occupations by Sex in Mound City
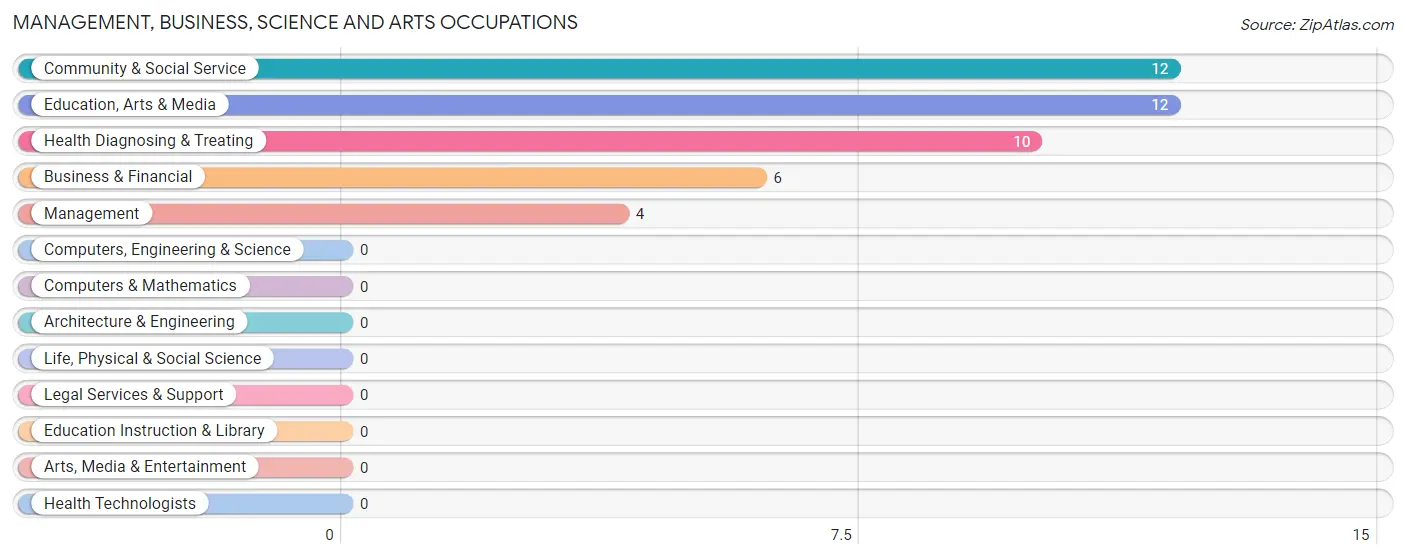
Management, Business, Science and Arts Occupations
The most common Management, Business, Science and Arts occupations in Mound City are Community & Social Service (12 | 4.0%), Education, Arts & Media (12 | 4.0%), Health Diagnosing & Treating (10 | 3.3%), Business & Financial (6 | 2.0%), and Management (4 | 1.3%).
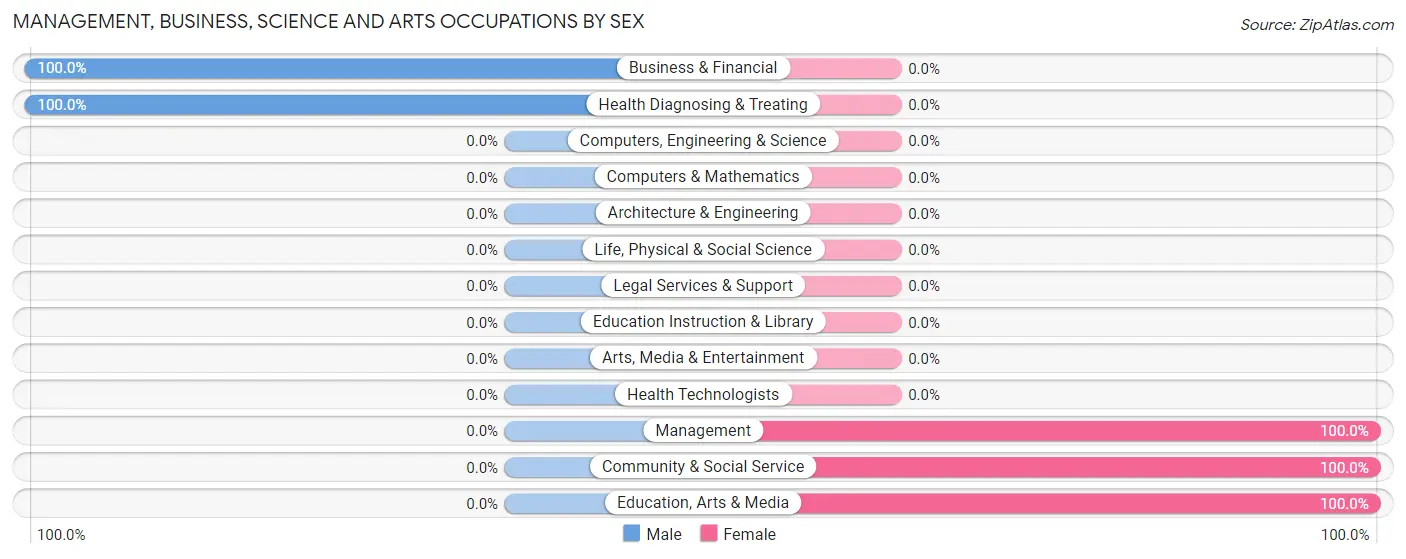
Management, Business, Science and Arts Occupations by Sex
Within the Management, Business, Science and Arts occupations in Mound City, the most male-oriented occupations are Business & Financial (100.0%), and Health Diagnosing & Treating (100.0%), while the most female-oriented occupations are Management (100.0%), Community & Social Service (100.0%), and Education, Arts & Media (100.0%).
| Occupation | Male | Female |
| Management | 0 (0.0%) | 4 (100.0%) |
| Business & Financial | 6 (100.0%) | 0 (0.0%) |
| Computers, Engineering & Science | 0 (0.0%) | 0 (0.0%) |
| Computers & Mathematics | 0 (0.0%) | 0 (0.0%) |
| Architecture & Engineering | 0 (0.0%) | 0 (0.0%) |
| Life, Physical & Social Science | 0 (0.0%) | 0 (0.0%) |
| Community & Social Service | 0 (0.0%) | 12 (100.0%) |
| Education, Arts & Media | 0 (0.0%) | 12 (100.0%) |
| Legal Services & Support | 0 (0.0%) | 0 (0.0%) |
| Education Instruction & Library | 0 (0.0%) | 0 (0.0%) |
| Arts, Media & Entertainment | 0 (0.0%) | 0 (0.0%) |
| Health Diagnosing & Treating | 10 (100.0%) | 0 (0.0%) |
| Health Technologists | 0 (0.0%) | 0 (0.0%) |
| Total (Category) | 16 (50.0%) | 16 (50.0%) |
| Total (Overall) | 204 (68.0%) | 96 (32.0%) |
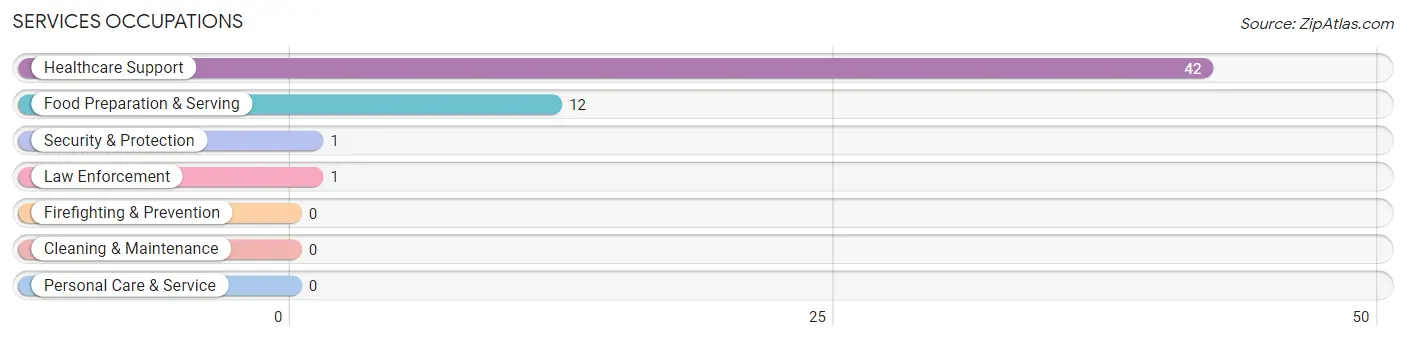
Services Occupations
The most common Services occupations in Mound City are Healthcare Support (42 | 14.0%), Food Preparation & Serving (12 | 4.0%), Security & Protection (1 | 0.3%), and Law Enforcement (1 | 0.3%).
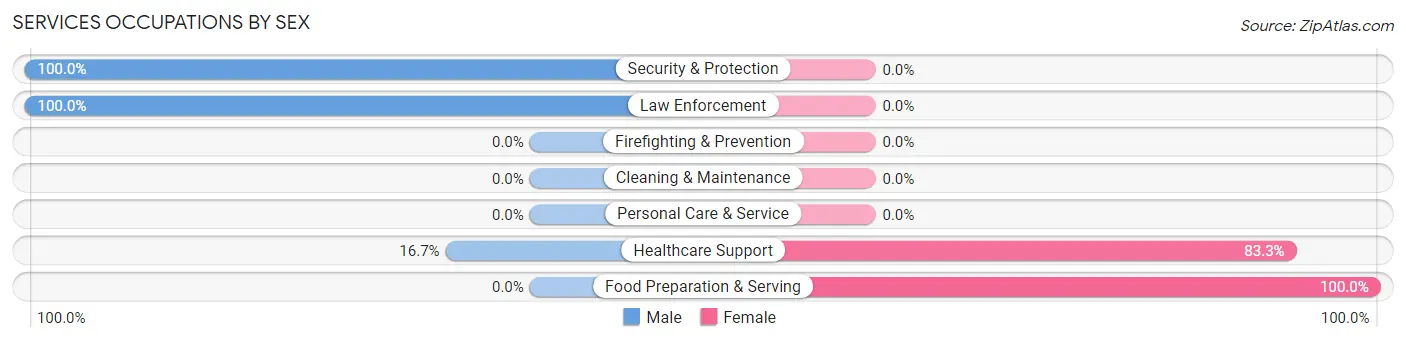
Services Occupations by Sex
Within the Services occupations in Mound City, the most male-oriented occupations are Security & Protection (100.0%), Law Enforcement (100.0%), and Healthcare Support (16.7%), while the most female-oriented occupations are Food Preparation & Serving (100.0%), and Healthcare Support (83.3%).
| Occupation | Male | Female |
| Healthcare Support | 7 (16.7%) | 35 (83.3%) |
| Security & Protection | 1 (100.0%) | 0 (0.0%) |
| Firefighting & Prevention | 0 (0.0%) | 0 (0.0%) |
| Law Enforcement | 1 (100.0%) | 0 (0.0%) |
| Food Preparation & Serving | 0 (0.0%) | 12 (100.0%) |
| Cleaning & Maintenance | 0 (0.0%) | 0 (0.0%) |
| Personal Care & Service | 0 (0.0%) | 0 (0.0%) |
| Total (Category) | 8 (14.5%) | 47 (85.5%) |
| Total (Overall) | 204 (68.0%) | 96 (32.0%) |
Sales and Office Occupations
The most common Sales and Office occupations in Mound City are Sales & Related (82 | 27.3%), and Office & Administration (58 | 19.3%).
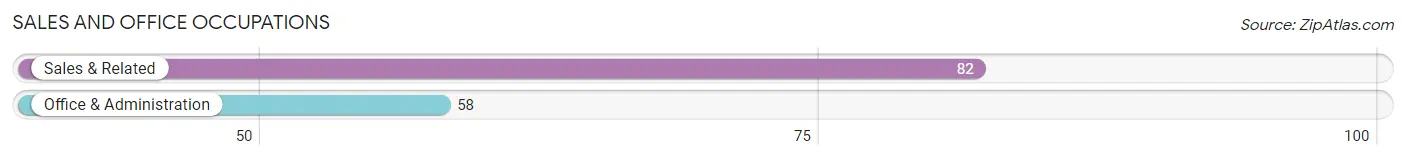
Sales and Office Occupations by Sex
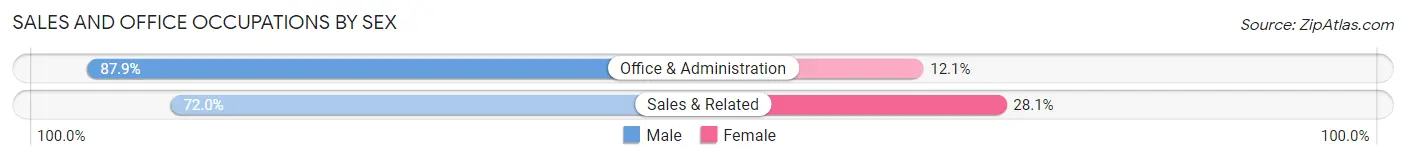
| Occupation | Male | Female |
| Sales & Related | 59 (72.0%) | 23 (28.1%) |
| Office & Administration | 51 (87.9%) | 7 (12.1%) |
| Total (Category) | 110 (78.6%) | 30 (21.4%) |
| Total (Overall) | 204 (68.0%) | 96 (32.0%) |
Natural Resources, Construction and Maintenance Occupations
The most common Natural Resources, Construction and Maintenance occupations in Mound City are Farming, Fishing & Forestry (6 | 2.0%), and Construction & Extraction (3 | 1.0%).
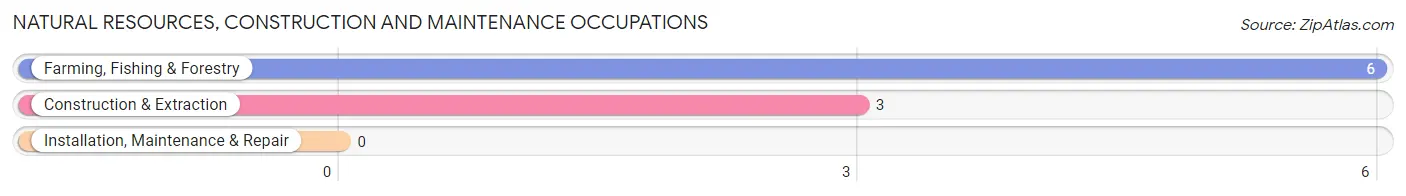
Natural Resources, Construction and Maintenance Occupations by Sex
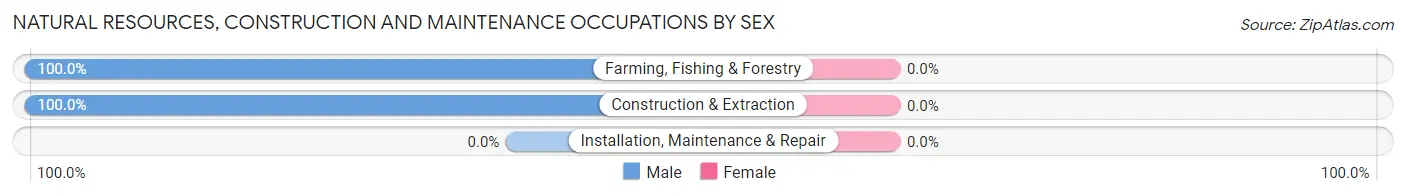
| Occupation | Male | Female |
| Farming, Fishing & Forestry | 6 (100.0%) | 0 (0.0%) |
| Construction & Extraction | 3 (100.0%) | 0 (0.0%) |
| Installation, Maintenance & Repair | 0 (0.0%) | 0 (0.0%) |
| Total (Category) | 9 (100.0%) | 0 (0.0%) |
| Total (Overall) | 204 (68.0%) | 96 (32.0%) |
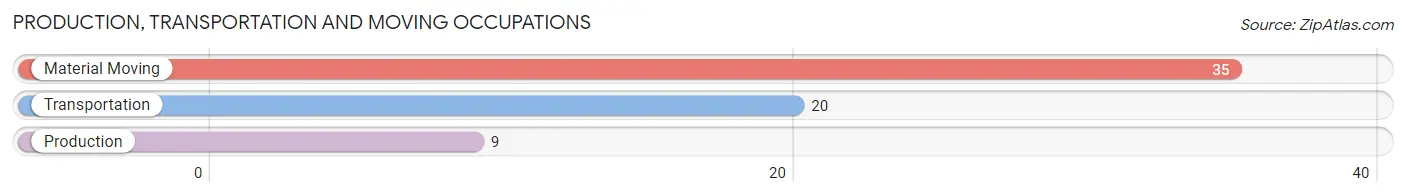
Production, Transportation and Moving Occupations
The most common Production, Transportation and Moving occupations in Mound City are Material Moving (35 | 11.7%), Transportation (20 | 6.7%), and Production (9 | 3.0%).
Production, Transportation and Moving Occupations by Sex
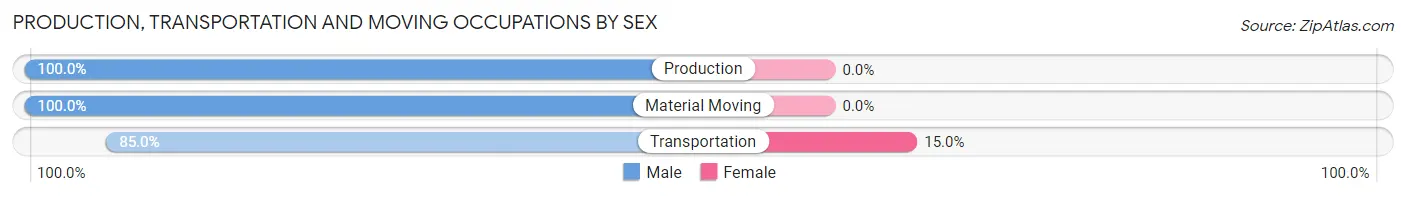
| Occupation | Male | Female |
| Production | 9 (100.0%) | 0 (0.0%) |
| Transportation | 17 (85.0%) | 3 (15.0%) |
| Material Moving | 35 (100.0%) | 0 (0.0%) |
| Total (Category) | 61 (95.3%) | 3 (4.7%) |
| Total (Overall) | 204 (68.0%) | 96 (32.0%) |
Employment Industries by Sex in Mound City
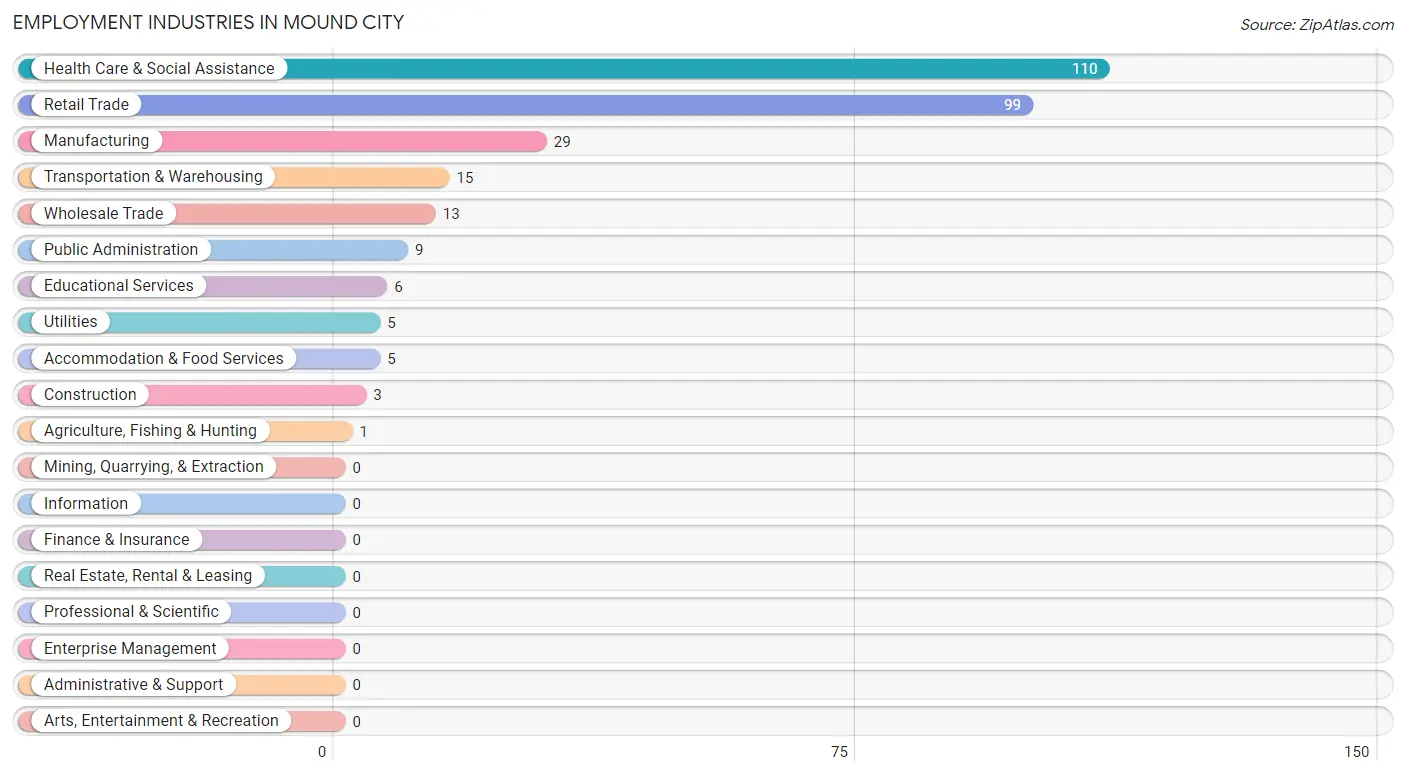
Employment Industries in Mound City
The major employment industries in Mound City include Health Care & Social Assistance (110 | 36.7%), Retail Trade (99 | 33.0%), Manufacturing (29 | 9.7%), Transportation & Warehousing (15 | 5.0%), and Wholesale Trade (13 | 4.3%).
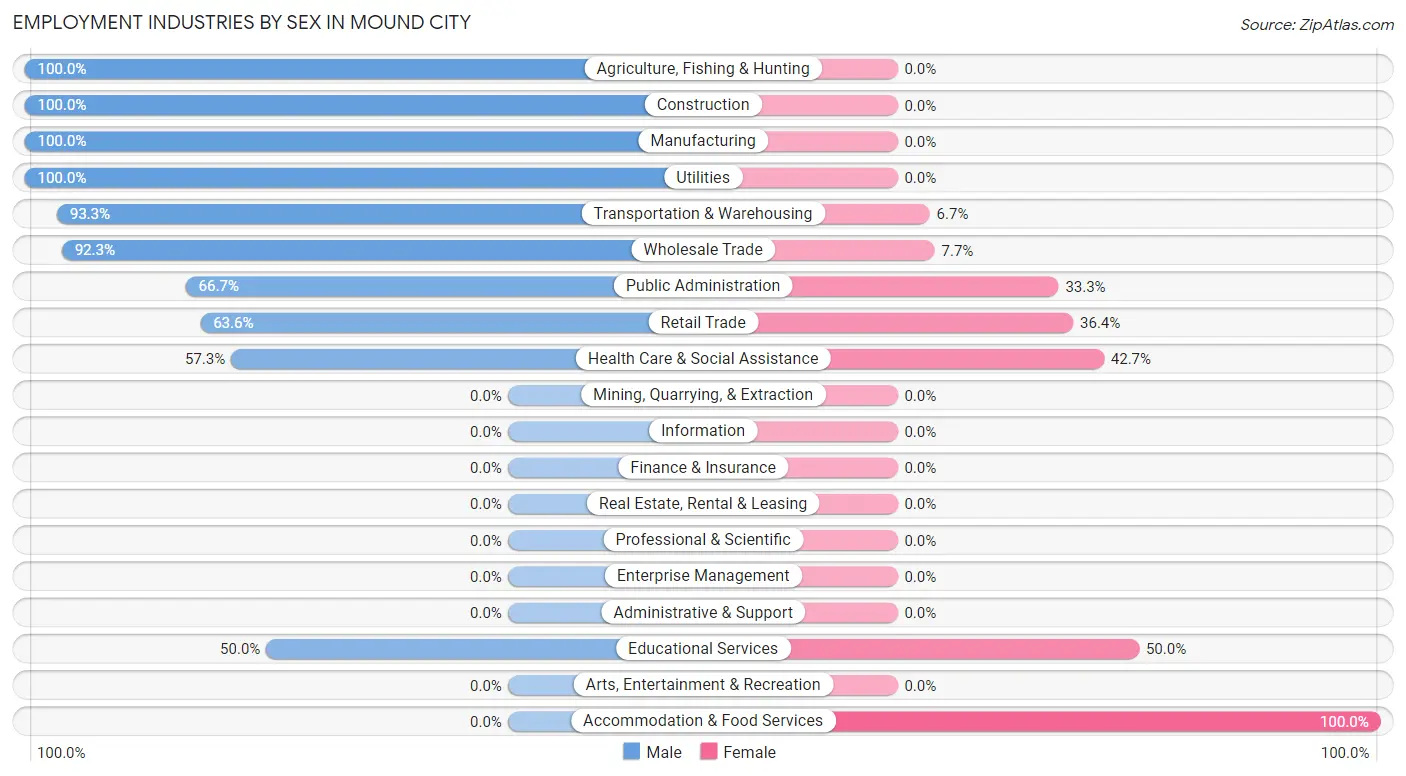
Employment Industries by Sex in Mound City
The Mound City industries that see more men than women are Agriculture, Fishing & Hunting (100.0%), Construction (100.0%), and Manufacturing (100.0%), whereas the industries that tend to have a higher number of women are Accommodation & Food Services (100.0%), Educational Services (50.0%), and Health Care & Social Assistance (42.7%).
| Industry | Male | Female |
| Agriculture, Fishing & Hunting | 1 (100.0%) | 0 (0.0%) |
| Mining, Quarrying, & Extraction | 0 (0.0%) | 0 (0.0%) |
| Construction | 3 (100.0%) | 0 (0.0%) |
| Manufacturing | 29 (100.0%) | 0 (0.0%) |
| Wholesale Trade | 12 (92.3%) | 1 (7.7%) |
| Retail Trade | 63 (63.6%) | 36 (36.4%) |
| Transportation & Warehousing | 14 (93.3%) | 1 (6.7%) |
| Utilities | 5 (100.0%) | 0 (0.0%) |
| Information | 0 (0.0%) | 0 (0.0%) |
| Finance & Insurance | 0 (0.0%) | 0 (0.0%) |
| Real Estate, Rental & Leasing | 0 (0.0%) | 0 (0.0%) |
| Professional & Scientific | 0 (0.0%) | 0 (0.0%) |
| Enterprise Management | 0 (0.0%) | 0 (0.0%) |
| Administrative & Support | 0 (0.0%) | 0 (0.0%) |
| Educational Services | 3 (50.0%) | 3 (50.0%) |
| Health Care & Social Assistance | 63 (57.3%) | 47 (42.7%) |
| Arts, Entertainment & Recreation | 0 (0.0%) | 0 (0.0%) |
| Accommodation & Food Services | 0 (0.0%) | 5 (100.0%) |
| Public Administration | 6 (66.7%) | 3 (33.3%) |
| Total | 204 (68.0%) | 96 (32.0%) |
Education in Mound City
School Enrollment in Mound City
The most common levels of schooling among the 214 students in Mound City are high school (75 | 35.0%), middle school (63 | 29.4%), and elementary school (46 | 21.5%).
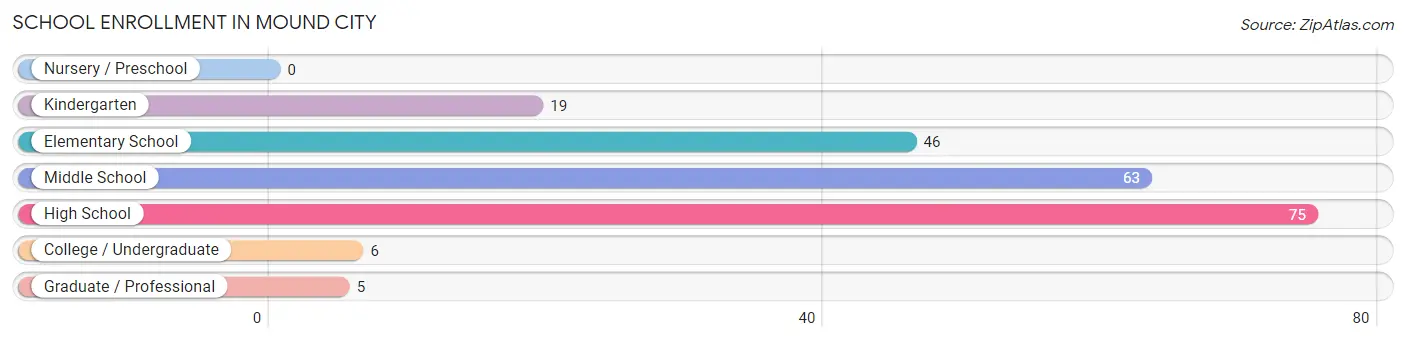
| School Level | # Students | % Students |
| Nursery / Preschool | 0 | 0.0% |
| Kindergarten | 19 | 8.9% |
| Elementary School | 46 | 21.5% |
| Middle School | 63 | 29.4% |
| High School | 75 | 35.0% |
| College / Undergraduate | 6 | 2.8% |
| Graduate / Professional | 5 | 2.3% |
| Total | 214 | 100.0% |
School Enrollment by Age by Funding Source in Mound City
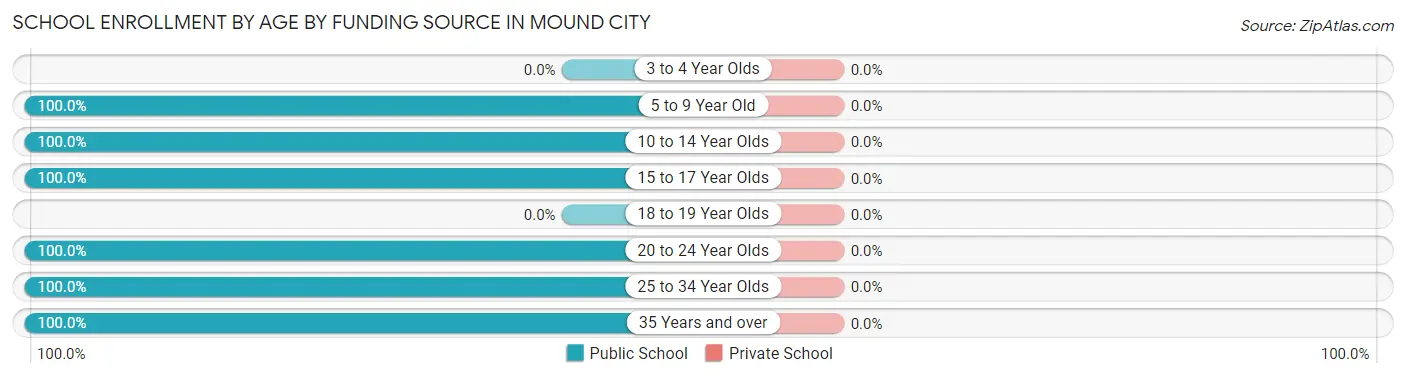
| Age Bracket | Public School | Private School |
| 3 to 4 Year Olds | 0 (0.0%) | 0 (0.0%) |
| 5 to 9 Year Old | 66 (100.0%) | 0 (0.0%) |
| 10 to 14 Year Olds | 87 (100.0%) | 0 (0.0%) |
| 15 to 17 Year Olds | 50 (100.0%) | 0 (0.0%) |
| 18 to 19 Year Olds | 0 (0.0%) | 0 (0.0%) |
| 20 to 24 Year Olds | 9 (100.0%) | 0 (0.0%) |
| 25 to 34 Year Olds | 1 (100.0%) | 0 (0.0%) |
| 35 Years and over | 1 (100.0%) | 0 (0.0%) |
| Total | 214 (100.0%) | 0 (0.0%) |
Educational Attainment by Field of Study in Mound City
Visual & performing arts (25 | 65.8%), physical & health sciences (5 | 13.2%), psychology (5 | 13.2%), and communications (3 | 7.9%) are the most common fields of study among 38 individuals in Mound City who have obtained a bachelor's degree or higher.
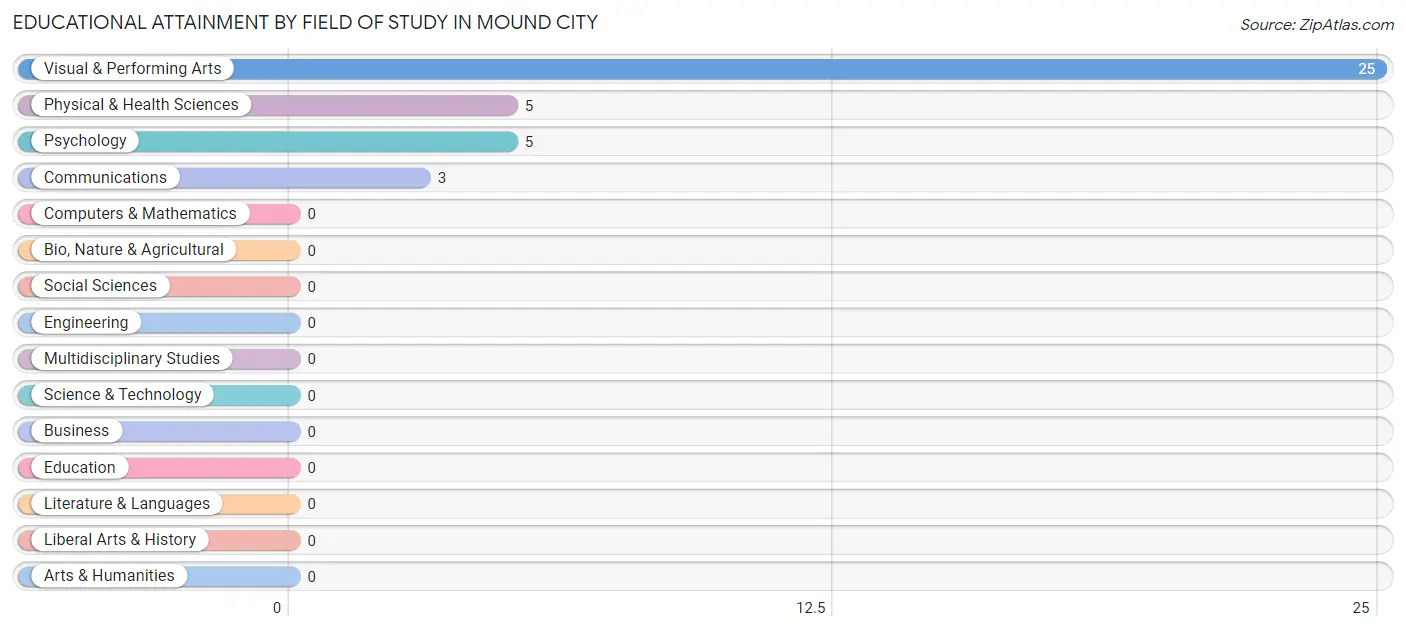
| Field of Study | # Graduates | % Graduates |
| Computers & Mathematics | 0 | 0.0% |
| Bio, Nature & Agricultural | 0 | 0.0% |
| Physical & Health Sciences | 5 | 13.2% |
| Psychology | 5 | 13.2% |
| Social Sciences | 0 | 0.0% |
| Engineering | 0 | 0.0% |
| Multidisciplinary Studies | 0 | 0.0% |
| Science & Technology | 0 | 0.0% |
| Business | 0 | 0.0% |
| Education | 0 | 0.0% |
| Literature & Languages | 0 | 0.0% |
| Liberal Arts & History | 0 | 0.0% |
| Visual & Performing Arts | 25 | 65.8% |
| Communications | 3 | 7.9% |
| Arts & Humanities | 0 | 0.0% |
| Total | 38 | 100.0% |
Transportation & Commute in Mound City
Vehicle Availability by Sex in Mound City
The most prevalent vehicle ownership categories in Mound City are males with 1 vehicle (68, accounting for 43.0%) and females with 1 vehicle (30, making up 86.1%).
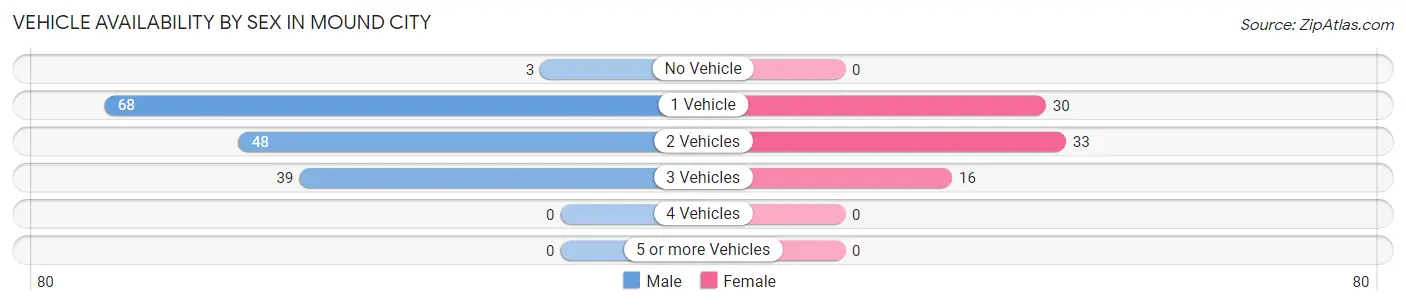
| Vehicles Available | Male | Female |
| No Vehicle | 3 (1.9%) | 0 (0.0%) |
| 1 Vehicle | 68 (43.0%) | 30 (38.0%) |
| 2 Vehicles | 48 (30.4%) | 33 (41.8%) |
| 3 Vehicles | 39 (24.7%) | 16 (20.3%) |
| 4 Vehicles | 0 (0.0%) | 0 (0.0%) |
| 5 or more Vehicles | 0 (0.0%) | 0 (0.0%) |
| Total | 158 (100.0%) | 79 (100.0%) |
Commute Time in Mound City
The most frequently occuring commute durations in Mound City are 20 to 24 minutes (88 commuters, 38.3%), 30 to 34 minutes (42 commuters, 18.3%), and 45 to 59 minutes (38 commuters, 16.5%).
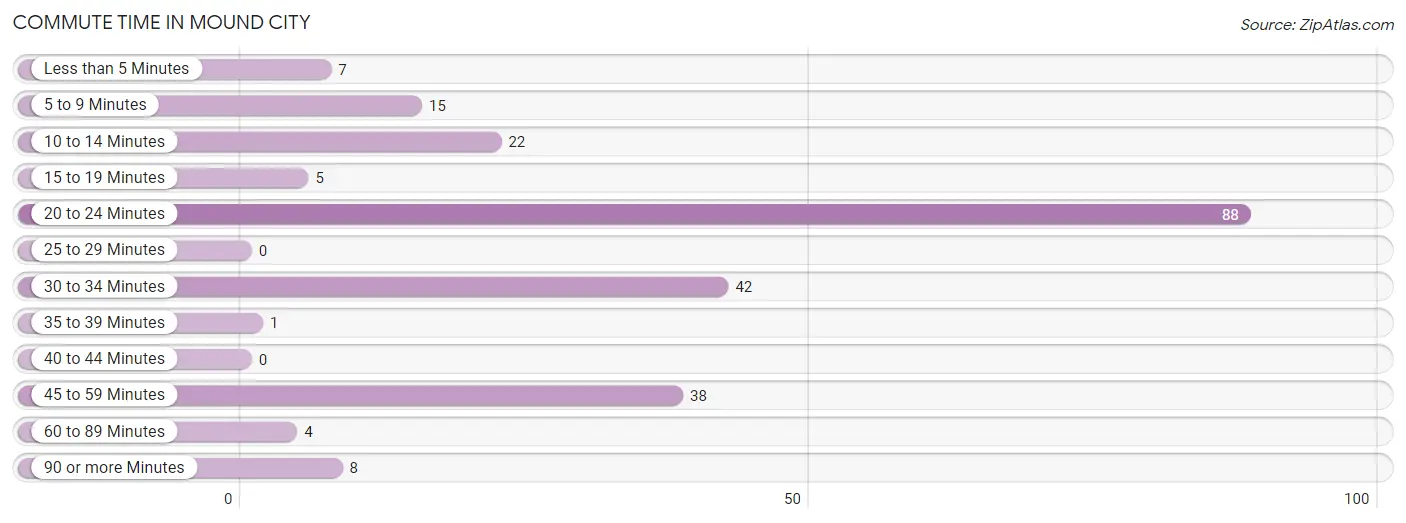
| Commute Time | # Commuters | % Commuters |
| Less than 5 Minutes | 7 | 3.0% |
| 5 to 9 Minutes | 15 | 6.5% |
| 10 to 14 Minutes | 22 | 9.6% |
| 15 to 19 Minutes | 5 | 2.2% |
| 20 to 24 Minutes | 88 | 38.3% |
| 25 to 29 Minutes | 0 | 0.0% |
| 30 to 34 Minutes | 42 | 18.3% |
| 35 to 39 Minutes | 1 | 0.4% |
| 40 to 44 Minutes | 0 | 0.0% |
| 45 to 59 Minutes | 38 | 16.5% |
| 60 to 89 Minutes | 4 | 1.7% |
| 90 or more Minutes | 8 | 3.5% |
Commute Time by Sex in Mound City
The most common commute times in Mound City are 20 to 24 minutes (67 commuters, 44.4%) for males and 30 to 34 minutes (26 commuters, 32.9%) for females.
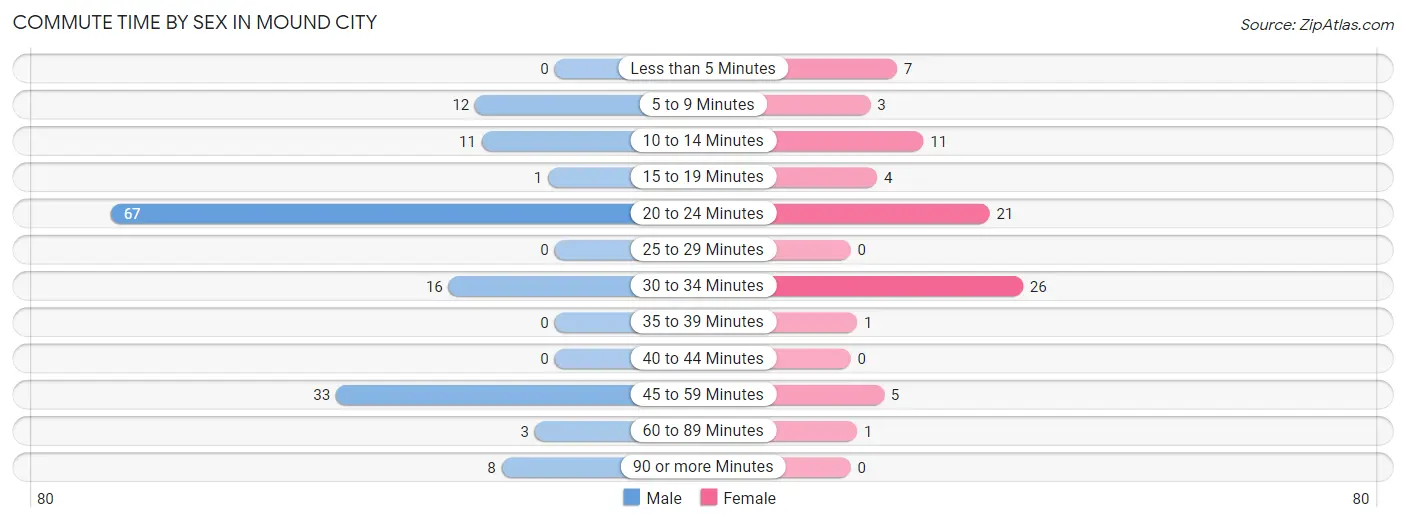
| Commute Time | Male | Female |
| Less than 5 Minutes | 0 (0.0%) | 7 (8.9%) |
| 5 to 9 Minutes | 12 (8.0%) | 3 (3.8%) |
| 10 to 14 Minutes | 11 (7.3%) | 11 (13.9%) |
| 15 to 19 Minutes | 1 (0.7%) | 4 (5.1%) |
| 20 to 24 Minutes | 67 (44.4%) | 21 (26.6%) |
| 25 to 29 Minutes | 0 (0.0%) | 0 (0.0%) |
| 30 to 34 Minutes | 16 (10.6%) | 26 (32.9%) |
| 35 to 39 Minutes | 0 (0.0%) | 1 (1.3%) |
| 40 to 44 Minutes | 0 (0.0%) | 0 (0.0%) |
| 45 to 59 Minutes | 33 (21.8%) | 5 (6.3%) |
| 60 to 89 Minutes | 3 (2.0%) | 1 (1.3%) |
| 90 or more Minutes | 8 (5.3%) | 0 (0.0%) |
Time of Departure to Work by Sex in Mound City
The most frequent times of departure to work in Mound City are 8:30 AM to 8:59 AM (59, 39.1%) for males and 8:00 AM to 8:29 AM (30, 38.0%) for females.
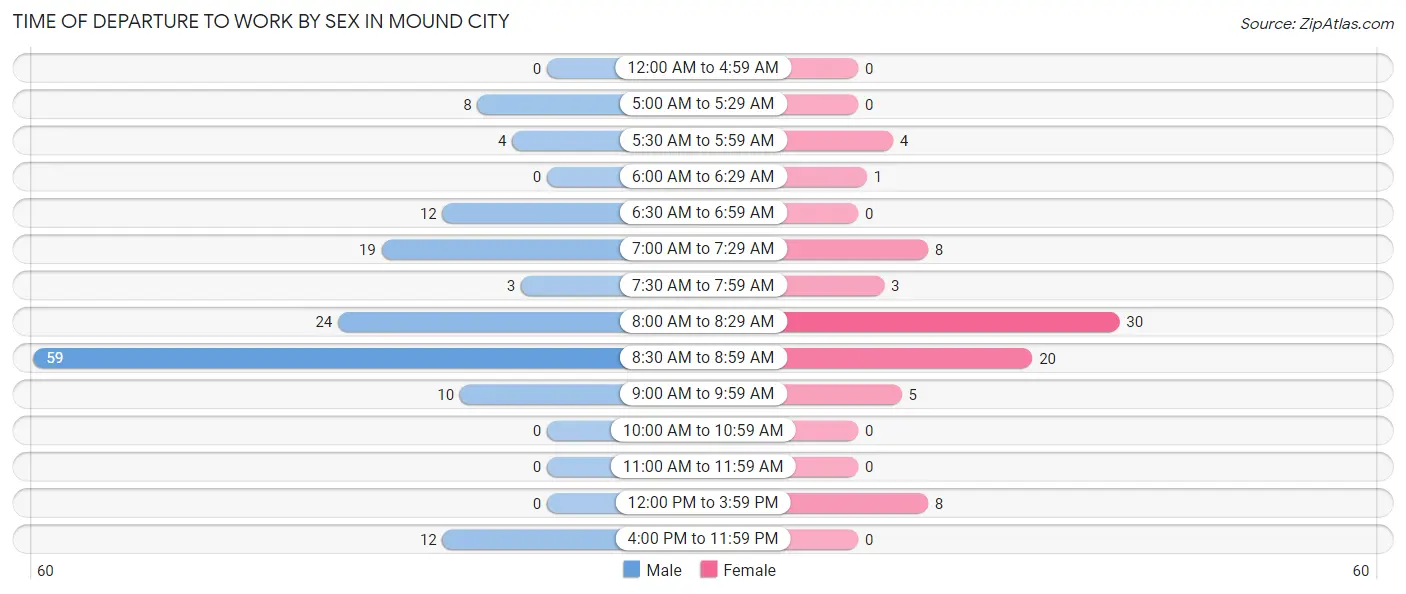
| Time of Departure | Male | Female |
| 12:00 AM to 4:59 AM | 0 (0.0%) | 0 (0.0%) |
| 5:00 AM to 5:29 AM | 8 (5.3%) | 0 (0.0%) |
| 5:30 AM to 5:59 AM | 4 (2.6%) | 4 (5.1%) |
| 6:00 AM to 6:29 AM | 0 (0.0%) | 1 (1.3%) |
| 6:30 AM to 6:59 AM | 12 (8.0%) | 0 (0.0%) |
| 7:00 AM to 7:29 AM | 19 (12.6%) | 8 (10.1%) |
| 7:30 AM to 7:59 AM | 3 (2.0%) | 3 (3.8%) |
| 8:00 AM to 8:29 AM | 24 (15.9%) | 30 (38.0%) |
| 8:30 AM to 8:59 AM | 59 (39.1%) | 20 (25.3%) |
| 9:00 AM to 9:59 AM | 10 (6.6%) | 5 (6.3%) |
| 10:00 AM to 10:59 AM | 0 (0.0%) | 0 (0.0%) |
| 11:00 AM to 11:59 AM | 0 (0.0%) | 0 (0.0%) |
| 12:00 PM to 3:59 PM | 0 (0.0%) | 8 (10.1%) |
| 4:00 PM to 11:59 PM | 12 (8.0%) | 0 (0.0%) |
| Total | 151 (100.0%) | 79 (100.0%) |
Housing Occupancy in Mound City
Occupancy by Ownership in Mound City
Of the total 232 dwellings in Mound City, owner-occupied units account for 103 (44.4%), while renter-occupied units make up 129 (55.6%).
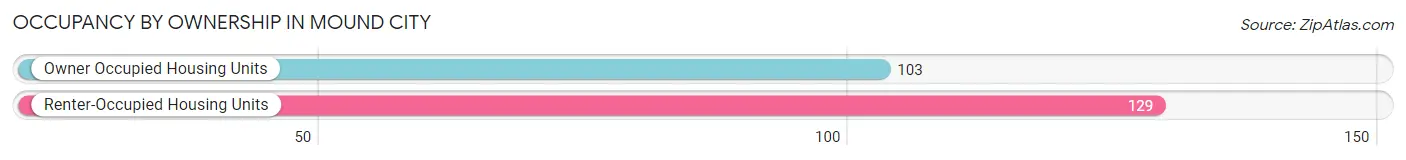
| Occupancy | # Housing Units | % Housing Units |
| Owner Occupied Housing Units | 103 | 44.4% |
| Renter-Occupied Housing Units | 129 | 55.6% |
| Total Occupied Housing Units | 232 | 100.0% |
Occupancy by Household Size in Mound City
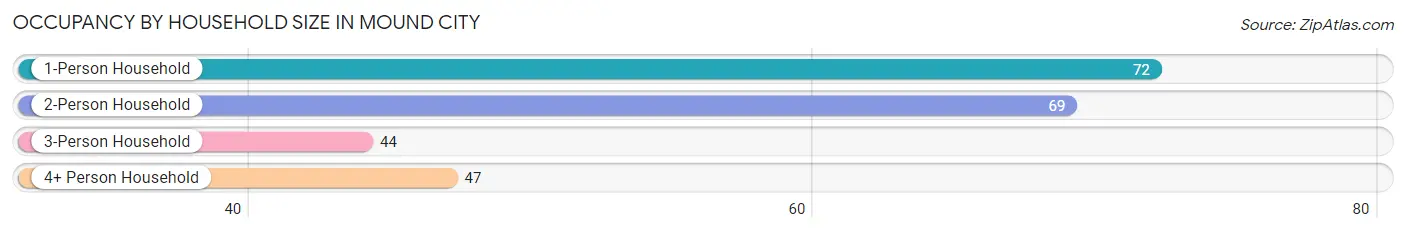
| Household Size | # Housing Units | % Housing Units |
| 1-Person Household | 72 | 31.0% |
| 2-Person Household | 69 | 29.7% |
| 3-Person Household | 44 | 19.0% |
| 4+ Person Household | 47 | 20.3% |
| Total Housing Units | 232 | 100.0% |
Occupancy by Ownership by Household Size in Mound City
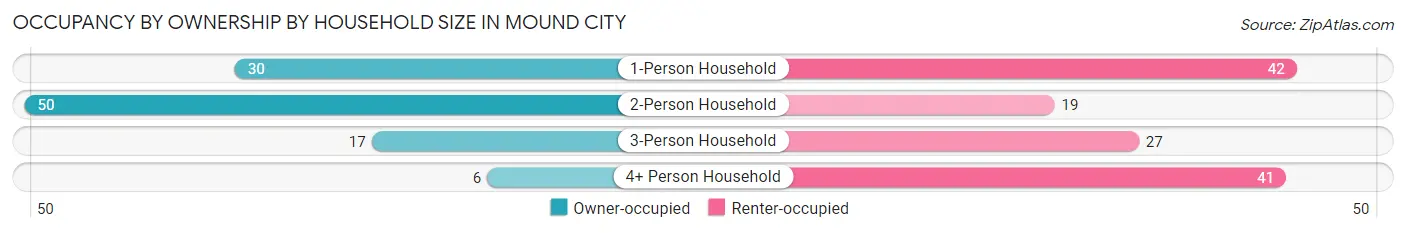
| Household Size | Owner-occupied | Renter-occupied |
| 1-Person Household | 30 (41.7%) | 42 (58.3%) |
| 2-Person Household | 50 (72.5%) | 19 (27.5%) |
| 3-Person Household | 17 (38.6%) | 27 (61.4%) |
| 4+ Person Household | 6 (12.8%) | 41 (87.2%) |
| Total Housing Units | 103 (44.4%) | 129 (55.6%) |
Occupancy by Educational Attainment in Mound City
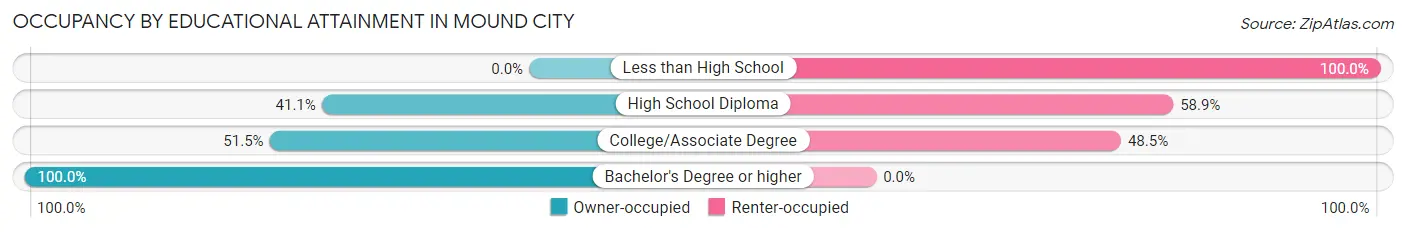
| Household Size | Owner-occupied | Renter-occupied |
| Less than High School | 0 (0.0%) | 26 (100.0%) |
| High School Diploma | 37 (41.1%) | 53 (58.9%) |
| College/Associate Degree | 53 (51.5%) | 50 (48.5%) |
| Bachelor's Degree or higher | 13 (100.0%) | 0 (0.0%) |
Occupancy by Age of Householder in Mound City
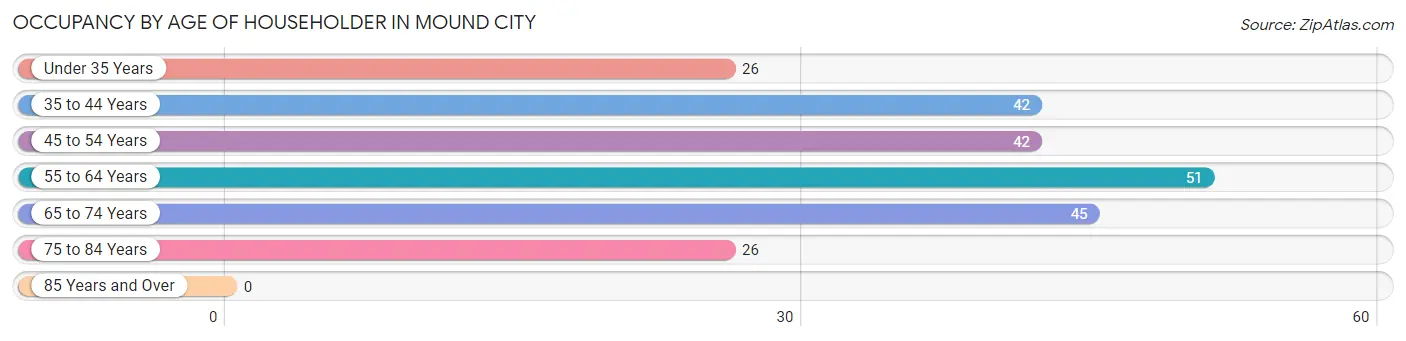
| Age Bracket | # Households | % Households |
| Under 35 Years | 26 | 11.2% |
| 35 to 44 Years | 42 | 18.1% |
| 45 to 54 Years | 42 | 18.1% |
| 55 to 64 Years | 51 | 22.0% |
| 65 to 74 Years | 45 | 19.4% |
| 75 to 84 Years | 26 | 11.2% |
| 85 Years and Over | 0 | 0.0% |
| Total | 232 | 100.0% |
Housing Finances in Mound City
Median Income by Occupancy in Mound City
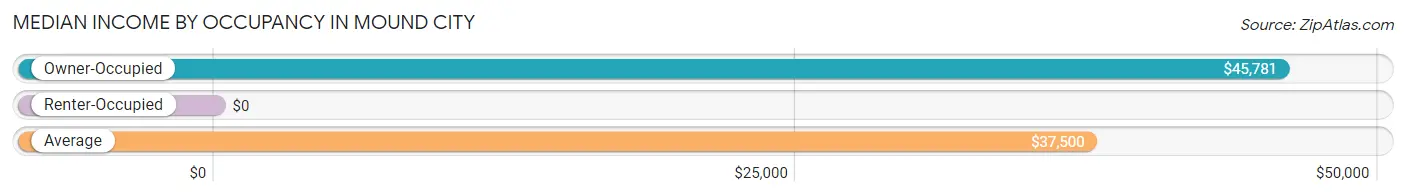
| Occupancy Type | # Households | Median Income |
| Owner-Occupied | 103 (44.4%) | $45,781 |
| Renter-Occupied | 129 (55.6%) | $0 |
| Average | 232 (100.0%) | $37,500 |
Occupancy by Householder Income Bracket in Mound City
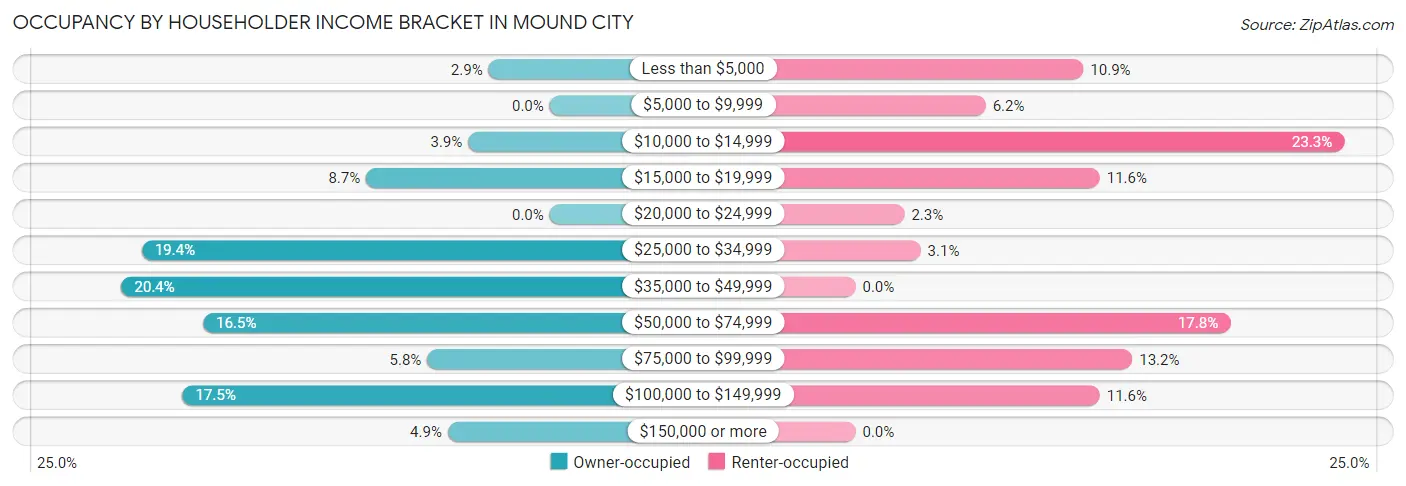
| Income Bracket | Owner-occupied | Renter-occupied |
| Less than $5,000 | 3 (2.9%) | 14 (10.8%) |
| $5,000 to $9,999 | 0 (0.0%) | 8 (6.2%) |
| $10,000 to $14,999 | 4 (3.9%) | 30 (23.3%) |
| $15,000 to $19,999 | 9 (8.7%) | 15 (11.6%) |
| $20,000 to $24,999 | 0 (0.0%) | 3 (2.3%) |
| $25,000 to $34,999 | 20 (19.4%) | 4 (3.1%) |
| $35,000 to $49,999 | 21 (20.4%) | 0 (0.0%) |
| $50,000 to $74,999 | 17 (16.5%) | 23 (17.8%) |
| $75,000 to $99,999 | 6 (5.8%) | 17 (13.2%) |
| $100,000 to $149,999 | 18 (17.5%) | 15 (11.6%) |
| $150,000 or more | 5 (4.9%) | 0 (0.0%) |
| Total | 103 (100.0%) | 129 (100.0%) |
Monthly Housing Cost Tiers in Mound City
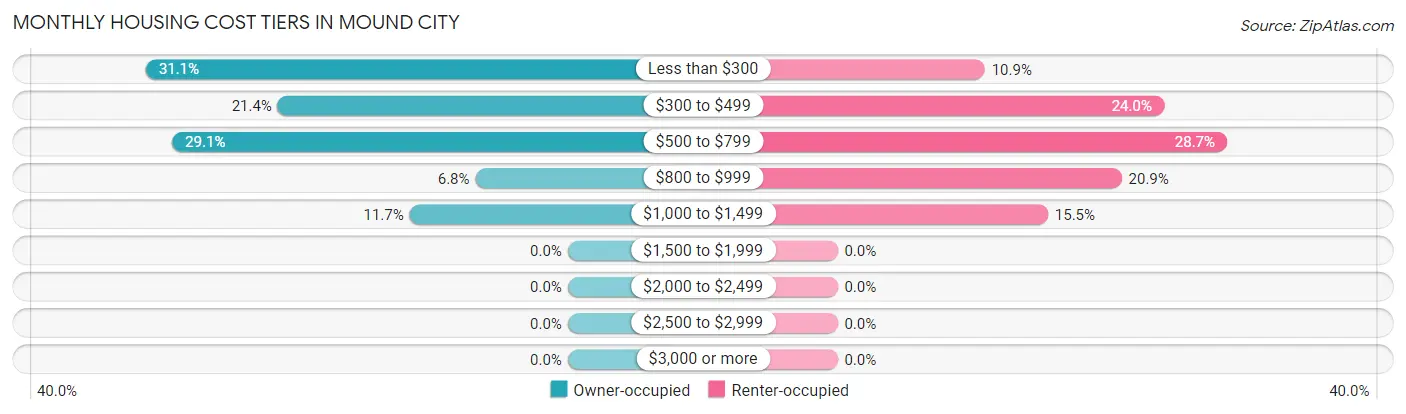
| Monthly Cost | Owner-occupied | Renter-occupied |
| Less than $300 | 32 (31.1%) | 14 (10.8%) |
| $300 to $499 | 22 (21.4%) | 31 (24.0%) |
| $500 to $799 | 30 (29.1%) | 37 (28.7%) |
| $800 to $999 | 7 (6.8%) | 27 (20.9%) |
| $1,000 to $1,499 | 12 (11.7%) | 20 (15.5%) |
| $1,500 to $1,999 | 0 (0.0%) | 0 (0.0%) |
| $2,000 to $2,499 | 0 (0.0%) | 0 (0.0%) |
| $2,500 to $2,999 | 0 (0.0%) | 0 (0.0%) |
| $3,000 or more | 0 (0.0%) | 0 (0.0%) |
| Total | 103 (100.0%) | 129 (100.0%) |
Physical Housing Characteristics in Mound City
Housing Structures in Mound City
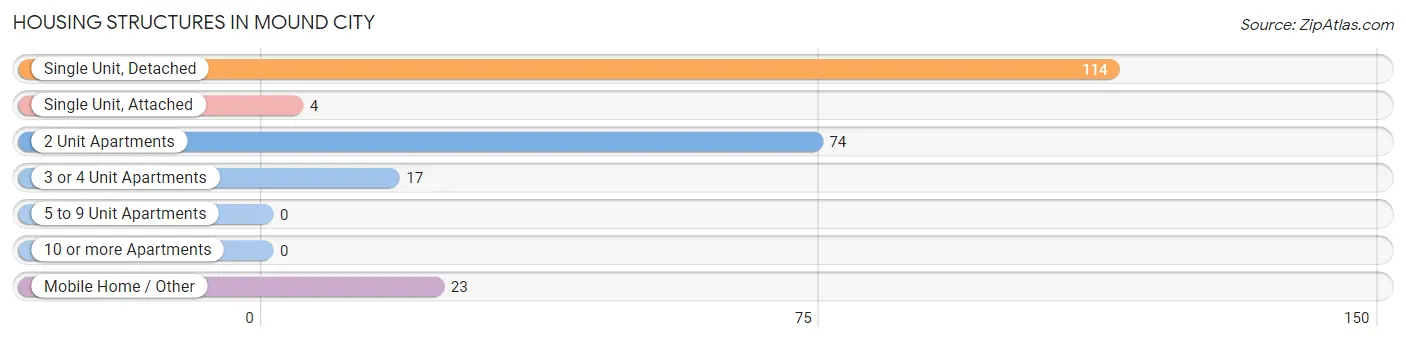
| Structure Type | # Housing Units | % Housing Units |
| Single Unit, Detached | 114 | 49.1% |
| Single Unit, Attached | 4 | 1.7% |
| 2 Unit Apartments | 74 | 31.9% |
| 3 or 4 Unit Apartments | 17 | 7.3% |
| 5 to 9 Unit Apartments | 0 | 0.0% |
| 10 or more Apartments | 0 | 0.0% |
| Mobile Home / Other | 23 | 9.9% |
| Total | 232 | 100.0% |
Housing Structures by Occupancy in Mound City
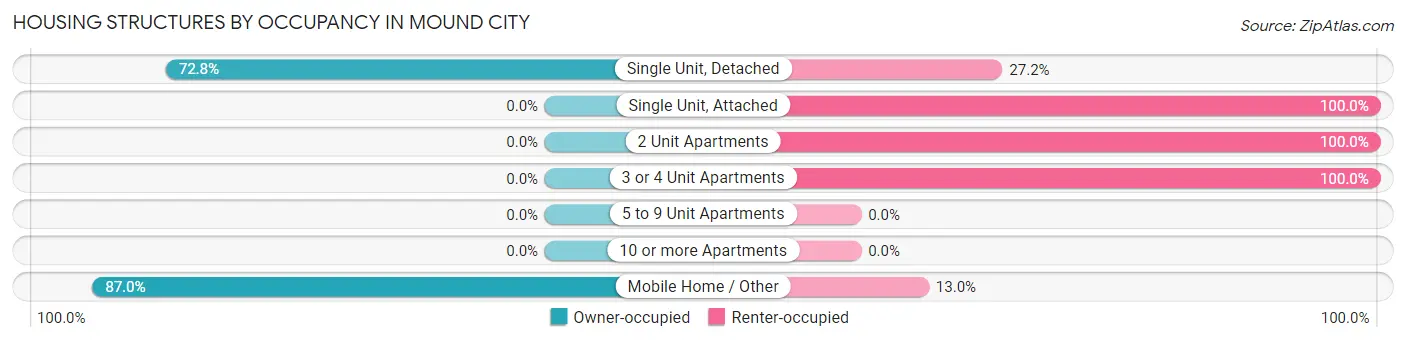
| Structure Type | Owner-occupied | Renter-occupied |
| Single Unit, Detached | 83 (72.8%) | 31 (27.2%) |
| Single Unit, Attached | 0 (0.0%) | 4 (100.0%) |
| 2 Unit Apartments | 0 (0.0%) | 74 (100.0%) |
| 3 or 4 Unit Apartments | 0 (0.0%) | 17 (100.0%) |
| 5 to 9 Unit Apartments | 0 (0.0%) | 0 (0.0%) |
| 10 or more Apartments | 0 (0.0%) | 0 (0.0%) |
| Mobile Home / Other | 20 (87.0%) | 3 (13.0%) |
| Total | 103 (44.4%) | 129 (55.6%) |
Housing Structures by Number of Rooms in Mound City
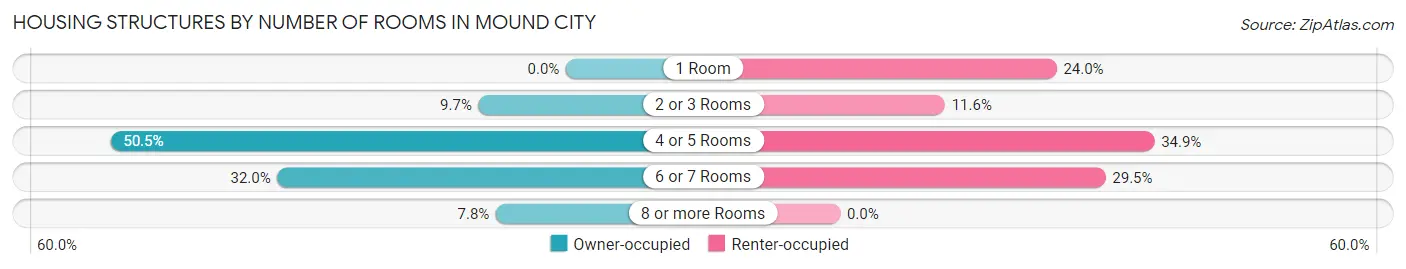
| Number of Rooms | Owner-occupied | Renter-occupied |
| 1 Room | 0 (0.0%) | 31 (24.0%) |
| 2 or 3 Rooms | 10 (9.7%) | 15 (11.6%) |
| 4 or 5 Rooms | 52 (50.5%) | 45 (34.9%) |
| 6 or 7 Rooms | 33 (32.0%) | 38 (29.5%) |
| 8 or more Rooms | 8 (7.8%) | 0 (0.0%) |
| Total | 103 (100.0%) | 129 (100.0%) |
Housing Structure by Heating Type in Mound City
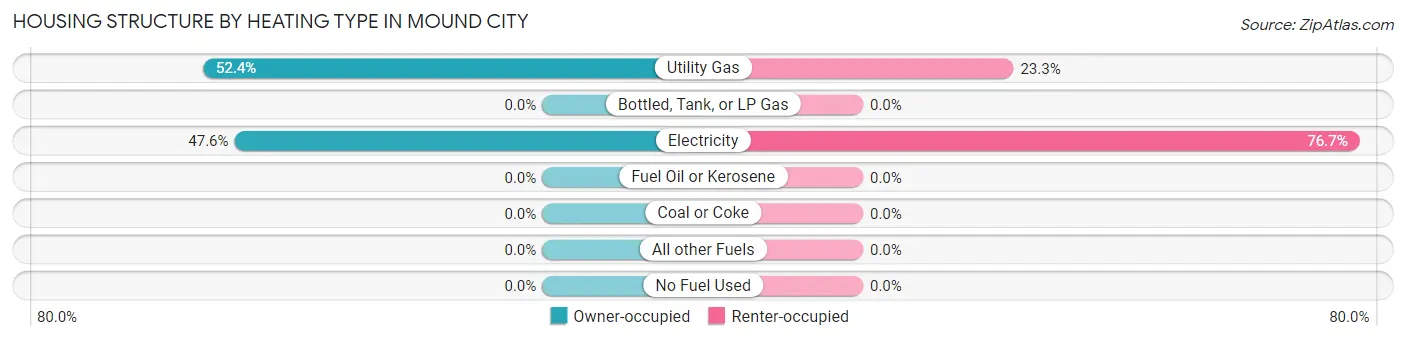
| Heating Type | Owner-occupied | Renter-occupied |
| Utility Gas | 54 (52.4%) | 30 (23.3%) |
| Bottled, Tank, or LP Gas | 0 (0.0%) | 0 (0.0%) |
| Electricity | 49 (47.6%) | 99 (76.7%) |
| Fuel Oil or Kerosene | 0 (0.0%) | 0 (0.0%) |
| Coal or Coke | 0 (0.0%) | 0 (0.0%) |
| All other Fuels | 0 (0.0%) | 0 (0.0%) |
| No Fuel Used | 0 (0.0%) | 0 (0.0%) |
| Total | 103 (100.0%) | 129 (100.0%) |
Household Vehicle Usage in Mound City
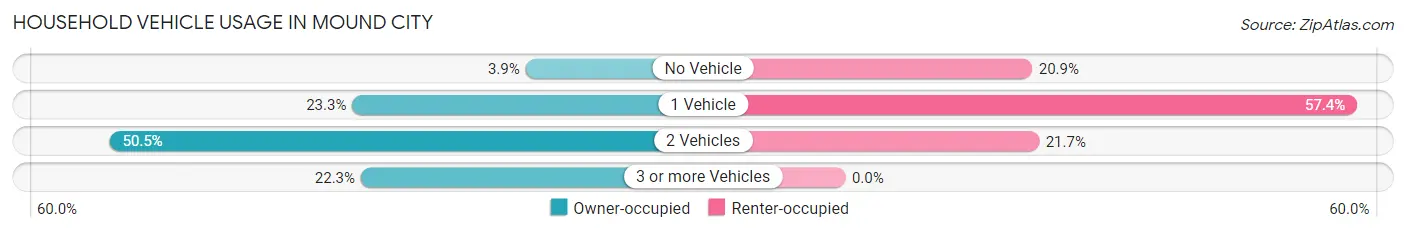
| Vehicles per Household | Owner-occupied | Renter-occupied |
| No Vehicle | 4 (3.9%) | 27 (20.9%) |
| 1 Vehicle | 24 (23.3%) | 74 (57.4%) |
| 2 Vehicles | 52 (50.5%) | 28 (21.7%) |
| 3 or more Vehicles | 23 (22.3%) | 0 (0.0%) |
| Total | 103 (100.0%) | 129 (100.0%) |
Real Estate & Mortgages in Mound City
Real Estate and Mortgage Overview in Mound City
| Characteristic | Without Mortgage | With Mortgage |
| Housing Units | 77 | 26 |
| Median Property Value | $37,500 | $54,700 |
| Median Household Income | $45,156 | $0 |
| Monthly Housing Costs | $333 | $0 |
| Real Estate Taxes | $463 | $14 |
Property Value by Mortgage Status in Mound City
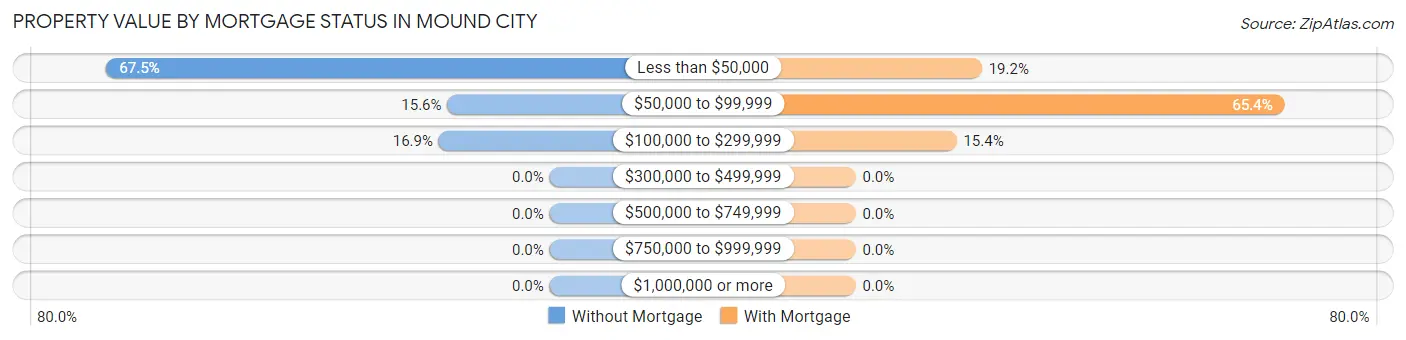
| Property Value | Without Mortgage | With Mortgage |
| Less than $50,000 | 52 (67.5%) | 5 (19.2%) |
| $50,000 to $99,999 | 12 (15.6%) | 17 (65.4%) |
| $100,000 to $299,999 | 13 (16.9%) | 4 (15.4%) |
| $300,000 to $499,999 | 0 (0.0%) | 0 (0.0%) |
| $500,000 to $749,999 | 0 (0.0%) | 0 (0.0%) |
| $750,000 to $999,999 | 0 (0.0%) | 0 (0.0%) |
| $1,000,000 or more | 0 (0.0%) | 0 (0.0%) |
| Total | 77 (100.0%) | 26 (100.0%) |
Household Income by Mortgage Status in Mound City
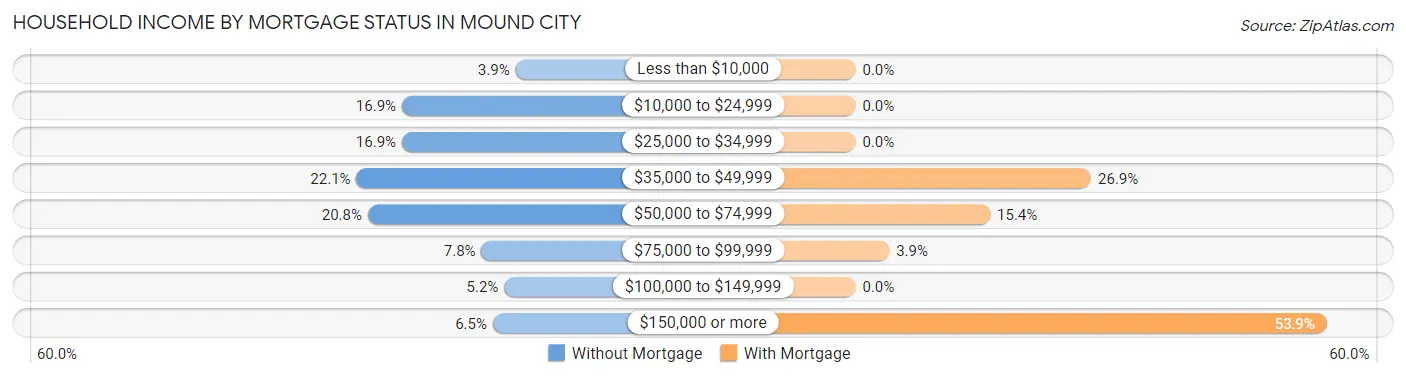
| Household Income | Without Mortgage | With Mortgage |
| Less than $10,000 | 3 (3.9%) | 0 (0.0%) |
| $10,000 to $24,999 | 13 (16.9%) | 0 (0.0%) |
| $25,000 to $34,999 | 13 (16.9%) | 0 (0.0%) |
| $35,000 to $49,999 | 17 (22.1%) | 7 (26.9%) |
| $50,000 to $74,999 | 16 (20.8%) | 4 (15.4%) |
| $75,000 to $99,999 | 6 (7.8%) | 1 (3.8%) |
| $100,000 to $149,999 | 4 (5.2%) | 0 (0.0%) |
| $150,000 or more | 5 (6.5%) | 14 (53.8%) |
| Total | 77 (100.0%) | 26 (100.0%) |
Property Value to Household Income Ratio in Mound City
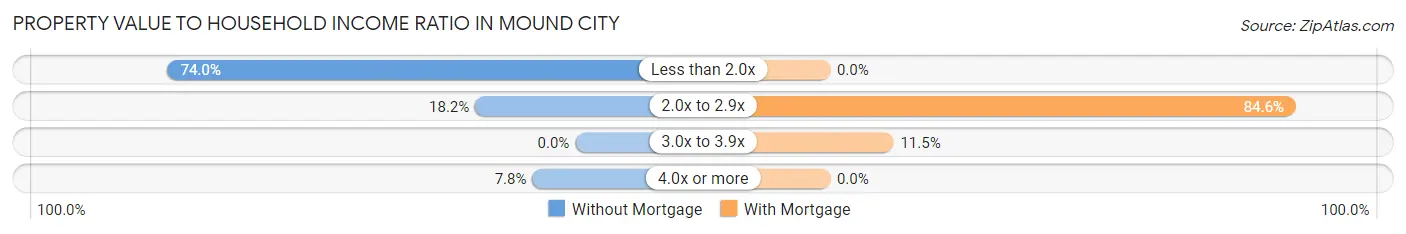
| Value-to-Income Ratio | Without Mortgage | With Mortgage |
| Less than 2.0x | 57 (74.0%) | 0 (0.0%) |
| 2.0x to 2.9x | 14 (18.2%) | 22 (84.6%) |
| 3.0x to 3.9x | 0 (0.0%) | 3 (11.5%) |
| 4.0x or more | 6 (7.8%) | 0 (0.0%) |
| Total | 77 (100.0%) | 26 (100.0%) |
Real Estate Taxes by Mortgage Status in Mound City
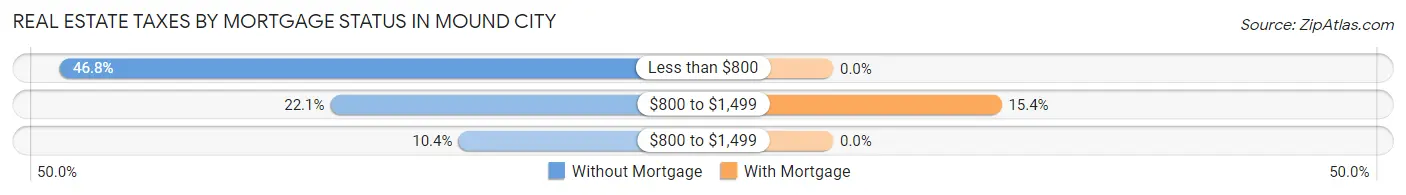
| Property Taxes | Without Mortgage | With Mortgage |
| Less than $800 | 36 (46.8%) | 0 (0.0%) |
| $800 to $1,499 | 17 (22.1%) | 4 (15.4%) |
| $800 to $1,499 | 8 (10.4%) | 0 (0.0%) |
| Total | 77 (100.0%) | 26 (100.0%) |
Health & Disability in Mound City
Health Insurance Coverage by Age in Mound City
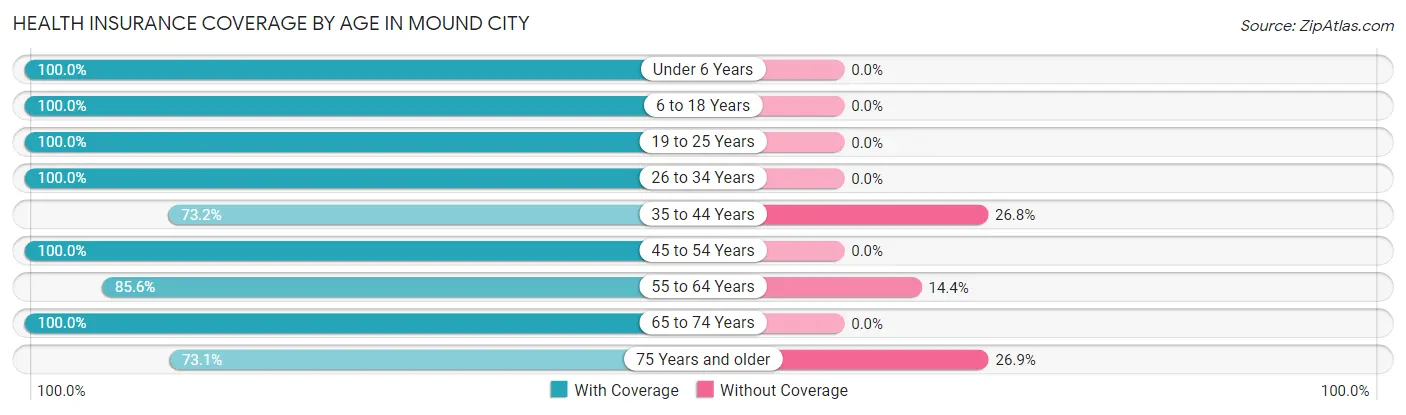
| Age Bracket | With Coverage | Without Coverage |
| Under 6 Years | 44 (100.0%) | 0 (0.0%) |
| 6 to 18 Years | 194 (100.0%) | 0 (0.0%) |
| 19 to 25 Years | 61 (100.0%) | 0 (0.0%) |
| 26 to 34 Years | 26 (100.0%) | 0 (0.0%) |
| 35 to 44 Years | 142 (73.2%) | 52 (26.8%) |
| 45 to 54 Years | 49 (100.0%) | 0 (0.0%) |
| 55 to 64 Years | 89 (85.6%) | 15 (14.4%) |
| 65 to 74 Years | 74 (100.0%) | 0 (0.0%) |
| 75 Years and older | 38 (73.1%) | 14 (26.9%) |
| Total | 717 (89.8%) | 81 (10.2%) |
Health Insurance Coverage by Citizenship Status in Mound City
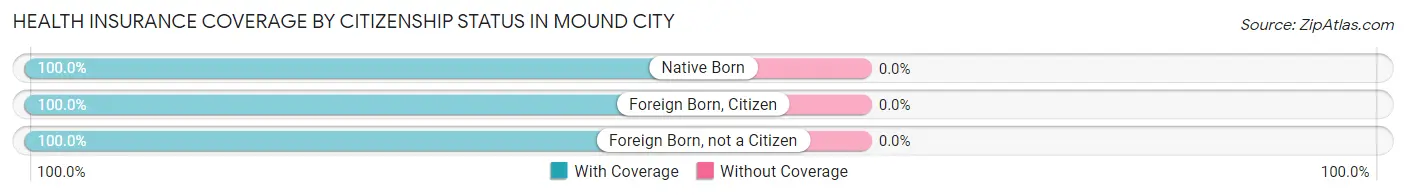
| Citizenship Status | With Coverage | Without Coverage |
| Native Born | 44 (100.0%) | 0 (0.0%) |
| Foreign Born, Citizen | 194 (100.0%) | 0 (0.0%) |
| Foreign Born, not a Citizen | 61 (100.0%) | 0 (0.0%) |
Health Insurance Coverage by Household Income in Mound City
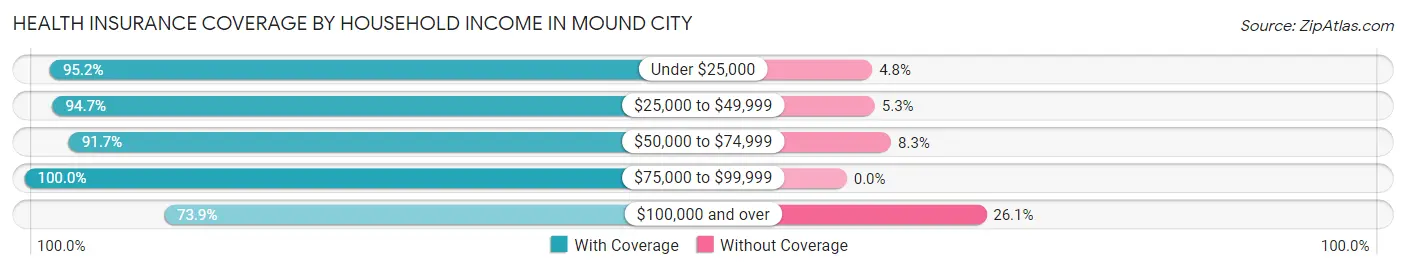
| Household Income | With Coverage | Without Coverage |
| Under $25,000 | 160 (95.2%) | 8 (4.8%) |
| $25,000 to $49,999 | 108 (94.7%) | 6 (5.3%) |
| $50,000 to $74,999 | 232 (91.7%) | 21 (8.3%) |
| $75,000 to $99,999 | 87 (100.0%) | 0 (0.0%) |
| $100,000 and over | 130 (73.9%) | 46 (26.1%) |
Public vs Private Health Insurance Coverage by Age in Mound City
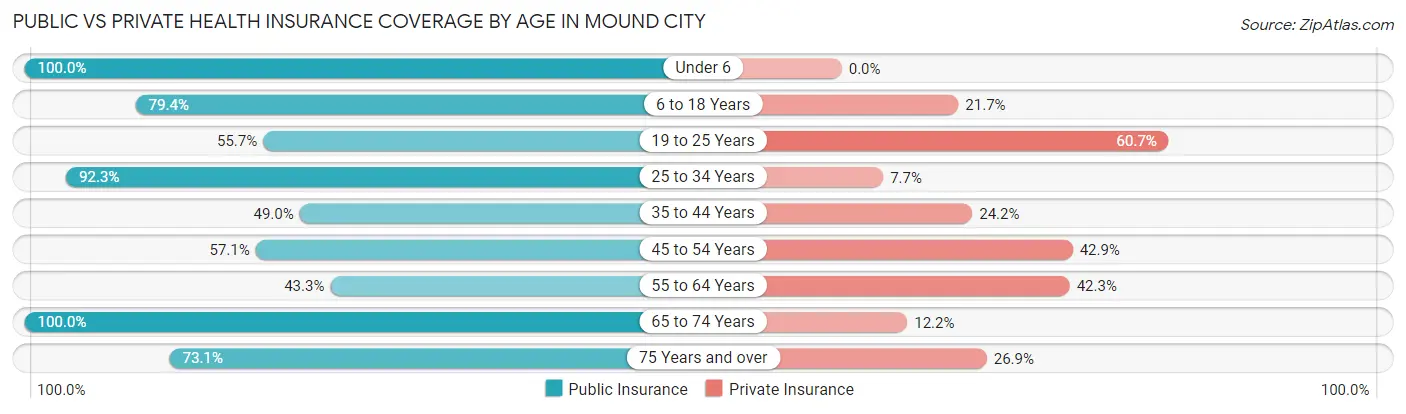
| Age Bracket | Public Insurance | Private Insurance |
| Under 6 | 44 (100.0%) | 0 (0.0%) |
| 6 to 18 Years | 154 (79.4%) | 42 (21.6%) |
| 19 to 25 Years | 34 (55.7%) | 37 (60.7%) |
| 25 to 34 Years | 24 (92.3%) | 2 (7.7%) |
| 35 to 44 Years | 95 (49.0%) | 47 (24.2%) |
| 45 to 54 Years | 28 (57.1%) | 21 (42.9%) |
| 55 to 64 Years | 45 (43.3%) | 44 (42.3%) |
| 65 to 74 Years | 74 (100.0%) | 9 (12.2%) |
| 75 Years and over | 38 (73.1%) | 14 (26.9%) |
| Total | 536 (67.2%) | 216 (27.1%) |
Disability Status by Sex by Age in Mound City
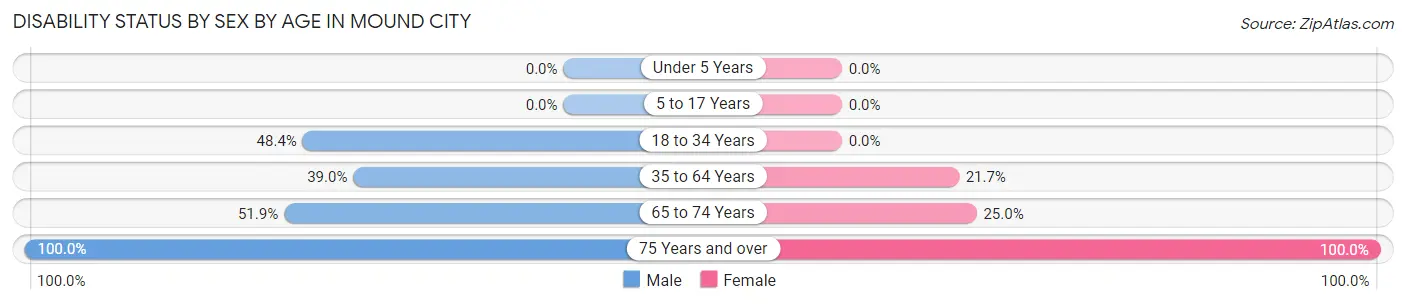
| Age Bracket | Male | Female |
| Under 5 Years | 0 (0.0%) | 0 (0.0%) |
| 5 to 17 Years | 0 (0.0%) | 0 (0.0%) |
| 18 to 34 Years | 30 (48.4%) | 0 (0.0%) |
| 35 to 64 Years | 94 (39.0%) | 23 (21.7%) |
| 65 to 74 Years | 28 (51.8%) | 5 (25.0%) |
| 75 Years and over | 17 (100.0%) | 35 (100.0%) |
Disability Class by Sex by Age in Mound City
Disability Class: Hearing Difficulty
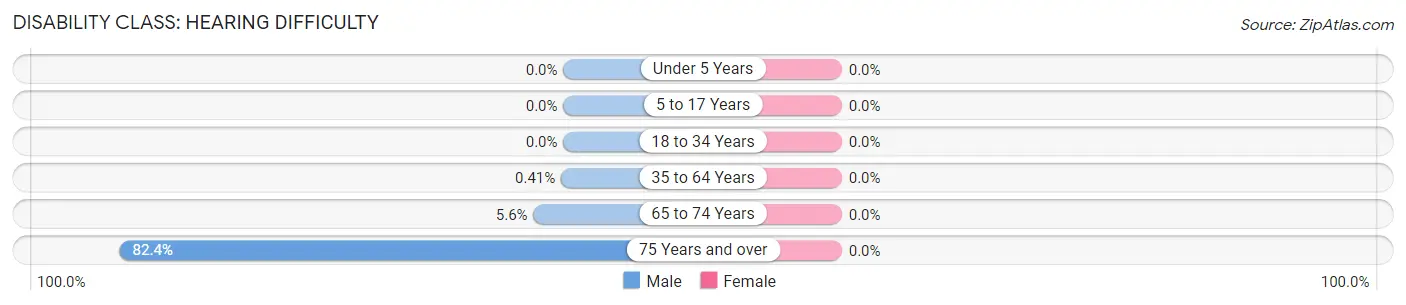
| Age Bracket | Male | Female |
| Under 5 Years | 0 (0.0%) | 0 (0.0%) |
| 5 to 17 Years | 0 (0.0%) | 0 (0.0%) |
| 18 to 34 Years | 0 (0.0%) | 0 (0.0%) |
| 35 to 64 Years | 1 (0.4%) | 0 (0.0%) |
| 65 to 74 Years | 3 (5.6%) | 0 (0.0%) |
| 75 Years and over | 14 (82.4%) | 0 (0.0%) |
Disability Class: Vision Difficulty
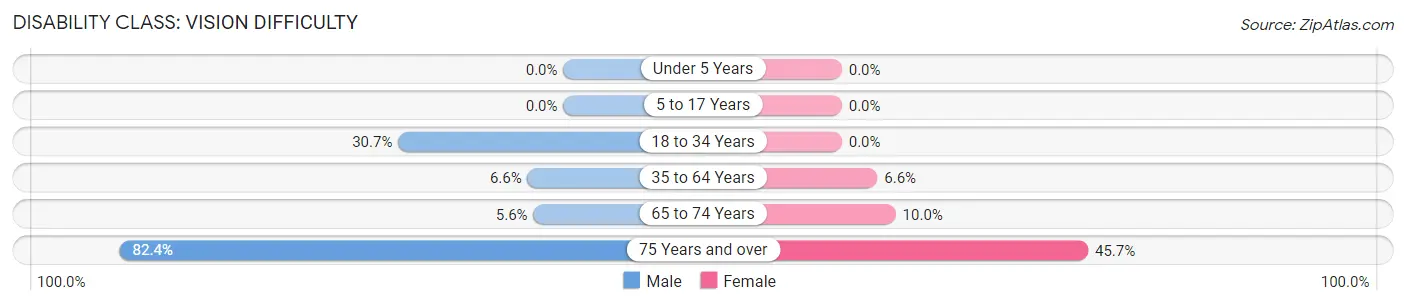
| Age Bracket | Male | Female |
| Under 5 Years | 0 (0.0%) | 0 (0.0%) |
| 5 to 17 Years | 0 (0.0%) | 0 (0.0%) |
| 18 to 34 Years | 19 (30.6%) | 0 (0.0%) |
| 35 to 64 Years | 16 (6.6%) | 7 (6.6%) |
| 65 to 74 Years | 3 (5.6%) | 2 (10.0%) |
| 75 Years and over | 14 (82.4%) | 16 (45.7%) |
Disability Class: Cognitive Difficulty
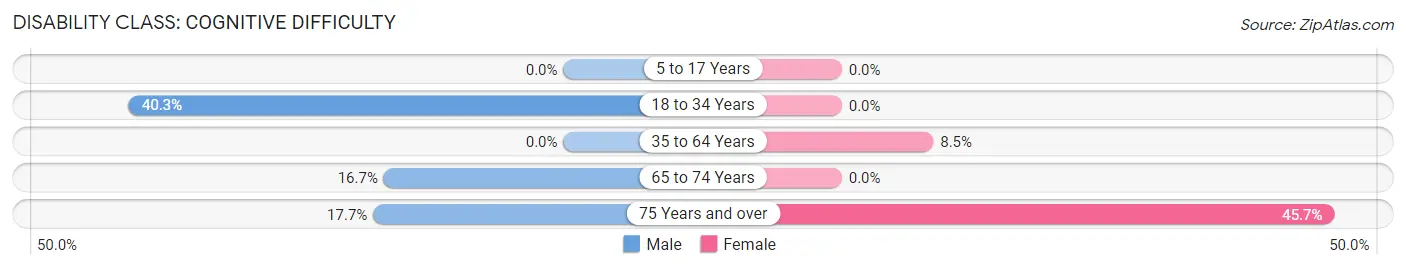
| Age Bracket | Male | Female |
| 5 to 17 Years | 0 (0.0%) | 0 (0.0%) |
| 18 to 34 Years | 25 (40.3%) | 0 (0.0%) |
| 35 to 64 Years | 0 (0.0%) | 9 (8.5%) |
| 65 to 74 Years | 9 (16.7%) | 0 (0.0%) |
| 75 Years and over | 3 (17.6%) | 16 (45.7%) |
Disability Class: Ambulatory Difficulty
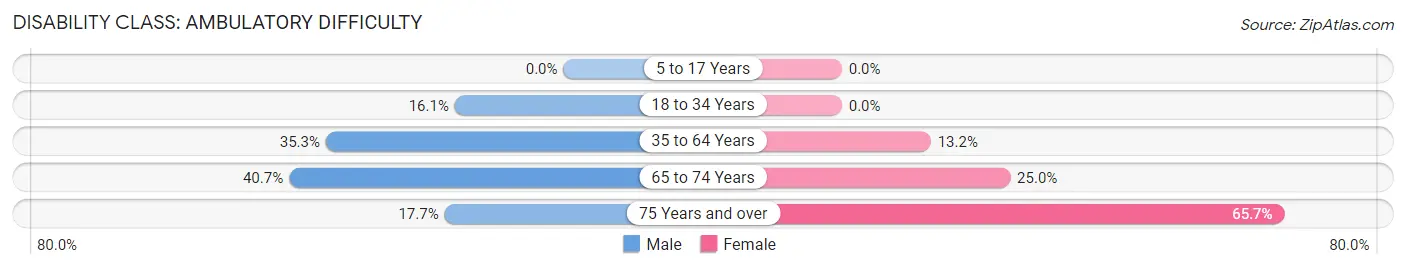
| Age Bracket | Male | Female |
| 5 to 17 Years | 0 (0.0%) | 0 (0.0%) |
| 18 to 34 Years | 10 (16.1%) | 0 (0.0%) |
| 35 to 64 Years | 85 (35.3%) | 14 (13.2%) |
| 65 to 74 Years | 22 (40.7%) | 5 (25.0%) |
| 75 Years and over | 3 (17.6%) | 23 (65.7%) |
Disability Class: Self-Care Difficulty
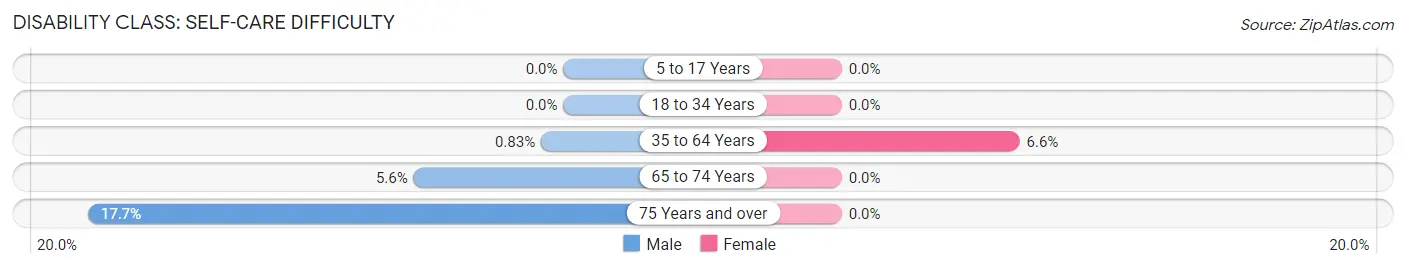
| Age Bracket | Male | Female |
| 5 to 17 Years | 0 (0.0%) | 0 (0.0%) |
| 18 to 34 Years | 0 (0.0%) | 0 (0.0%) |
| 35 to 64 Years | 2 (0.8%) | 7 (6.6%) |
| 65 to 74 Years | 3 (5.6%) | 0 (0.0%) |
| 75 Years and over | 3 (17.6%) | 0 (0.0%) |
Technology Access in Mound City
Computing Device Access in Mound City
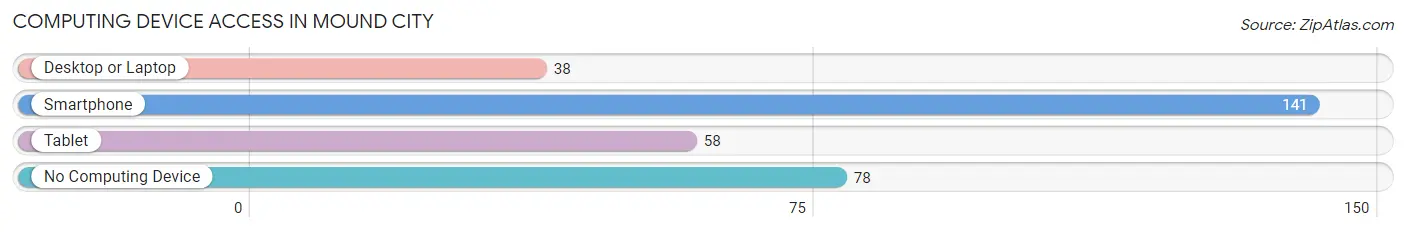
| Device Type | # Households | % Households |
| Desktop or Laptop | 38 | 16.4% |
| Smartphone | 141 | 60.8% |
| Tablet | 58 | 25.0% |
| No Computing Device | 78 | 33.6% |
| Total | 232 | 100.0% |
Internet Access in Mound City
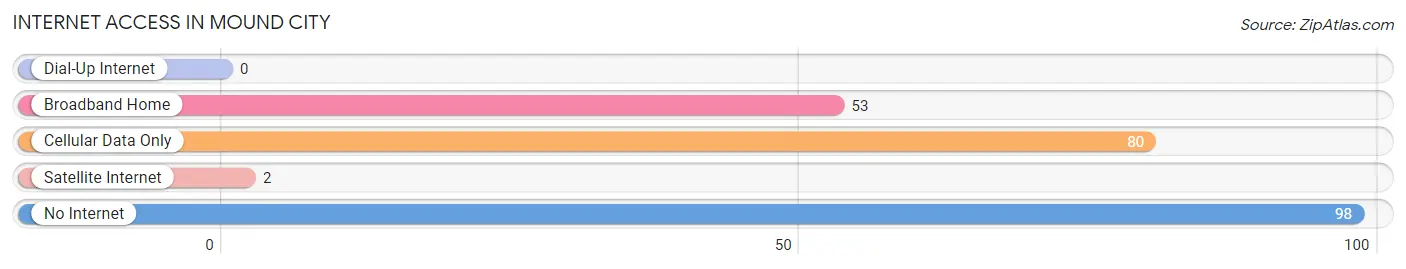
| Internet Type | # Households | % Households |
| Dial-Up Internet | 0 | 0.0% |
| Broadband Home | 53 | 22.8% |
| Cellular Data Only | 80 | 34.5% |
| Satellite Internet | 2 | 0.9% |
| No Internet | 98 | 42.2% |
| Total | 232 | 100.0% |
Mound City Summary
Mound City is a small city located in Pulaski County, Illinois, United States. It is situated on the banks of the Ohio River, approximately 20 miles south of Paducah, Kentucky. The city has a population of 1,845 as of the 2010 census.
History
Mound City was founded in 1839 by a group of settlers from Kentucky. The city was named after the nearby mounds, which were built by Native Americans centuries before. The mounds were used as burial sites and for ceremonial purposes.
The city was incorporated in 1845 and quickly became a thriving river port. It was a major stop on the Ohio River for steamboats and barges. The city was also a major center for the lumber industry, with several sawmills located in the area.
In the late 19th century, Mound City was a popular destination for tourists. The city was home to several resorts, including the Mound City Hotel, which was built in 1883. The hotel was a popular destination for wealthy visitors from the East Coast.
In the early 20th century, Mound City was a major center for the coal mining industry. The city was home to several coal mines, including the Mound City Coal Company, which operated from 1906 to 1945.
Geography
Mound City is located at 37°14'N 88°45'W (37.2333, -88.7500). The city is situated on the banks of the Ohio River, approximately 20 miles south of Paducah, Kentucky.
The city has a total area of 1.2 square miles, all of which is land. The terrain is mostly flat, with some rolling hills in the area.
Economy
Mound City's economy is largely based on agriculture and tourism. The city is home to several farms, which produce a variety of crops, including corn, soybeans, and wheat.
The city is also a popular destination for tourists. The city is home to several historic sites, including the Mound City Hotel, which was built in 1883. The hotel is now a museum and is listed on the National Register of Historic Places.
Demographics
As of the 2010 census, Mound City had a population of 1,845. The racial makeup of the city was 97.2% White, 0.7% African American, 0.2% Native American, 0.2% Asian, 0.1% Pacific Islander, 0.7% from other races, and 0.9% from two or more races. Hispanic or Latino of any race were 1.7% of the population.
The median income for a household in the city was $31,250, and the median income for a family was $37,500. Males had a median income of $30,000 versus $20,000 for females. The per capita income for the city was $15,845. About 11.2% of families and 14.2% of the population were below the poverty line, including 19.2% of those under age 18 and 8.3% of those age 65 or over.
Common Questions
What is Per Capita Income in Mound City?
Per Capita income in Mound City is $20,221.
What is the Median Family Income in Mound City?
Median Family Income in Mound City is $61,875.
What is the Median Household income in Mound City?
Median Household Income in Mound City is $37,500.
What is Family Income Deficit in Mound City?
Family Income Deficit in Mound City is $11,564.
Families that are below poverty line in Mound City earn $11,564 less on average than the poverty threshold level.
What is Inequality or Gini Index in Mound City?
Inequality or Gini Index in Mound City is 0.46.
What is the Total Population of Mound City?
Total Population of Mound City is 798.
What is the Total Male Population of Mound City?
Total Male Population of Mound City is 457.
What is the Total Female Population of Mound City?
Total Female Population of Mound City is 341.
What is the Ratio of Males per 100 Females in Mound City?
There are 134.02 Males per 100 Females in Mound City.
What is the Ratio of Females per 100 Males in Mound City?
There are 74.62 Females per 100 Males in Mound City.
What is the Median Population Age in Mound City?
Median Population Age in Mound City is 39.3 Years.
What is the Average Family Size in Mound City
Average Family Size in Mound City is 4.4 People.
What is the Average Household Size in Mound City
Average Household Size in Mound City is 3.4 People.
How Large is the Labor Force in Mound City?
There are 312 People in the Labor Forcein in Mound City.
What is the Percentage of People in the Labor Force in Mound City?
53.0% of People are in the Labor Force in Mound City.
What is the Unemployment Rate in Mound City?
Unemployment Rate in Mound City is 3.8%.