Brooklyn, IL Map & Demographics
Brooklyn Map
Brooklyn Overview
$30,523
PER CAPITA INCOME
$19,286
AVG HOUSEHOLD INCOME
15.9%
WAGE / INCOME GAP [ % ]
84.1¢/ $1
WAGE / INCOME GAP [ $ ]
$14,657
FAMILY INCOME DEFICIT
0.59
INEQUALITY / GINI INDEX
629
TOTAL POPULATION
260
MALE POPULATION
369
FEMALE POPULATION
70.46
MALES / 100 FEMALES
141.92
FEMALES / 100 MALES
29.7
MEDIAN AGE
4.0
AVG FAMILY SIZE
3.1
AVG HOUSEHOLD SIZE
307
LABOR FORCE [ PEOPLE ]
68.8%
PERCENT IN LABOR FORCE
12.1%
UNEMPLOYMENT RATE
Brooklyn Area Codes
Income in Brooklyn
Income Overview in Brooklyn
| Characteristic | Number | Measure |
| Per Capita Income | 629 | $30,523 |
| Median Family Income | 124 | $0 |
| Mean Family Income | 124 | $87,254 |
| Median Household Income | 204 | $19,286 |
| Mean Household Income | 204 | $84,438 |
| Income Deficit | 124 | $14,657 |
| Wage / Income Gap (%) | 629 | 15.85% |
| Wage / Income Gap ($) | 629 | 84.15¢ per $1 |
| Gini / Inequality Index | 629 | 0.59 |
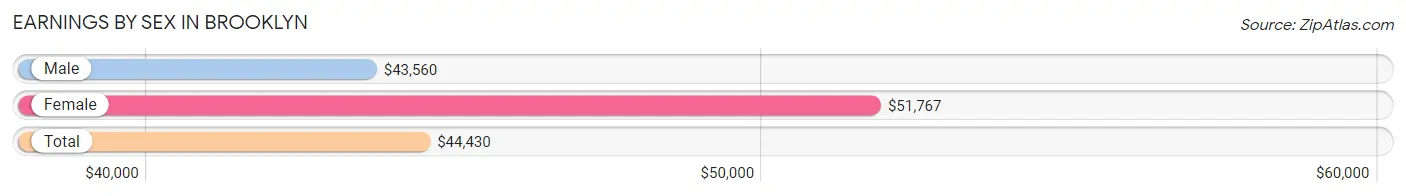
Earnings by Sex in Brooklyn
Average Earnings in Brooklyn are $44,430, $43,560 for men and $51,767 for women, a difference of 15.9%.
| Sex | Number | Average Earnings |
| Male | 93 (33.5%) | $43,560 |
| Female | 185 (66.5%) | $51,767 |
| Total | 278 (100.0%) | $44,430 |
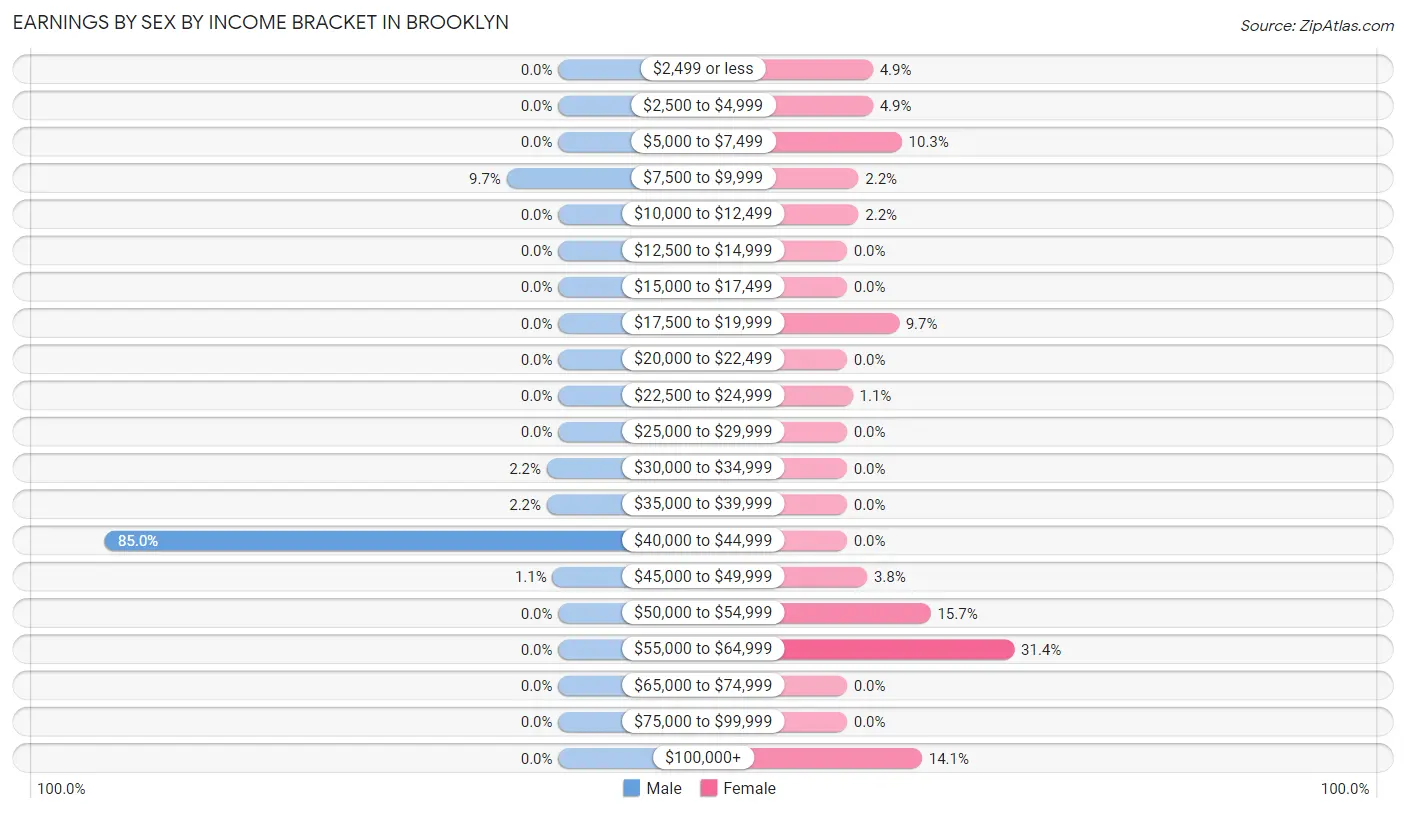
Earnings by Sex by Income Bracket in Brooklyn
The most common earnings brackets in Brooklyn are $40,000 to $44,999 for men (79 | 85.0%) and $55,000 to $64,999 for women (58 | 31.4%).
| Income | Male | Female |
| $2,499 or less | 0 (0.0%) | 9 (4.9%) |
| $2,500 to $4,999 | 0 (0.0%) | 9 (4.9%) |
| $5,000 to $7,499 | 0 (0.0%) | 19 (10.3%) |
| $7,500 to $9,999 | 9 (9.7%) | 4 (2.2%) |
| $10,000 to $12,499 | 0 (0.0%) | 4 (2.2%) |
| $12,500 to $14,999 | 0 (0.0%) | 0 (0.0%) |
| $15,000 to $17,499 | 0 (0.0%) | 0 (0.0%) |
| $17,500 to $19,999 | 0 (0.0%) | 18 (9.7%) |
| $20,000 to $22,499 | 0 (0.0%) | 0 (0.0%) |
| $22,500 to $24,999 | 0 (0.0%) | 2 (1.1%) |
| $25,000 to $29,999 | 0 (0.0%) | 0 (0.0%) |
| $30,000 to $34,999 | 2 (2.1%) | 0 (0.0%) |
| $35,000 to $39,999 | 2 (2.1%) | 0 (0.0%) |
| $40,000 to $44,999 | 79 (85.0%) | 0 (0.0%) |
| $45,000 to $49,999 | 1 (1.1%) | 7 (3.8%) |
| $50,000 to $54,999 | 0 (0.0%) | 29 (15.7%) |
| $55,000 to $64,999 | 0 (0.0%) | 58 (31.4%) |
| $65,000 to $74,999 | 0 (0.0%) | 0 (0.0%) |
| $75,000 to $99,999 | 0 (0.0%) | 0 (0.0%) |
| $100,000+ | 0 (0.0%) | 26 (14.1%) |
| Total | 93 (100.0%) | 185 (100.0%) |
Earnings by Sex by Educational Attainment in Brooklyn
| Educational Attainment | Male Income | Female Income |
| Less than High School | - | - |
| High School Diploma | - | - |
| College or Associate's Degree | - | - |
| Bachelor's Degree | - | - |
| Graduate Degree | - | - |
| Total | $43,560 | $51,940 |
Family Income in Brooklyn
Family Income Brackets in Brooklyn
According to the Brooklyn family income data, there are 63 families falling into the $150,000 to $199,999 income range, which is the most common income bracket and makes up 50.8% of all families.
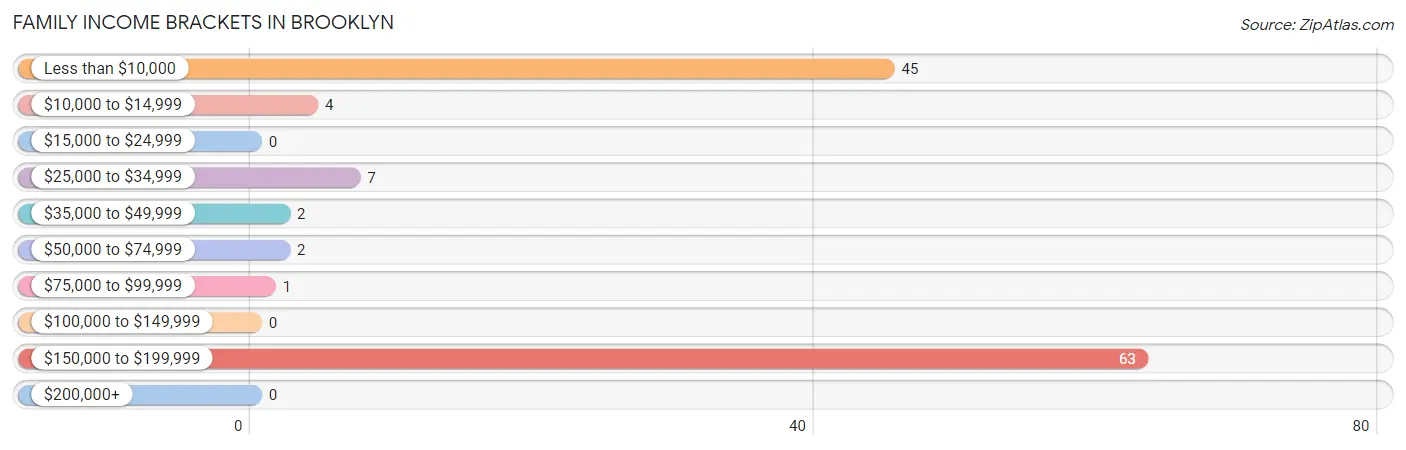
| Income Bracket | # Families | % Families |
| Less than $10,000 | 45 | 36.3% |
| $10,000 to $14,999 | 4 | 3.2% |
| $15,000 to $24,999 | 0 | 0.0% |
| $25,000 to $34,999 | 7 | 5.6% |
| $35,000 to $49,999 | 2 | 1.6% |
| $50,000 to $74,999 | 2 | 1.6% |
| $75,000 to $99,999 | 1 | 0.8% |
| $100,000 to $149,999 | 0 | 0.0% |
| $150,000 to $199,999 | 63 | 50.8% |
| $200,000+ | 0 | 0.0% |
Family Income by Famaliy Size in Brooklyn
2-person families (46 | 37.1%) account for the highest median family income in Brooklyn with $8,289 per family, while 2-person families (46 | 37.1%) have the highest median income of $4,144 per family member.
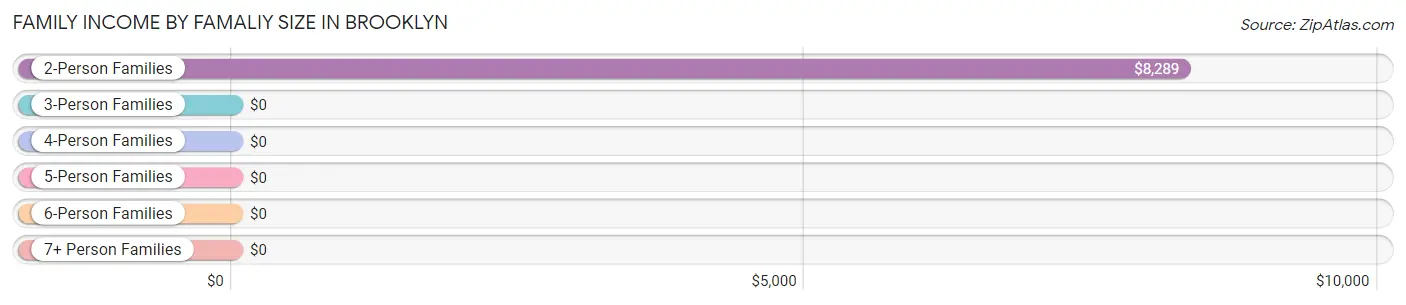
| Income Bracket | # Families | Median Income |
| 2-Person Families | 46 (37.1%) | $8,289 |
| 3-Person Families | 15 (12.1%) | $0 |
| 4-Person Families | 5 (4.0%) | $0 |
| 5-Person Families | 58 (46.8%) | $0 |
| 6-Person Families | 0 (0.0%) | $0 |
| 7+ Person Families | 0 (0.0%) | $0 |
| Total | 124 (100.0%) | $0 |
Family Income by Number of Earners in Brooklyn
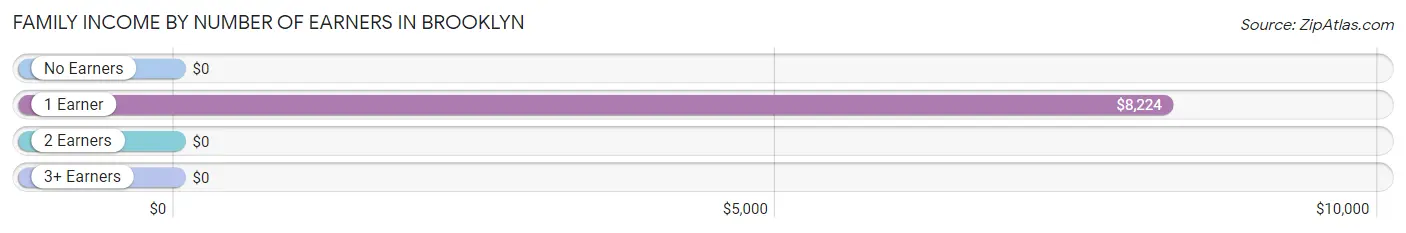
| Number of Earners | # Families | Median Income |
| No Earners | 17 (13.7%) | $0 |
| 1 Earner | 47 (37.9%) | $8,224 |
| 2 Earners | 2 (1.6%) | $0 |
| 3+ Earners | 58 (46.8%) | $0 |
| Total | 124 (100.0%) | $0 |
Household Income in Brooklyn
Household Income Brackets in Brooklyn
With 58 households falling in the category, the $200,000+ income range is the most frequent in Brooklyn, accounting for 28.4% of all households.
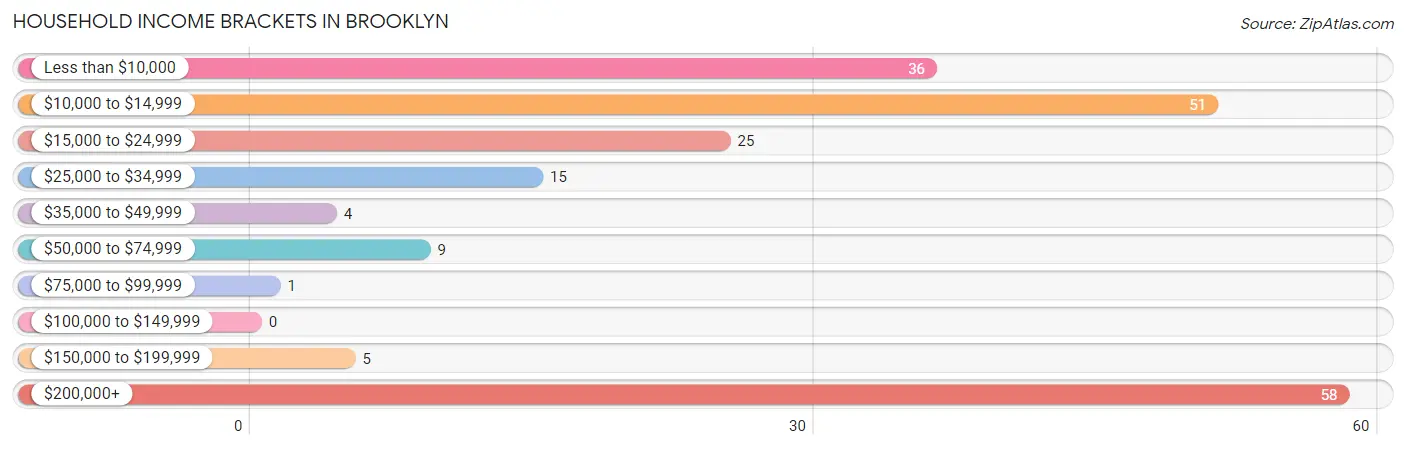
| Income Bracket | # Households | % Households |
| Less than $10,000 | 36 | 17.6% |
| $10,000 to $14,999 | 51 | 25.0% |
| $15,000 to $24,999 | 25 | 12.3% |
| $25,000 to $34,999 | 15 | 7.4% |
| $35,000 to $49,999 | 4 | 2.0% |
| $50,000 to $74,999 | 9 | 4.4% |
| $75,000 to $99,999 | 1 | 0.5% |
| $100,000 to $149,999 | 0 | 0.0% |
| $150,000 to $199,999 | 5 | 2.5% |
| $200,000+ | 58 | 28.4% |
Household Income by Householder Age in Brooklyn
The median household income in Brooklyn is $19,286, with the highest median household income of $26,429 found in the 65+ years age bracket for the primary householder. A total of 54 households (26.5%) fall into this category. Meanwhile, the 15 to 24 years age bracket for the primary householder has the lowest median household income of $0, with 4 households (2.0%) in this group.
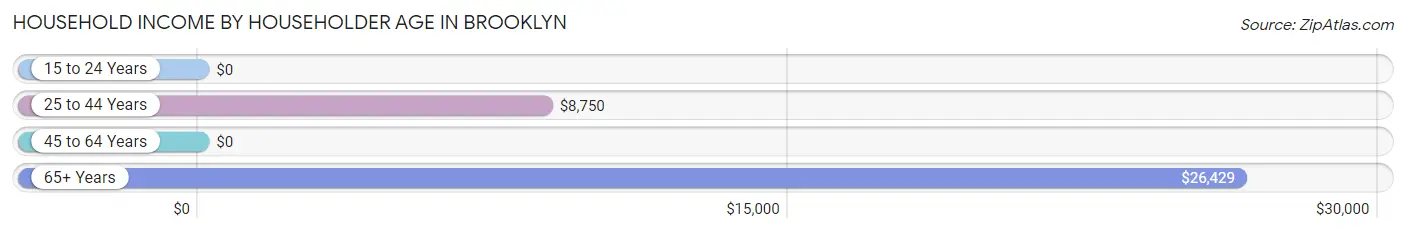
| Income Bracket | # Households | Median Income |
| 15 to 24 Years | 4 (2.0%) | $0 |
| 25 to 44 Years | 37 (18.1%) | $8,750 |
| 45 to 64 Years | 109 (53.4%) | $0 |
| 65+ Years | 54 (26.5%) | $26,429 |
| Total | 204 (100.0%) | $19,286 |
Poverty in Brooklyn
Income Below Poverty by Sex and Age in Brooklyn
With 24.6% poverty level for males and 24.4% for females among the residents of Brooklyn, 5 year old males and under 5 year old females are the most vulnerable to poverty, with 18 males (100.0%) and 5 females (100.0%) in their respective age groups living below the poverty level.
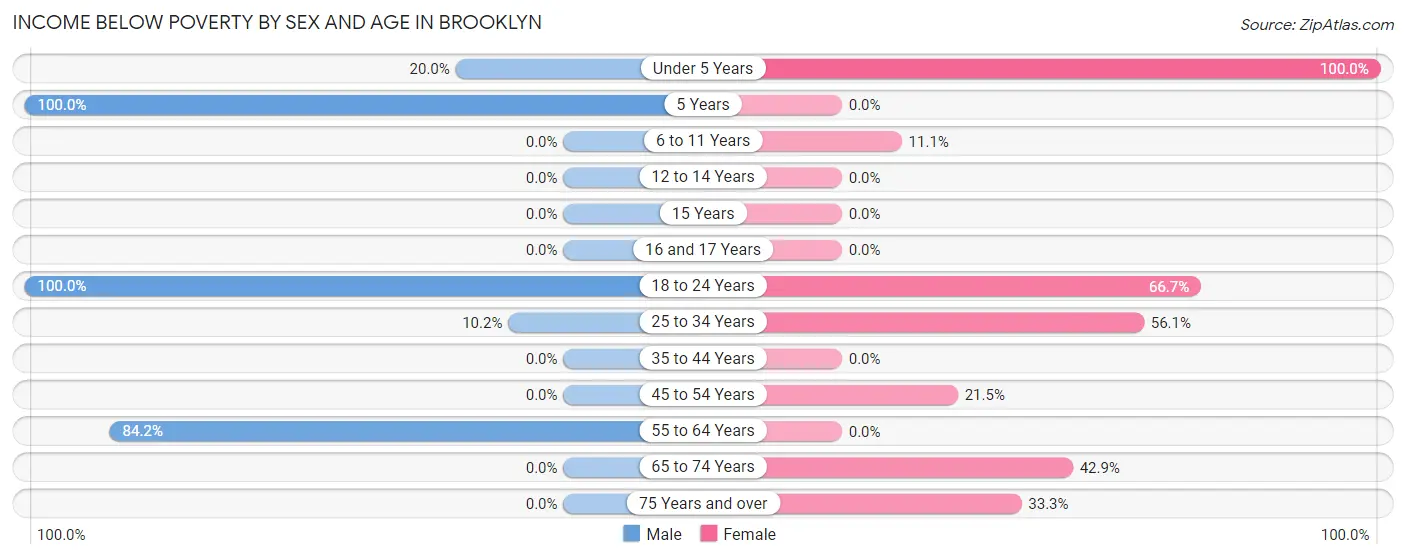
| Age Bracket | Male | Female |
| Under 5 Years | 14 (20.0%) | 5 (100.0%) |
| 5 Years | 18 (100.0%) | 0 (0.0%) |
| 6 to 11 Years | 0 (0.0%) | 7 (11.1%) |
| 12 to 14 Years | 0 (0.0%) | 0 (0.0%) |
| 15 Years | 0 (0.0%) | 0 (0.0%) |
| 16 and 17 Years | 0 (0.0%) | 0 (0.0%) |
| 18 to 24 Years | 7 (100.0%) | 4 (66.7%) |
| 25 to 34 Years | 9 (10.2%) | 37 (56.1%) |
| 35 to 44 Years | 0 (0.0%) | 0 (0.0%) |
| 45 to 54 Years | 0 (0.0%) | 17 (21.5%) |
| 55 to 64 Years | 16 (84.2%) | 0 (0.0%) |
| 65 to 74 Years | 0 (0.0%) | 18 (42.9%) |
| 75 Years and over | 0 (0.0%) | 2 (33.3%) |
| Total | 64 (24.6%) | 90 (24.4%) |
Income Above Poverty by Sex and Age in Brooklyn
According to the poverty statistics in Brooklyn, males aged 65 to 74 years and females aged 5 years are the age groups that are most secure financially, with 100.0% of males and 100.0% of females in these age groups living above the poverty line.
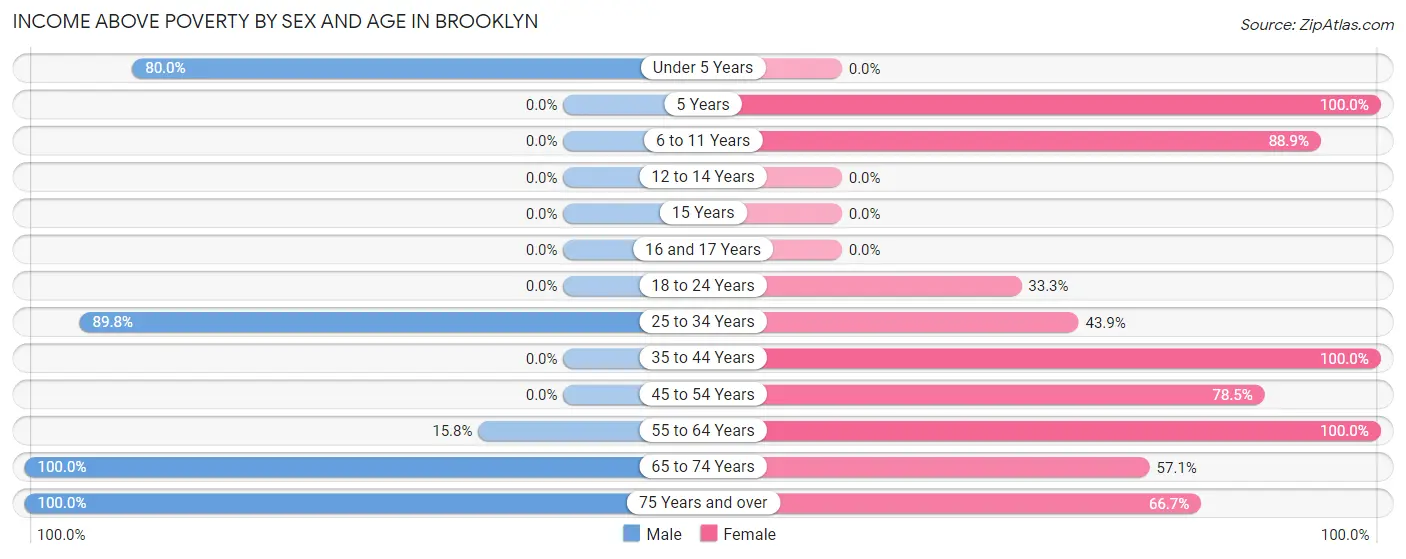
| Age Bracket | Male | Female |
| Under 5 Years | 56 (80.0%) | 0 (0.0%) |
| 5 Years | 0 (0.0%) | 27 (100.0%) |
| 6 to 11 Years | 0 (0.0%) | 56 (88.9%) |
| 12 to 14 Years | 0 (0.0%) | 0 (0.0%) |
| 15 Years | 0 (0.0%) | 0 (0.0%) |
| 16 and 17 Years | 0 (0.0%) | 0 (0.0%) |
| 18 to 24 Years | 0 (0.0%) | 2 (33.3%) |
| 25 to 34 Years | 79 (89.8%) | 29 (43.9%) |
| 35 to 44 Years | 0 (0.0%) | 55 (100.0%) |
| 45 to 54 Years | 0 (0.0%) | 62 (78.5%) |
| 55 to 64 Years | 3 (15.8%) | 20 (100.0%) |
| 65 to 74 Years | 49 (100.0%) | 24 (57.1%) |
| 75 Years and over | 9 (100.0%) | 4 (66.7%) |
| Total | 196 (75.4%) | 279 (75.6%) |
Income Below Poverty Among Married-Couple Families in Brooklyn
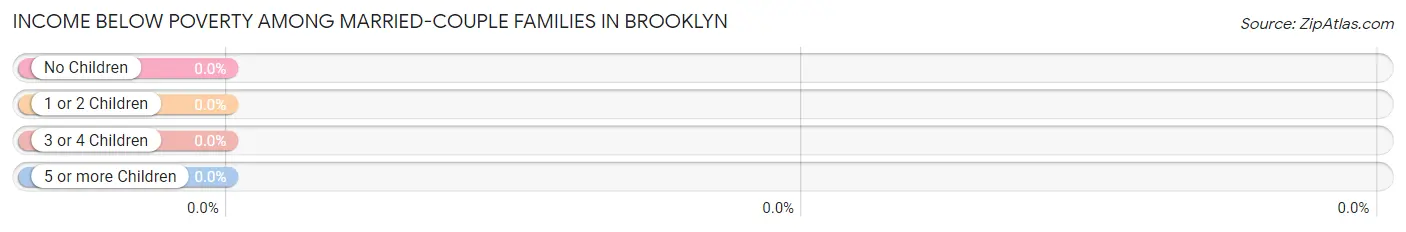
| Children | Above Poverty | Below Poverty |
| No Children | 4 (100.0%) | 0 (0.0%) |
| 1 or 2 Children | 0 (0.0%) | 0 (0.0%) |
| 3 or 4 Children | 0 (0.0%) | 0 (0.0%) |
| 5 or more Children | 0 (0.0%) | 0 (0.0%) |
| Total | 4 (100.0%) | 0 (0.0%) |
Income Below Poverty Among Single-Parent Households in Brooklyn
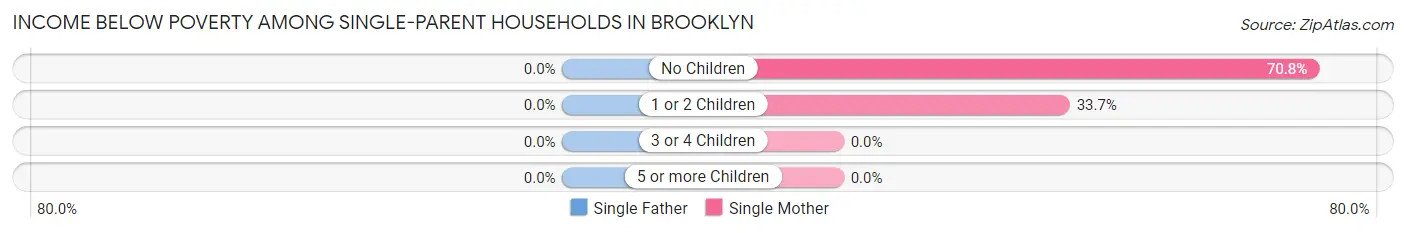
| Children | Single Father | Single Mother |
| No Children | 0 (0.0%) | 17 (70.8%) |
| 1 or 2 Children | 0 (0.0%) | 32 (33.7%) |
| 3 or 4 Children | 0 (0.0%) | 0 (0.0%) |
| 5 or more Children | 0 (0.0%) | 0 (0.0%) |
| Total | 0 (0.0%) | 49 (41.2%) |
Income Below Poverty Among Married-Couple vs Single-Parent Households in Brooklyn
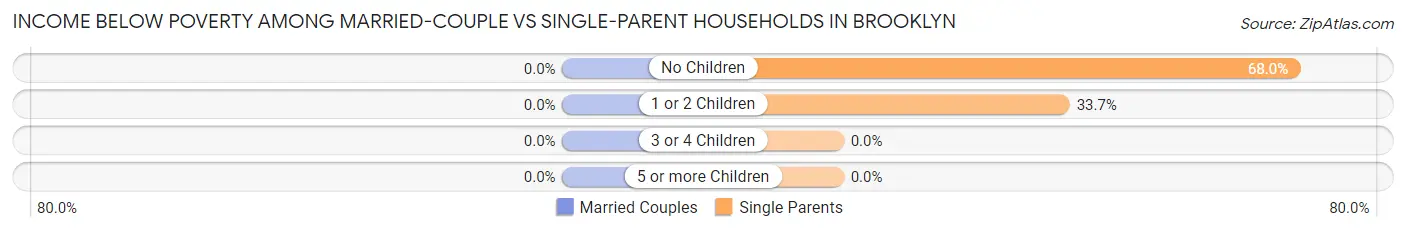
| Children | Married-Couple Families | Single-Parent Households |
| No Children | 0 (0.0%) | 17 (68.0%) |
| 1 or 2 Children | 0 (0.0%) | 32 (33.7%) |
| 3 or 4 Children | 0 (0.0%) | 0 (0.0%) |
| 5 or more Children | 0 (0.0%) | 0 (0.0%) |
| Total | 0 (0.0%) | 49 (40.8%) |
Race in Brooklyn
The most populous races in Brooklyn are Black / African American (603 | 95.9%), Hispanic or Latino (32 | 5.1%), and Two or more Races (15 | 2.4%).
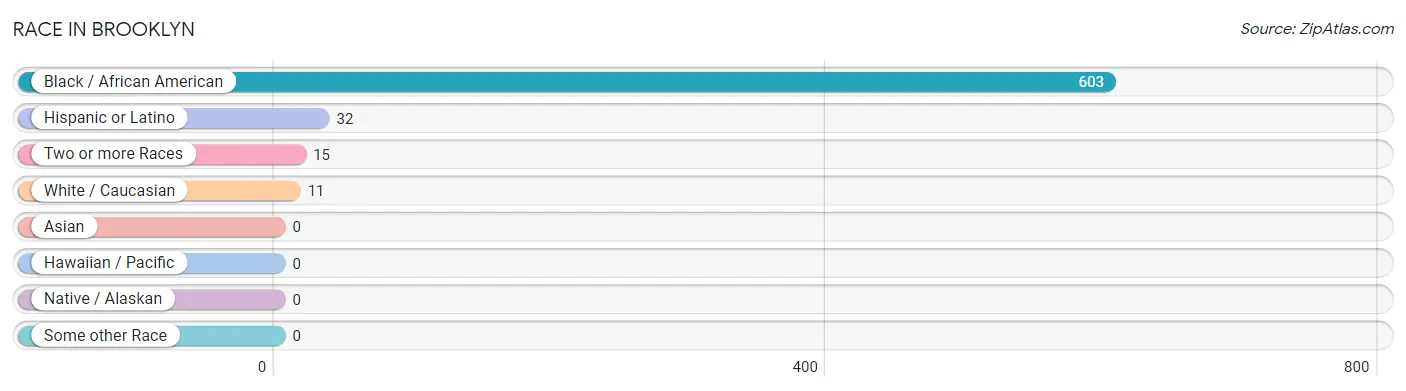
| Race | # Population | % Population |
| Asian | 0 | 0.0% |
| Black / African American | 603 | 95.9% |
| Hawaiian / Pacific | 0 | 0.0% |
| Hispanic or Latino | 32 | 5.1% |
| Native / Alaskan | 0 | 0.0% |
| White / Caucasian | 11 | 1.8% |
| Two or more Races | 15 | 2.4% |
| Some other Race | 0 | 0.0% |
| Total | 629 | 100.0% |
Ancestry in Brooklyn
The most populous ancestries reported in Brooklyn are Cuban (29 | 4.6%), and Mexican (3 | 0.5%), together accounting for 5.1% of all Brooklyn residents.
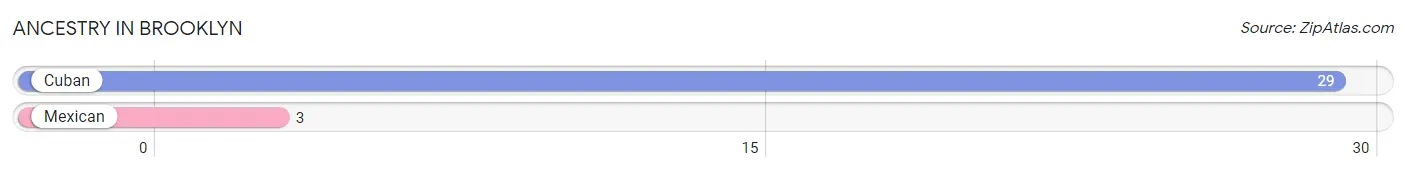
| Ancestry | # Population | % Population |
| Cuban | 29 | 4.6% |
| Mexican | 3 | 0.5% | View All 2 Rows |
Immigrants in Brooklyn
The most numerous immigrant groups reported in Brooklyn came from Central America (1 | 0.2%), Latin America (1 | 0.2%), and Mexico (1 | 0.2%), together accounting for 0.5% of all Brooklyn residents.
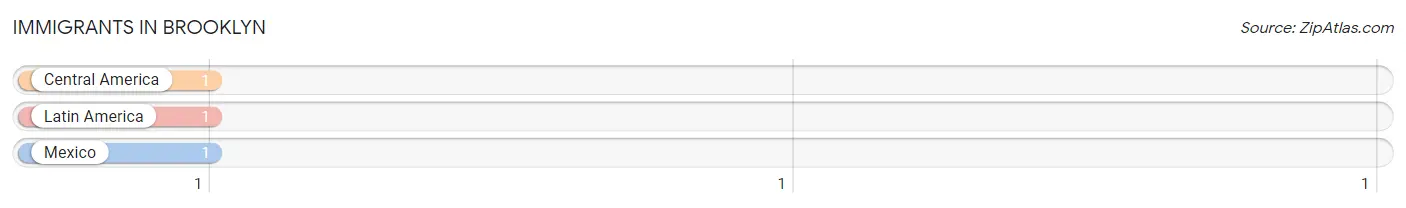
| Immigration Origin | # Population | % Population |
| Central America | 1 | 0.2% |
| Latin America | 1 | 0.2% |
| Mexico | 1 | 0.2% | View All 3 Rows |
Sex and Age in Brooklyn
Sex and Age in Brooklyn
The most populous age groups in Brooklyn are 25 to 29 Years (79 | 30.4%) for men and 5 to 9 Years (90 | 24.4%) for women.
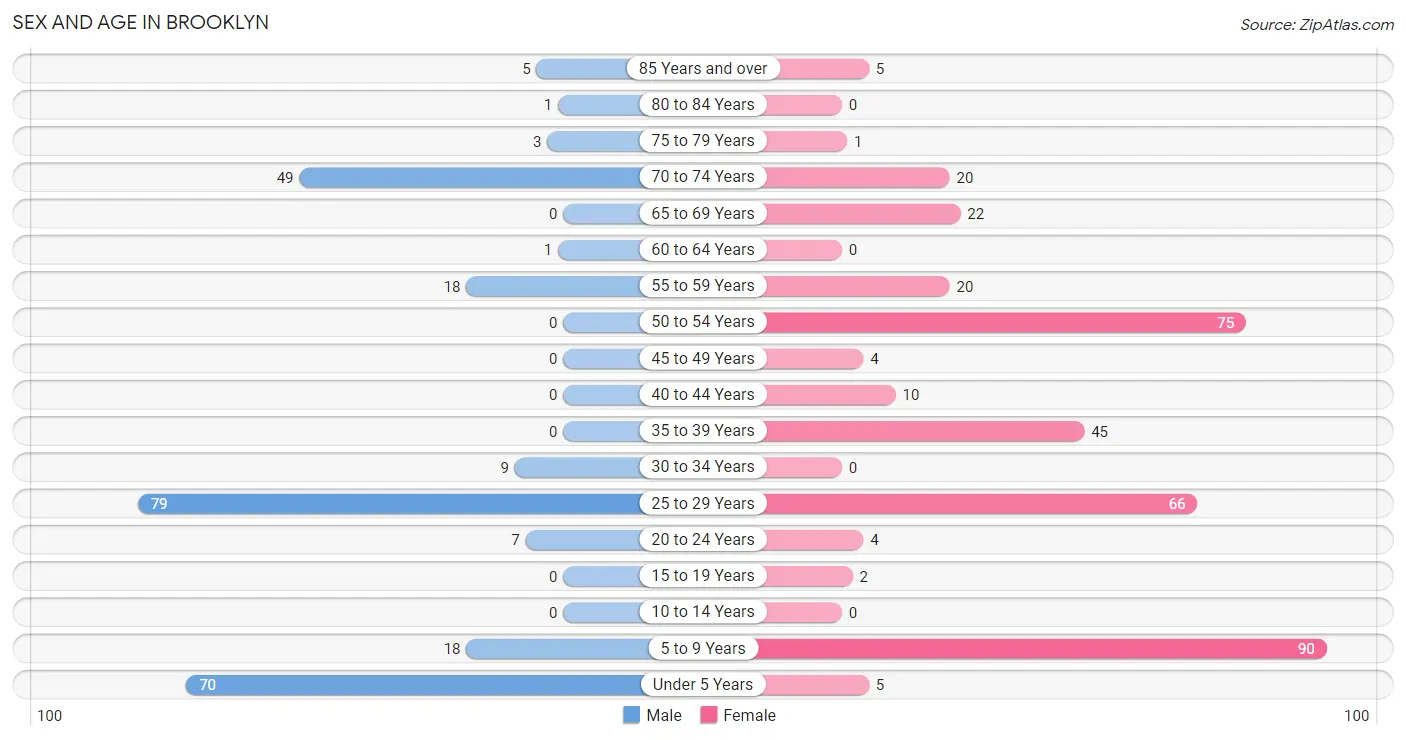
| Age Bracket | Male | Female |
| Under 5 Years | 70 (26.9%) | 5 (1.4%) |
| 5 to 9 Years | 18 (6.9%) | 90 (24.4%) |
| 10 to 14 Years | 0 (0.0%) | 0 (0.0%) |
| 15 to 19 Years | 0 (0.0%) | 2 (0.5%) |
| 20 to 24 Years | 7 (2.7%) | 4 (1.1%) |
| 25 to 29 Years | 79 (30.4%) | 66 (17.9%) |
| 30 to 34 Years | 9 (3.5%) | 0 (0.0%) |
| 35 to 39 Years | 0 (0.0%) | 45 (12.2%) |
| 40 to 44 Years | 0 (0.0%) | 10 (2.7%) |
| 45 to 49 Years | 0 (0.0%) | 4 (1.1%) |
| 50 to 54 Years | 0 (0.0%) | 75 (20.3%) |
| 55 to 59 Years | 18 (6.9%) | 20 (5.4%) |
| 60 to 64 Years | 1 (0.4%) | 0 (0.0%) |
| 65 to 69 Years | 0 (0.0%) | 22 (6.0%) |
| 70 to 74 Years | 49 (18.9%) | 20 (5.4%) |
| 75 to 79 Years | 3 (1.1%) | 1 (0.3%) |
| 80 to 84 Years | 1 (0.4%) | 0 (0.0%) |
| 85 Years and over | 5 (1.9%) | 5 (1.4%) |
| Total | 260 (100.0%) | 369 (100.0%) |
Families and Households in Brooklyn
Median Family Size in Brooklyn
The median family size in Brooklyn is 3.96 persons per family, with single female/mother families (119 | 96.0%) accounting for the largest median family size of 4.03 persons per family. On the other hand, single male/father families (1 | 0.8%) represent the smallest median family size with 2.00 persons per family.
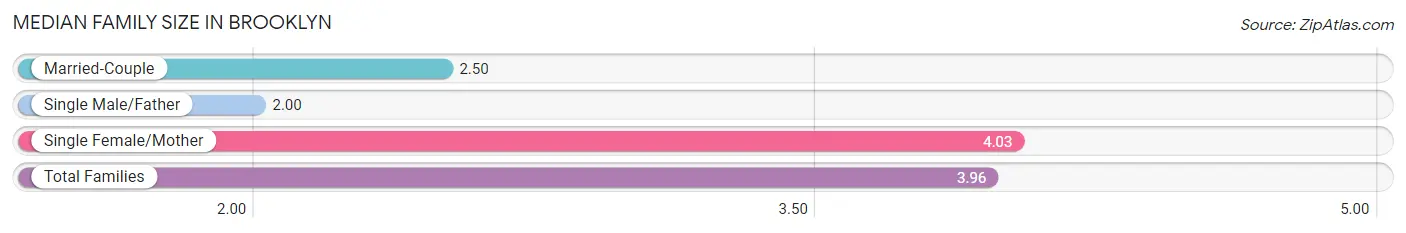
| Family Type | # Families | Family Size |
| Married-Couple | 4 (3.2%) | 2.50 |
| Single Male/Father | 1 (0.8%) | 2.00 |
| Single Female/Mother | 119 (96.0%) | 4.03 |
| Total Families | 124 (100.0%) | 3.96 |
Median Household Size in Brooklyn
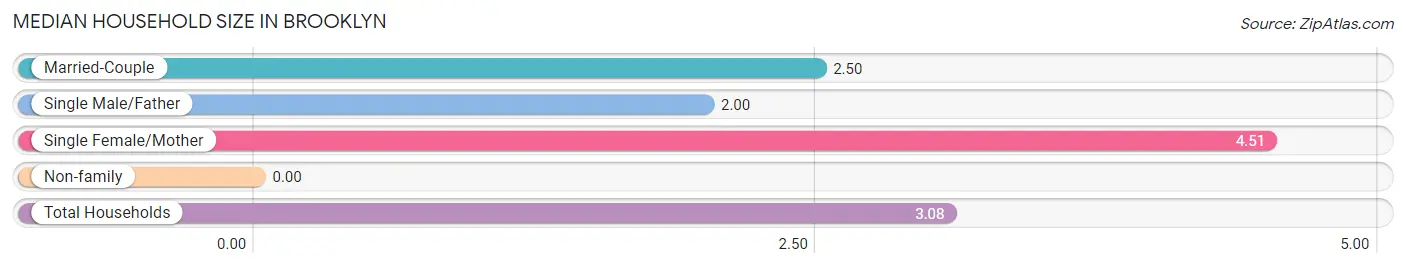
| Household Type | # Households | Household Size |
| Married-Couple | 4 (2.0%) | 2.50 |
| Single Male/Father | 1 (0.5%) | 2.00 |
| Single Female/Mother | 119 (58.3%) | 4.51 |
| Non-family | 80 (39.2%) | - |
| Total Households | 204 (100.0%) | 3.08 |
Household Size by Marriage Status in Brooklyn
Out of a total of 204 households in Brooklyn, 124 (60.8%) are family households, while 80 (39.2%) are nonfamily households. The most numerous type of family households are 6-person households, comprising 58, and the most common type of nonfamily households are 1-person households, comprising 80.
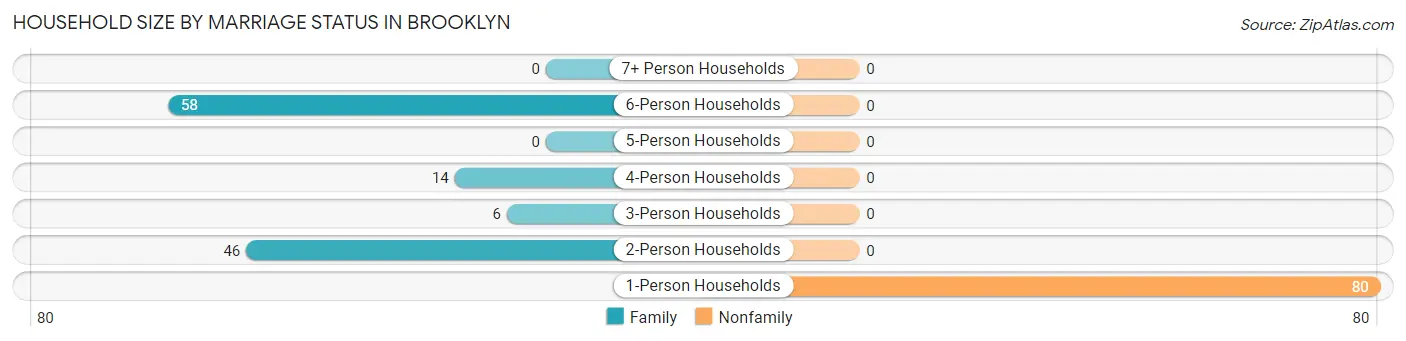
| Household Size | Family Households | Nonfamily Households |
| 1-Person Households | - | 80 (39.2%) |
| 2-Person Households | 46 (22.6%) | 0 (0.0%) |
| 3-Person Households | 6 (2.9%) | 0 (0.0%) |
| 4-Person Households | 14 (6.9%) | 0 (0.0%) |
| 5-Person Households | 0 (0.0%) | 0 (0.0%) |
| 6-Person Households | 58 (28.4%) | 0 (0.0%) |
| 7+ Person Households | 0 (0.0%) | 0 (0.0%) |
| Total | 124 (60.8%) | 80 (39.2%) |
Female Fertility in Brooklyn
Fertility by Age in Brooklyn
Average fertility rate in Brooklyn is 21.0 births per 1,000 women. Women in the age bracket of 20 to 34 years have the highest fertility rate with 57.0 births per 1,000 women. Women in the age bracket of 20 to 34 years acount for 100.0% of all women with births.
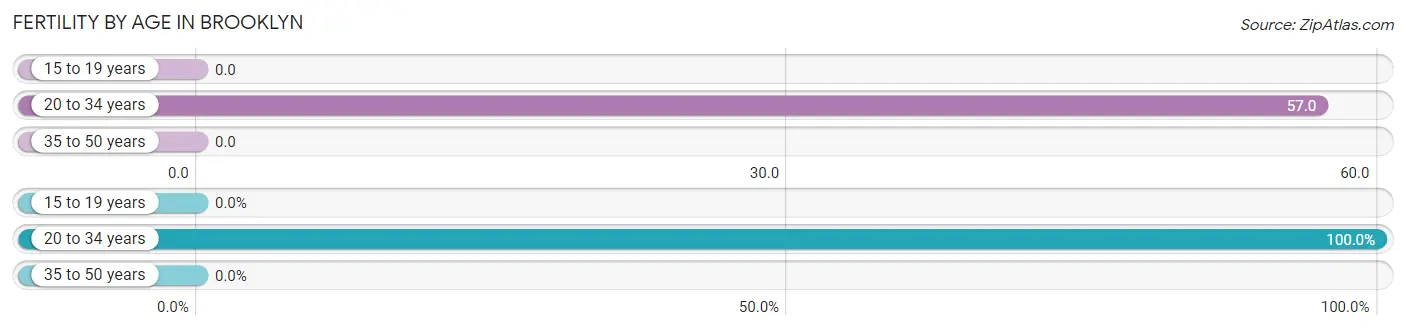
| Age Bracket | Women with Births | Births / 1,000 Women |
| 15 to 19 years | 0 (0.0%) | 0.0 |
| 20 to 34 years | 4 (100.0%) | 57.0 |
| 35 to 50 years | 0 (0.0%) | 0.0 |
| Total | 4 (100.0%) | 21.0 |
Fertility by Age by Marriage Status in Brooklyn
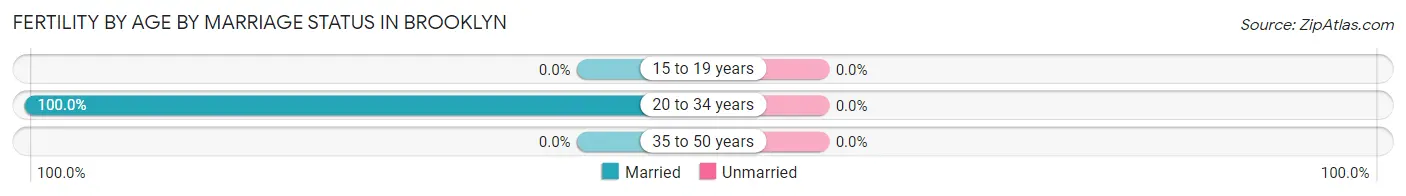
| Age Bracket | Married | Unmarried |
| 15 to 19 years | 0 (0.0%) | 0 (0.0%) |
| 20 to 34 years | 4 (100.0%) | 0 (0.0%) |
| 35 to 50 years | 0 (0.0%) | 0 (0.0%) |
| Total | 4 (100.0%) | 0 (0.0%) |
Fertility by Education in Brooklyn
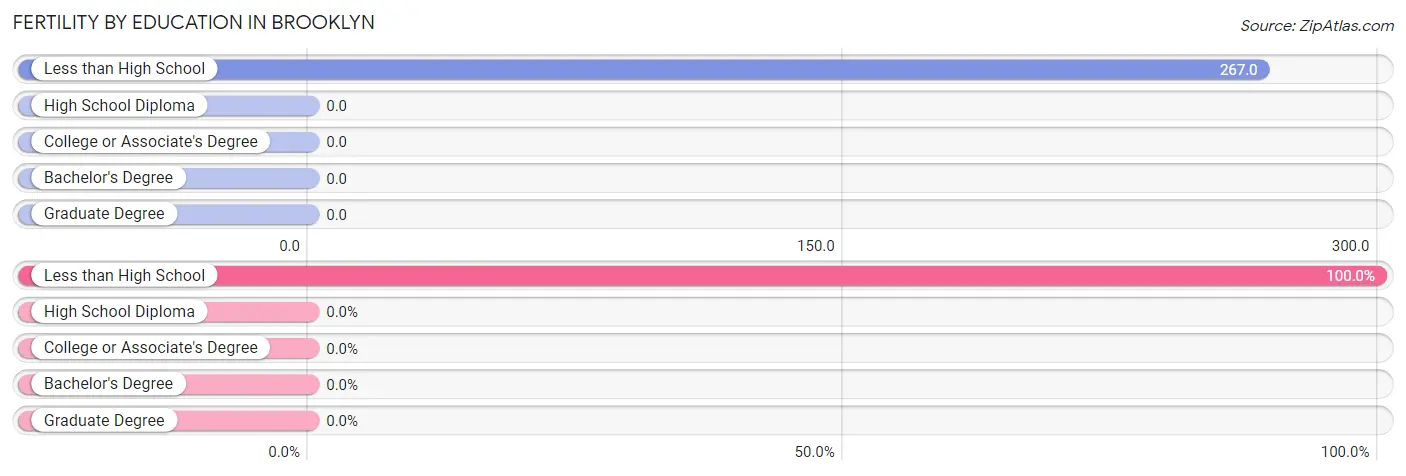
| Educational Attainment | Women with Births | Births / 1,000 Women |
| Less than High School | 4 (100.0%) | 267.0 |
| High School Diploma | 0 (0.0%) | 0.0 |
| College or Associate's Degree | 0 (0.0%) | 0.0 |
| Bachelor's Degree | 0 (0.0%) | 0.0 |
| Graduate Degree | 0 (0.0%) | 0.0 |
| Total | 4 (100.0%) | 21.0 |
Fertility by Education by Marriage Status in Brooklyn
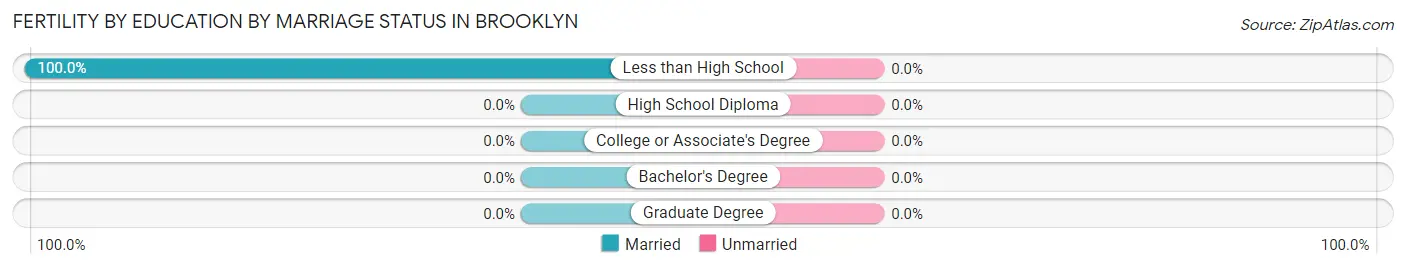
| Educational Attainment | Married | Unmarried |
| Less than High School | 4 (100.0%) | 0 (0.0%) |
| High School Diploma | 0 (0.0%) | 0 (0.0%) |
| College or Associate's Degree | 0 (0.0%) | 0 (0.0%) |
| Bachelor's Degree | 0 (0.0%) | 0 (0.0%) |
| Graduate Degree | 0 (0.0%) | 0 (0.0%) |
| Total | 4 (100.0%) | 0 (0.0%) |
Employment Characteristics in Brooklyn
Employment by Class of Employer in Brooklyn
Among the 270 employed individuals in Brooklyn, local government employees (139 | 51.5%), private company employees (112 | 41.5%), and state government employees (19 | 7.0%) make up the most common classes of employment.
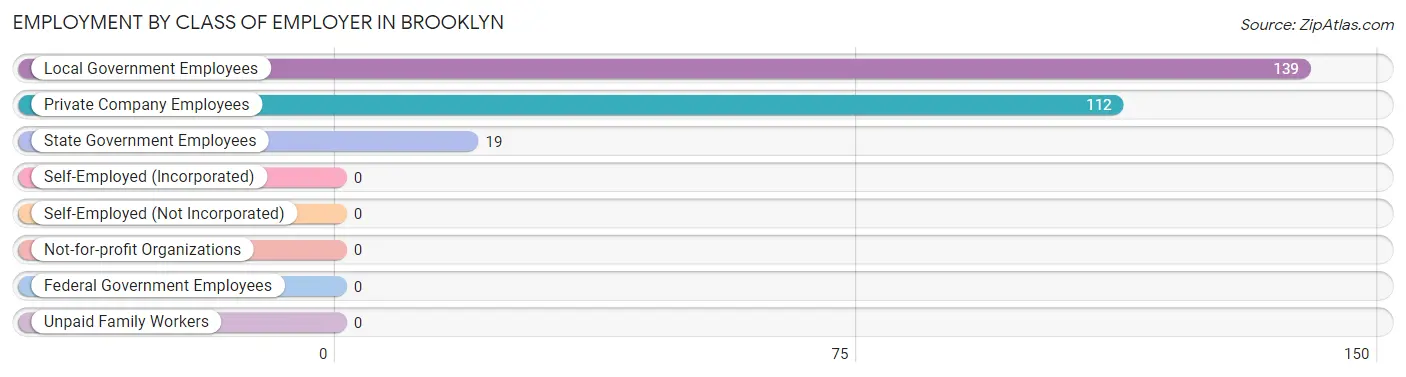
| Employer Class | # Employees | % Employees |
| Private Company Employees | 112 | 41.5% |
| Self-Employed (Incorporated) | 0 | 0.0% |
| Self-Employed (Not Incorporated) | 0 | 0.0% |
| Not-for-profit Organizations | 0 | 0.0% |
| Local Government Employees | 139 | 51.5% |
| State Government Employees | 19 | 7.0% |
| Federal Government Employees | 0 | 0.0% |
| Unpaid Family Workers | 0 | 0.0% |
| Total | 270 | 100.0% |
Employment Status by Age in Brooklyn
According to the labor force statistics for Brooklyn, out of the total population over 16 years of age (446), 68.8% or 307 individuals are in the labor force, with 12.1% or 37 of them unemployed. The age group with the highest labor force participation rate is 20 to 24 years, with 100.0% or 11 individuals in the labor force. Within the labor force, the 20 to 24 years age range has the highest percentage of unemployed individuals, with 100.0% or 11 of them being unemployed.
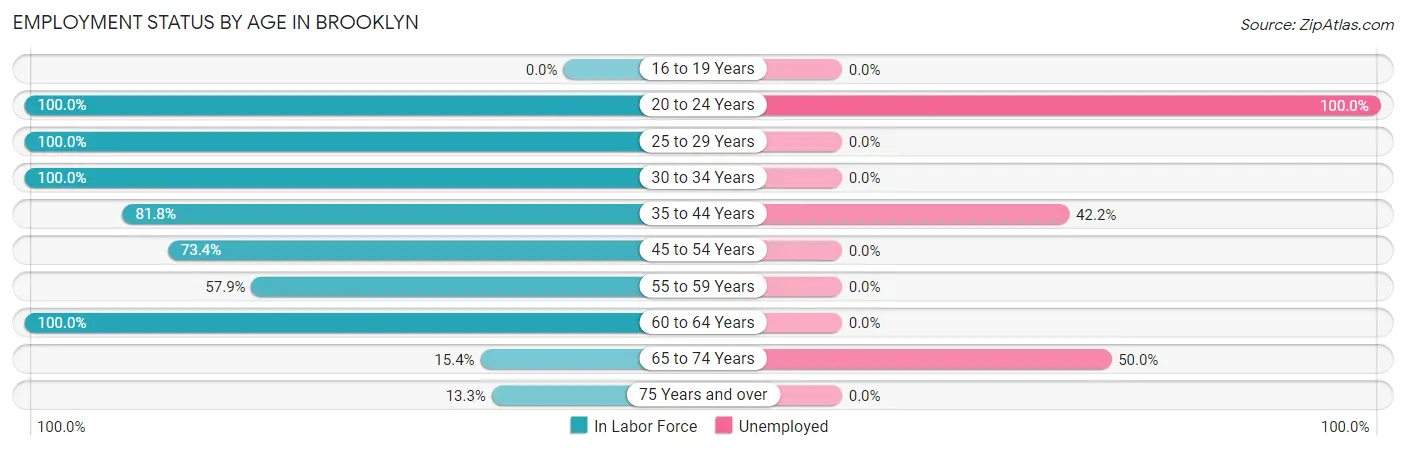
| Age Bracket | In Labor Force | Unemployed |
| 16 to 19 Years | 0 (0.0%) | 0 (0.0%) |
| 20 to 24 Years | 11 (100.0%) | 11 (100.0%) |
| 25 to 29 Years | 145 (100.0%) | 0 (0.0%) |
| 30 to 34 Years | 9 (100.0%) | 0 (0.0%) |
| 35 to 44 Years | 45 (81.8%) | 19 (42.2%) |
| 45 to 54 Years | 58 (73.4%) | 0 (0.0%) |
| 55 to 59 Years | 22 (57.9%) | 0 (0.0%) |
| 60 to 64 Years | 1 (100.0%) | 0 (0.0%) |
| 65 to 74 Years | 14 (15.4%) | 7 (50.0%) |
| 75 Years and over | 2 (13.3%) | 0 (0.0%) |
| Total | 307 (68.8%) | 37 (12.1%) |
Employment Status by Educational Attainment in Brooklyn
According to labor force statistics for Brooklyn, 85.6% of individuals (280) out of the total population between 25 and 64 years of age (327) are in the labor force, with 6.8% or 19 of them being unemployed. The group with the highest labor force participation rate are those with the educational attainment of college / associate degree, with 100.0% or 1 individuals in the labor force. Within the labor force, individuals with bachelor's degree or higher education have the highest percentage of unemployment, with 10.4% or 19 of them being unemployed.

| Educational Attainment | In Labor Force | Unemployed |
| Less than High School | 29 (80.6%) | 0 (0.0%) |
| High School Diploma | 68 (80.0%) | 0 (0.0%) |
| College / Associate Degree | 1 (100.0%) | 0 (0.0%) |
| Bachelor's Degree or higher | 182 (88.8%) | 21 (10.4%) |
| Total | 280 (85.6%) | 22 (6.8%) |
Employment Occupations by Sex in Brooklyn
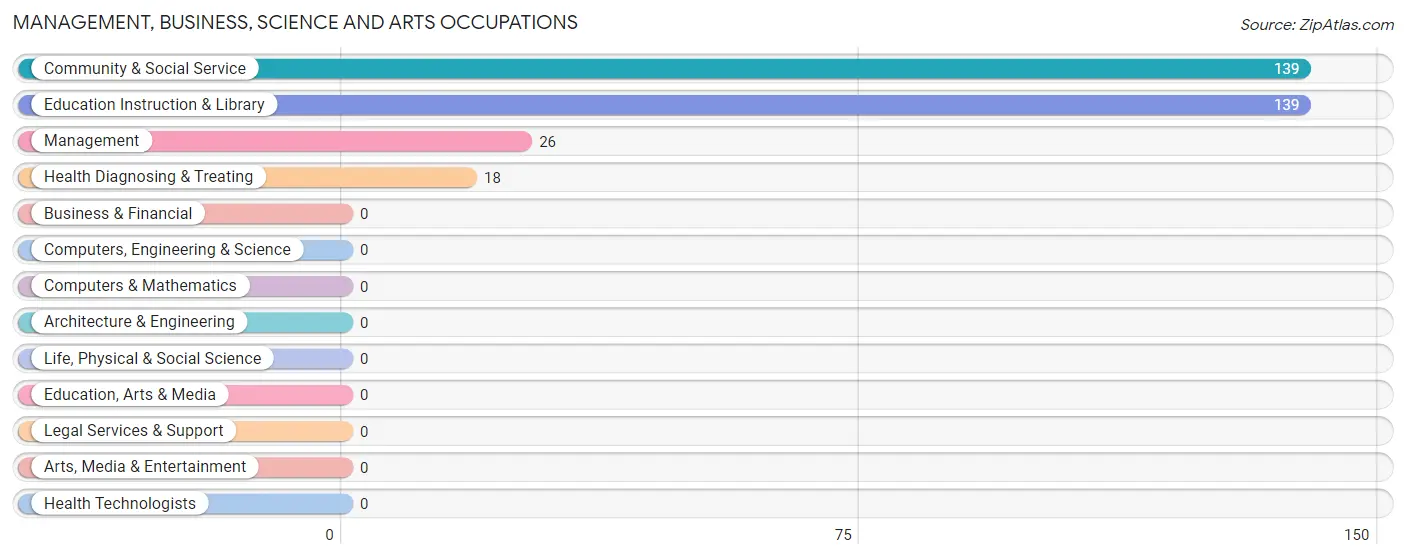
Management, Business, Science and Arts Occupations
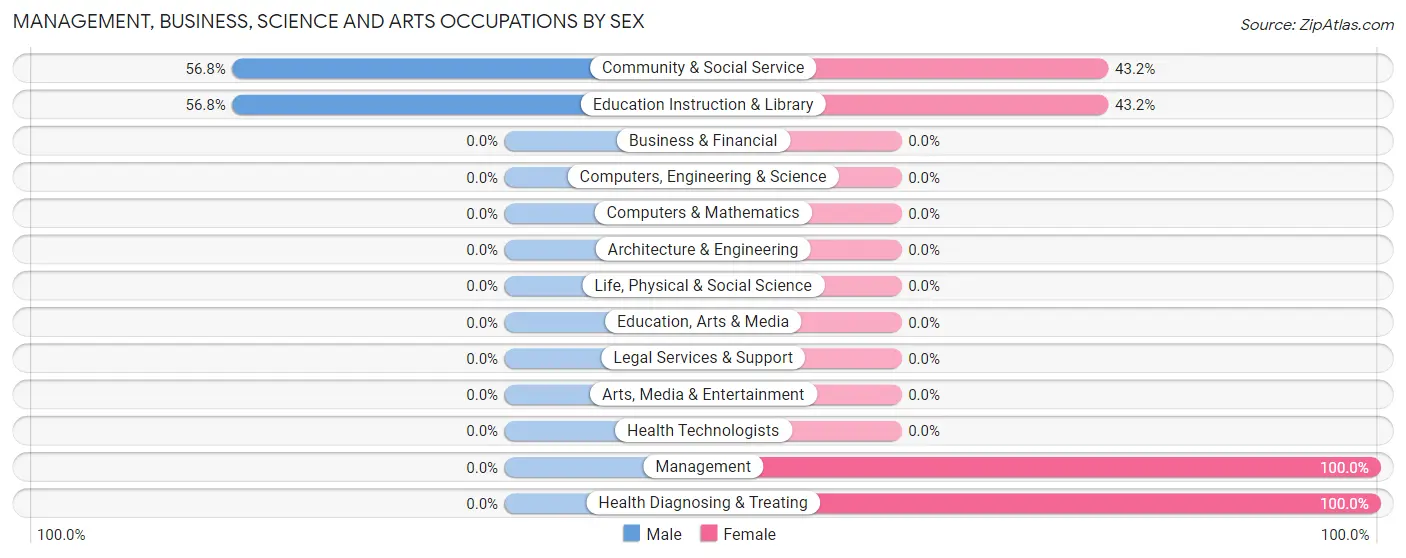
The most common Management, Business, Science and Arts occupations in Brooklyn are Community & Social Service (139 | 51.5%), Education Instruction & Library (139 | 51.5%), Management (26 | 9.6%), and Health Diagnosing & Treating (18 | 6.7%).
Management, Business, Science and Arts Occupations by Sex
Within the Management, Business, Science and Arts occupations in Brooklyn, the most male-oriented occupations are Community & Social Service (56.8%), and Education Instruction & Library (56.8%), while the most female-oriented occupations are Management (100.0%), Health Diagnosing & Treating (100.0%), and Community & Social Service (43.2%).
| Occupation | Male | Female |
| Management | 0 (0.0%) | 26 (100.0%) |
| Business & Financial | 0 (0.0%) | 0 (0.0%) |
| Computers, Engineering & Science | 0 (0.0%) | 0 (0.0%) |
| Computers & Mathematics | 0 (0.0%) | 0 (0.0%) |
| Architecture & Engineering | 0 (0.0%) | 0 (0.0%) |
| Life, Physical & Social Science | 0 (0.0%) | 0 (0.0%) |
| Community & Social Service | 79 (56.8%) | 60 (43.2%) |
| Education, Arts & Media | 0 (0.0%) | 0 (0.0%) |
| Legal Services & Support | 0 (0.0%) | 0 (0.0%) |
| Education Instruction & Library | 79 (56.8%) | 60 (43.2%) |
| Arts, Media & Entertainment | 0 (0.0%) | 0 (0.0%) |
| Health Diagnosing & Treating | 0 (0.0%) | 18 (100.0%) |
| Health Technologists | 0 (0.0%) | 0 (0.0%) |
| Total (Category) | 79 (43.2%) | 104 (56.8%) |
| Total (Overall) | 93 (34.4%) | 177 (65.6%) |
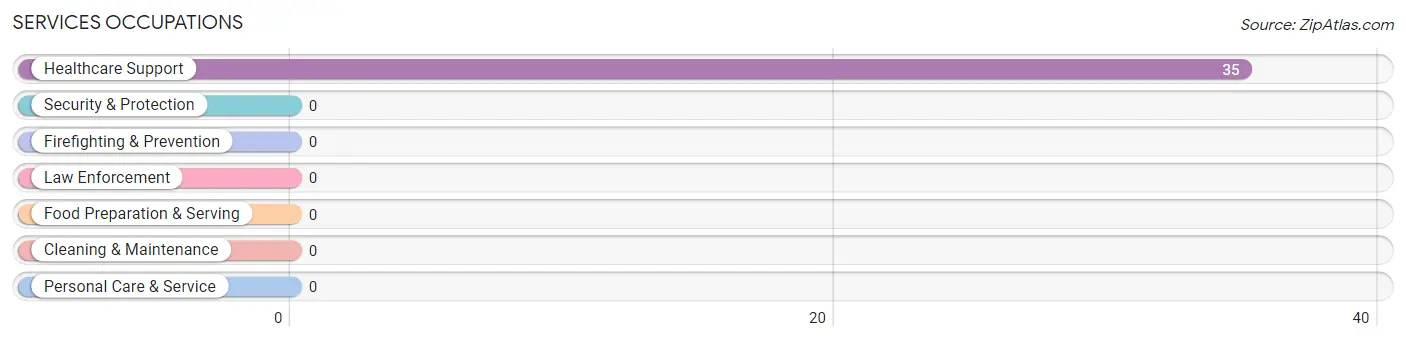
Services Occupations
The most common Services occupations in Brooklyn are , and Healthcare Support (35 | 13.0%).
Services Occupations by Sex
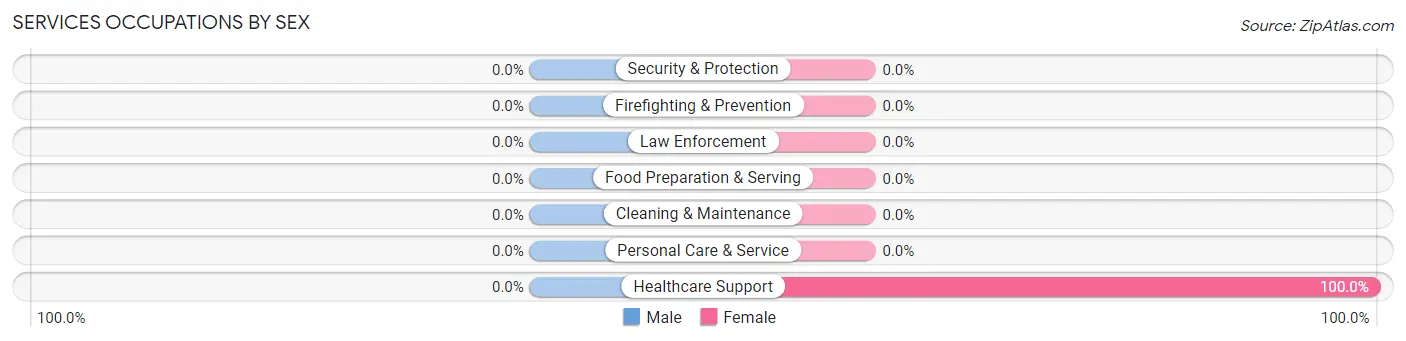
| Occupation | Male | Female |
| Healthcare Support | 0 (0.0%) | 35 (100.0%) |
| Security & Protection | 0 (0.0%) | 0 (0.0%) |
| Firefighting & Prevention | 0 (0.0%) | 0 (0.0%) |
| Law Enforcement | 0 (0.0%) | 0 (0.0%) |
| Food Preparation & Serving | 0 (0.0%) | 0 (0.0%) |
| Cleaning & Maintenance | 0 (0.0%) | 0 (0.0%) |
| Personal Care & Service | 0 (0.0%) | 0 (0.0%) |
| Total (Category) | 0 (0.0%) | 35 (100.0%) |
| Total (Overall) | 93 (34.4%) | 177 (65.6%) |
Sales and Office Occupations
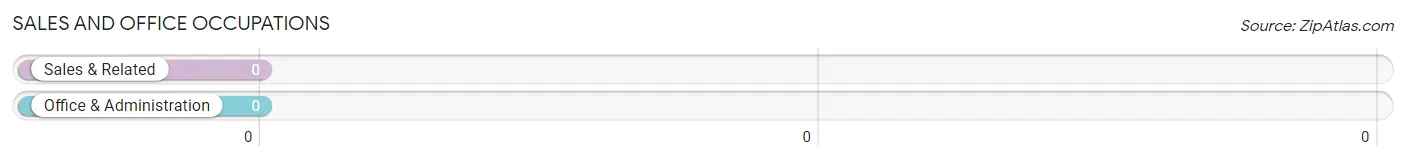
Sales and Office Occupations by Sex
| Occupation | Male | Female |
| Sales & Related | 0 (0.0%) | 0 (0.0%) |
| Office & Administration | 0 (0.0%) | 0 (0.0%) |
| Total (Category) | 0 (0.0%) | 0 (0.0%) |
| Total (Overall) | 93 (34.4%) | 177 (65.6%) |
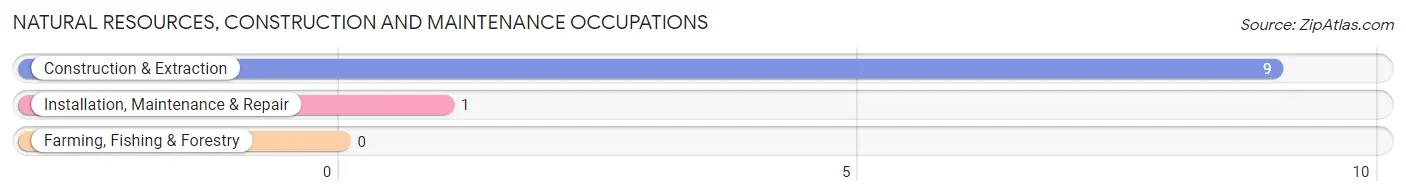
Natural Resources, Construction and Maintenance Occupations
The most common Natural Resources, Construction and Maintenance occupations in Brooklyn are Construction & Extraction (9 | 3.3%), and Installation, Maintenance & Repair (1 | 0.4%).
Natural Resources, Construction and Maintenance Occupations by Sex
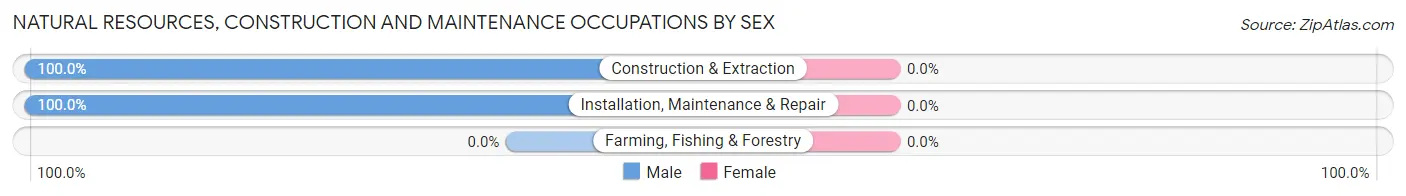
| Occupation | Male | Female |
| Farming, Fishing & Forestry | 0 (0.0%) | 0 (0.0%) |
| Construction & Extraction | 9 (100.0%) | 0 (0.0%) |
| Installation, Maintenance & Repair | 1 (100.0%) | 0 (0.0%) |
| Total (Category) | 10 (100.0%) | 0 (0.0%) |
| Total (Overall) | 93 (34.4%) | 177 (65.6%) |
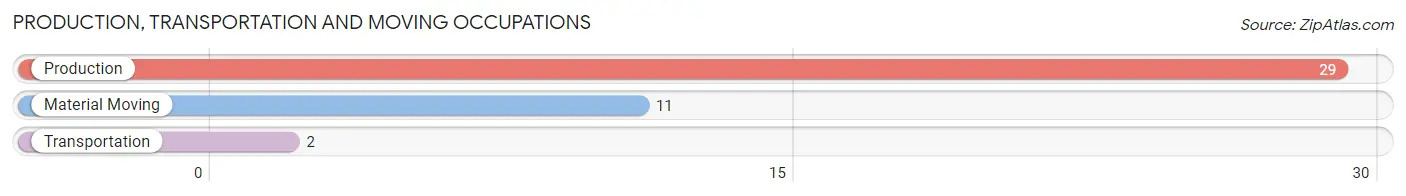
Production, Transportation and Moving Occupations
The most common Production, Transportation and Moving occupations in Brooklyn are Production (29 | 10.7%), Material Moving (11 | 4.1%), and Transportation (2 | 0.7%).
Production, Transportation and Moving Occupations by Sex
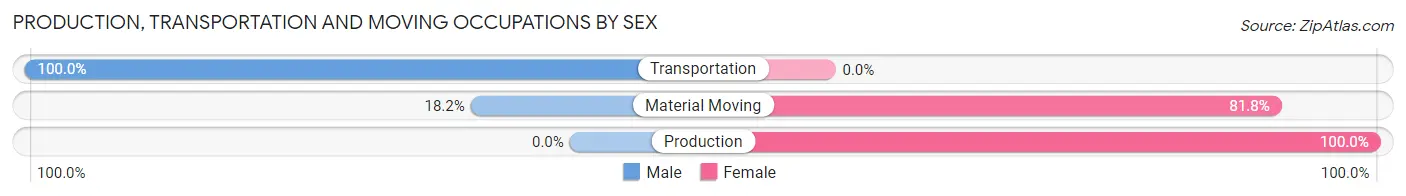
| Occupation | Male | Female |
| Production | 0 (0.0%) | 29 (100.0%) |
| Transportation | 2 (100.0%) | 0 (0.0%) |
| Material Moving | 2 (18.2%) | 9 (81.8%) |
| Total (Category) | 4 (9.5%) | 38 (90.5%) |
| Total (Overall) | 93 (34.4%) | 177 (65.6%) |
Employment Industries by Sex in Brooklyn
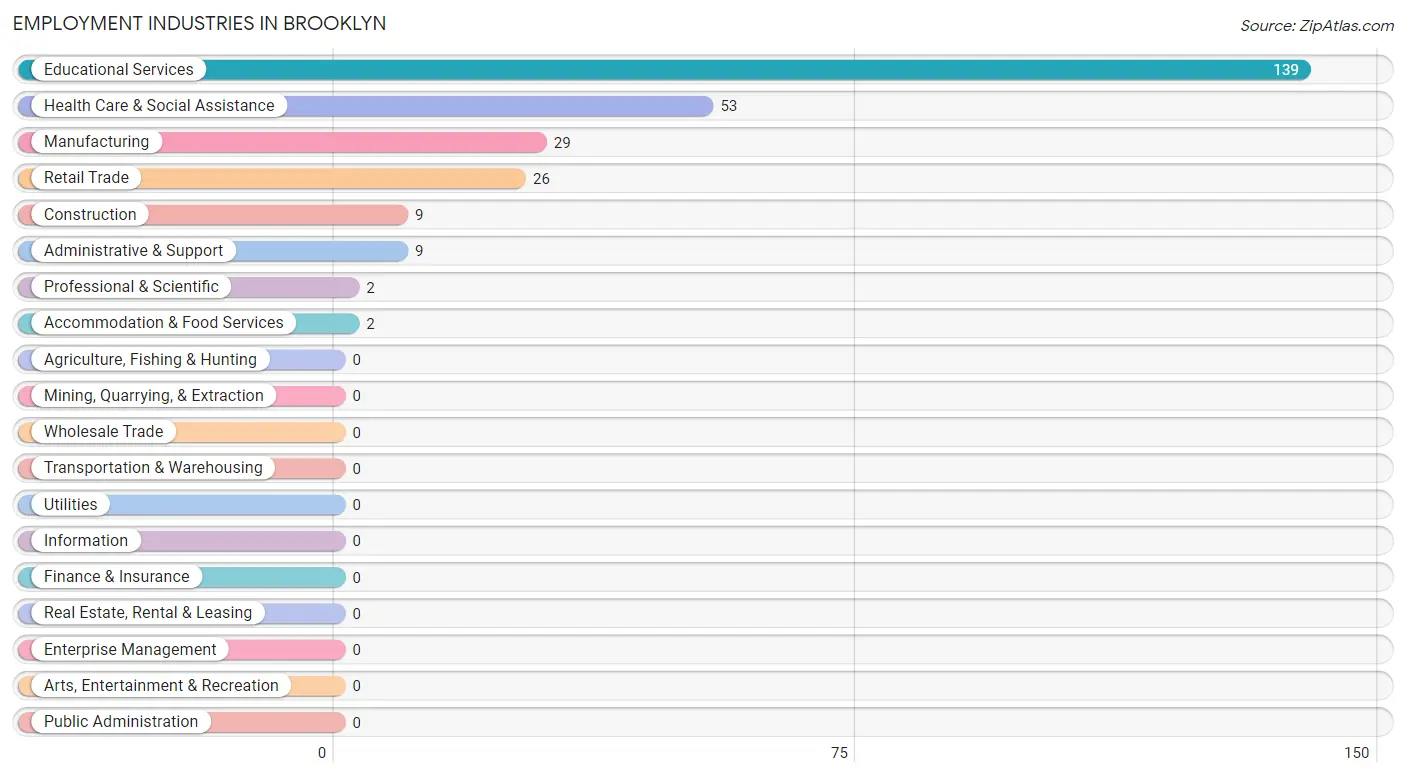
Employment Industries in Brooklyn
The major employment industries in Brooklyn include Educational Services (139 | 51.5%), Health Care & Social Assistance (53 | 19.6%), Manufacturing (29 | 10.7%), Retail Trade (26 | 9.6%), and Construction (9 | 3.3%).
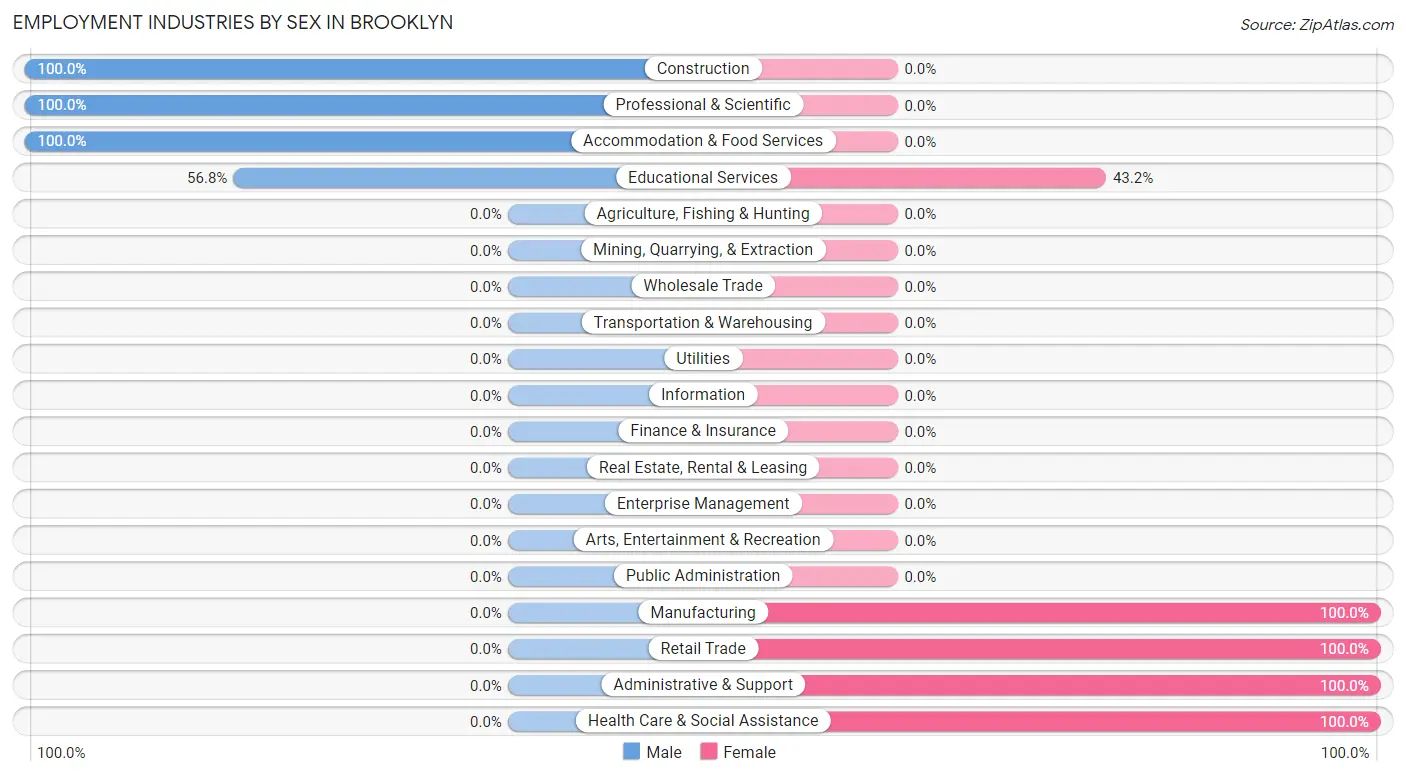
Employment Industries by Sex in Brooklyn
The Brooklyn industries that see more men than women are Construction (100.0%), Professional & Scientific (100.0%), and Accommodation & Food Services (100.0%), whereas the industries that tend to have a higher number of women are Manufacturing (100.0%), Retail Trade (100.0%), and Administrative & Support (100.0%).
| Industry | Male | Female |
| Agriculture, Fishing & Hunting | 0 (0.0%) | 0 (0.0%) |
| Mining, Quarrying, & Extraction | 0 (0.0%) | 0 (0.0%) |
| Construction | 9 (100.0%) | 0 (0.0%) |
| Manufacturing | 0 (0.0%) | 29 (100.0%) |
| Wholesale Trade | 0 (0.0%) | 0 (0.0%) |
| Retail Trade | 0 (0.0%) | 26 (100.0%) |
| Transportation & Warehousing | 0 (0.0%) | 0 (0.0%) |
| Utilities | 0 (0.0%) | 0 (0.0%) |
| Information | 0 (0.0%) | 0 (0.0%) |
| Finance & Insurance | 0 (0.0%) | 0 (0.0%) |
| Real Estate, Rental & Leasing | 0 (0.0%) | 0 (0.0%) |
| Professional & Scientific | 2 (100.0%) | 0 (0.0%) |
| Enterprise Management | 0 (0.0%) | 0 (0.0%) |
| Administrative & Support | 0 (0.0%) | 9 (100.0%) |
| Educational Services | 79 (56.8%) | 60 (43.2%) |
| Health Care & Social Assistance | 0 (0.0%) | 53 (100.0%) |
| Arts, Entertainment & Recreation | 0 (0.0%) | 0 (0.0%) |
| Accommodation & Food Services | 2 (100.0%) | 0 (0.0%) |
| Public Administration | 0 (0.0%) | 0 (0.0%) |
| Total | 93 (34.4%) | 177 (65.6%) |
Education in Brooklyn
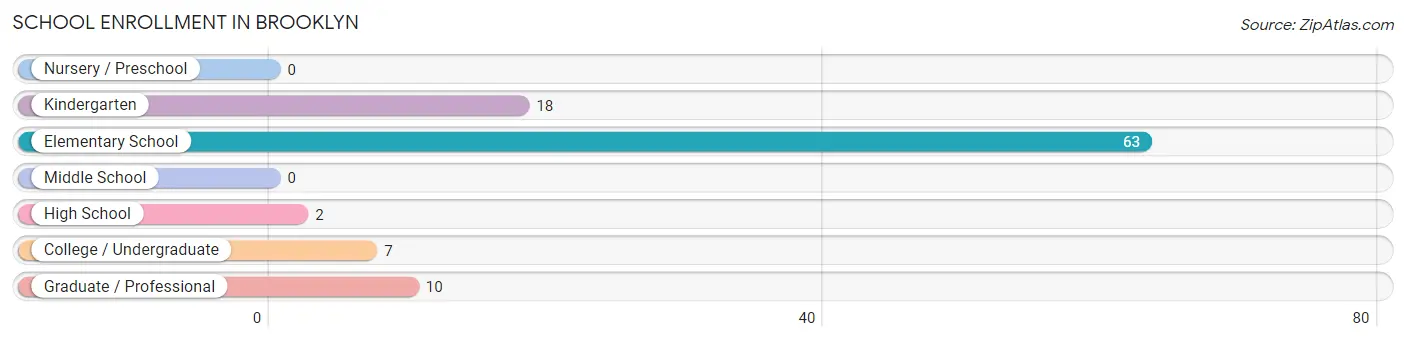
School Enrollment in Brooklyn
The most common levels of schooling among the 100 students in Brooklyn are elementary school (63 | 63.0%), kindergarten (18 | 18.0%), and graduate / professional (10 | 10.0%).
| School Level | # Students | % Students |
| Nursery / Preschool | 0 | 0.0% |
| Kindergarten | 18 | 18.0% |
| Elementary School | 63 | 63.0% |
| Middle School | 0 | 0.0% |
| High School | 2 | 2.0% |
| College / Undergraduate | 7 | 7.0% |
| Graduate / Professional | 10 | 10.0% |
| Total | 100 | 100.0% |
School Enrollment by Age by Funding Source in Brooklyn
Out of a total of 100 students who are enrolled in schools in Brooklyn, 10 (10.0%) attend a private institution, while the remaining 90 (90.0%) are enrolled in public schools. The age group of 35 years and over has the highest likelihood of being enrolled in private schools, with 10 (100.0% in the age bracket) enrolled. Conversely, the age group of 5 to 9 year old has the lowest likelihood of being enrolled in a private school, with 81 (100.0% in the age bracket) attending a public institution.
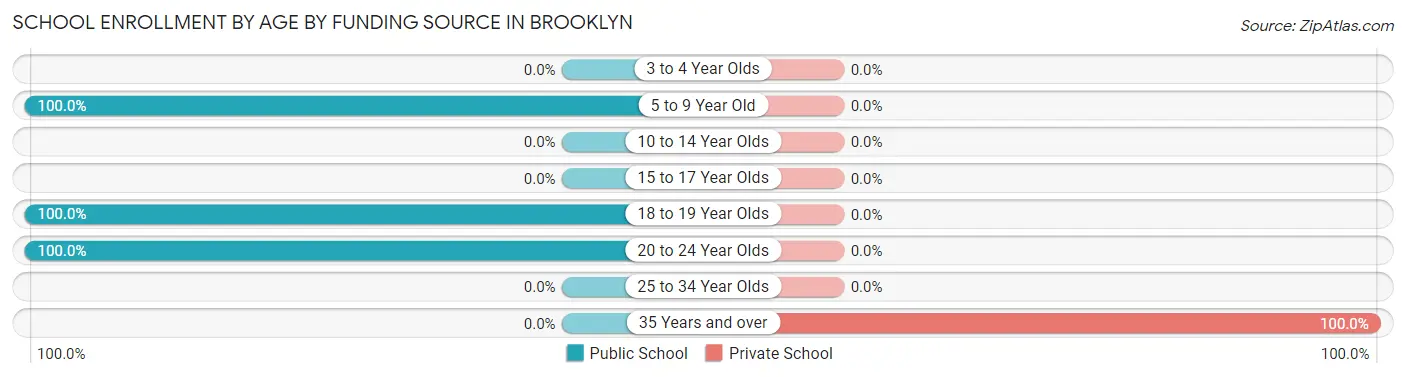
| Age Bracket | Public School | Private School |
| 3 to 4 Year Olds | 0 (0.0%) | 0 (0.0%) |
| 5 to 9 Year Old | 81 (100.0%) | 0 (0.0%) |
| 10 to 14 Year Olds | 0 (0.0%) | 0 (0.0%) |
| 15 to 17 Year Olds | 0 (0.0%) | 0 (0.0%) |
| 18 to 19 Year Olds | 2 (100.0%) | 0 (0.0%) |
| 20 to 24 Year Olds | 7 (100.0%) | 0 (0.0%) |
| 25 to 34 Year Olds | 0 (0.0%) | 0 (0.0%) |
| 35 Years and over | 0 (0.0%) | 10 (100.0%) |
| Total | 90 (90.0%) | 10 (10.0%) |
Educational Attainment by Field of Study in Brooklyn
Arts & humanities (79 | 38.5%), social sciences (71 | 34.6%), psychology (45 | 22.0%), and communications (10 | 4.9%) are the most common fields of study among 205 individuals in Brooklyn who have obtained a bachelor's degree or higher.
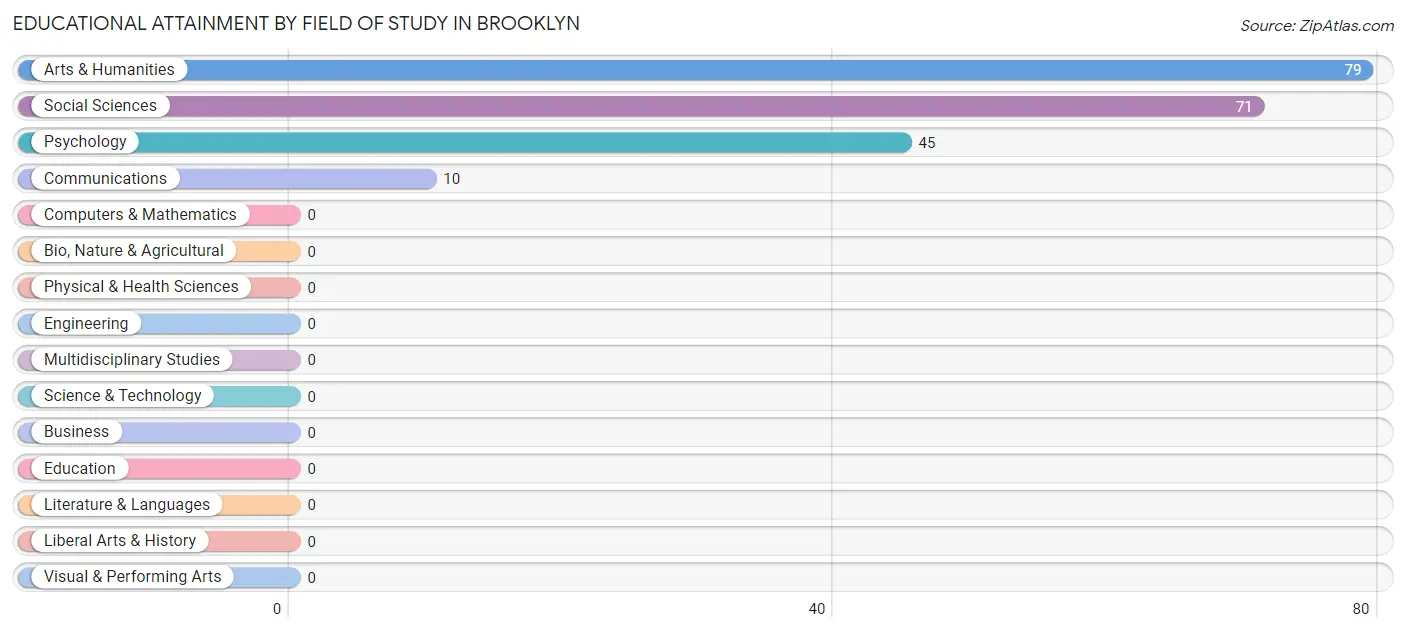
| Field of Study | # Graduates | % Graduates |
| Computers & Mathematics | 0 | 0.0% |
| Bio, Nature & Agricultural | 0 | 0.0% |
| Physical & Health Sciences | 0 | 0.0% |
| Psychology | 45 | 22.0% |
| Social Sciences | 71 | 34.6% |
| Engineering | 0 | 0.0% |
| Multidisciplinary Studies | 0 | 0.0% |
| Science & Technology | 0 | 0.0% |
| Business | 0 | 0.0% |
| Education | 0 | 0.0% |
| Literature & Languages | 0 | 0.0% |
| Liberal Arts & History | 0 | 0.0% |
| Visual & Performing Arts | 0 | 0.0% |
| Communications | 10 | 4.9% |
| Arts & Humanities | 79 | 38.5% |
| Total | 205 | 100.0% |
Transportation & Commute in Brooklyn
Vehicle Availability by Sex in Brooklyn
The most prevalent vehicle ownership categories in Brooklyn are males with no vehicle (79, accounting for 85.0%) and females with no vehicle (87, making up 44.6%).
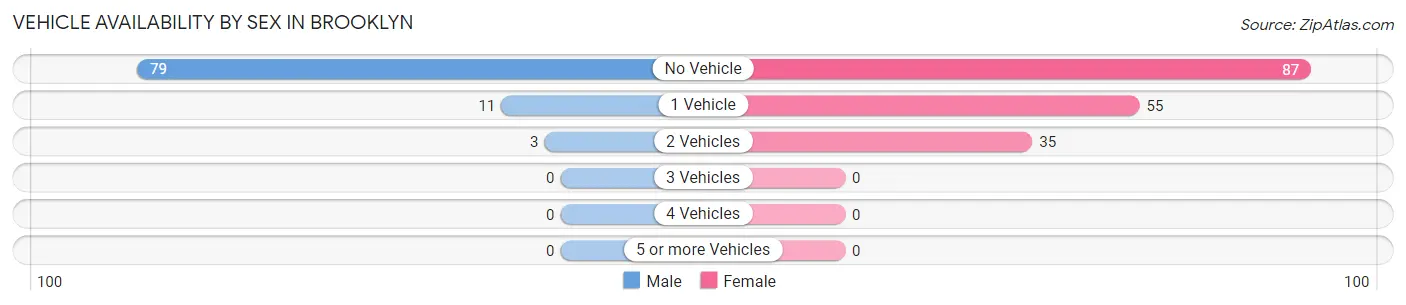
| Vehicles Available | Male | Female |
| No Vehicle | 79 (85.0%) | 87 (49.1%) |
| 1 Vehicle | 11 (11.8%) | 55 (31.1%) |
| 2 Vehicles | 3 (3.2%) | 35 (19.8%) |
| 3 Vehicles | 0 (0.0%) | 0 (0.0%) |
| 4 Vehicles | 0 (0.0%) | 0 (0.0%) |
| 5 or more Vehicles | 0 (0.0%) | 0 (0.0%) |
| Total | 93 (100.0%) | 177 (100.0%) |
Commute Time in Brooklyn
The most frequently occuring commute durations in Brooklyn are 25 to 29 minutes (65 commuters, 34.0%), 30 to 34 minutes (65 commuters, 34.0%), and 10 to 14 minutes (29 commuters, 15.2%).
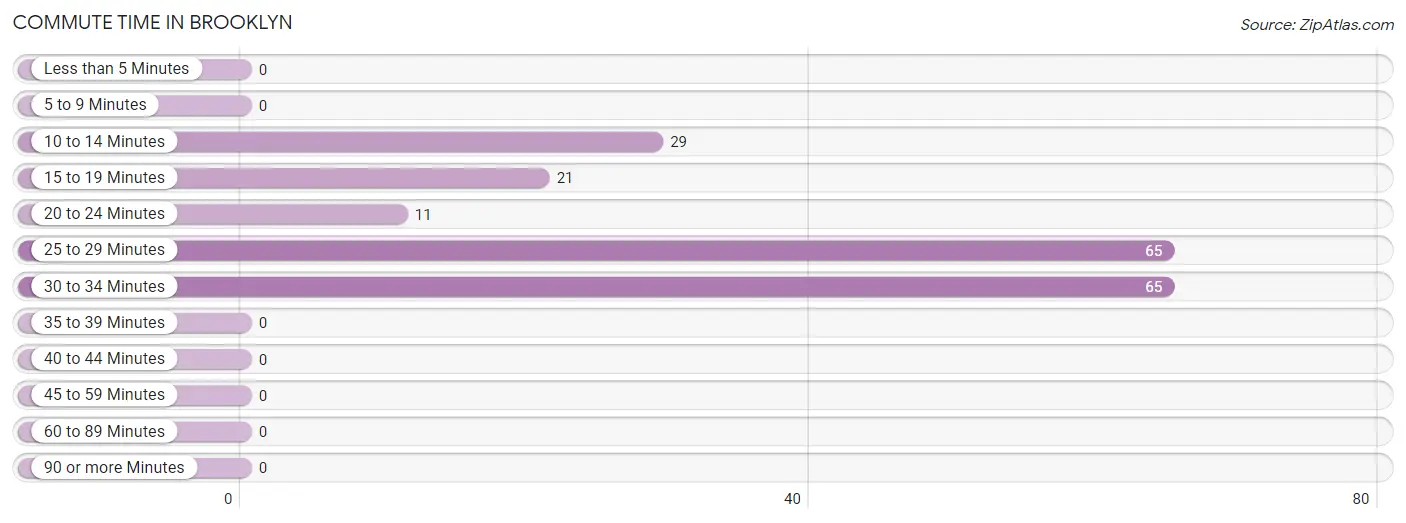
| Commute Time | # Commuters | % Commuters |
| Less than 5 Minutes | 0 | 0.0% |
| 5 to 9 Minutes | 0 | 0.0% |
| 10 to 14 Minutes | 29 | 15.2% |
| 15 to 19 Minutes | 21 | 11.0% |
| 20 to 24 Minutes | 11 | 5.8% |
| 25 to 29 Minutes | 65 | 34.0% |
| 30 to 34 Minutes | 65 | 34.0% |
| 35 to 39 Minutes | 0 | 0.0% |
| 40 to 44 Minutes | 0 | 0.0% |
| 45 to 59 Minutes | 0 | 0.0% |
| 60 to 89 Minutes | 0 | 0.0% |
| 90 or more Minutes | 0 | 0.0% |
Commute Time by Sex in Brooklyn
The most common commute times in Brooklyn are 20 to 24 minutes (11 commuters, 78.6%) for males and 25 to 29 minutes (65 commuters, 36.7%) for females.
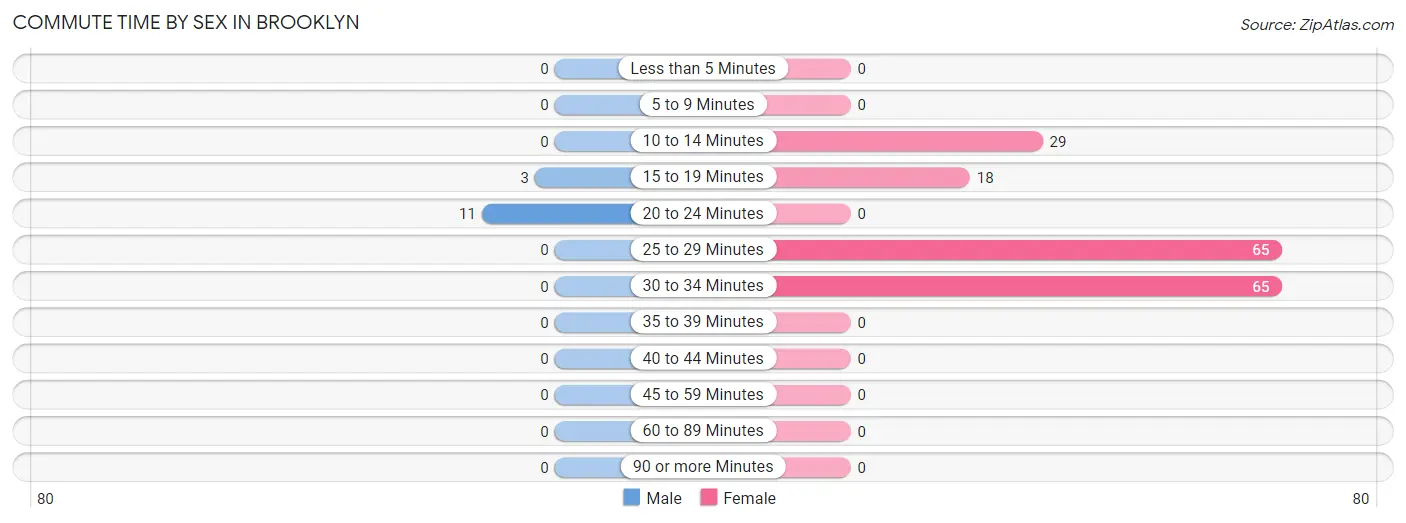
| Commute Time | Male | Female |
| Less than 5 Minutes | 0 (0.0%) | 0 (0.0%) |
| 5 to 9 Minutes | 0 (0.0%) | 0 (0.0%) |
| 10 to 14 Minutes | 0 (0.0%) | 29 (16.4%) |
| 15 to 19 Minutes | 3 (21.4%) | 18 (10.2%) |
| 20 to 24 Minutes | 11 (78.6%) | 0 (0.0%) |
| 25 to 29 Minutes | 0 (0.0%) | 65 (36.7%) |
| 30 to 34 Minutes | 0 (0.0%) | 65 (36.7%) |
| 35 to 39 Minutes | 0 (0.0%) | 0 (0.0%) |
| 40 to 44 Minutes | 0 (0.0%) | 0 (0.0%) |
| 45 to 59 Minutes | 0 (0.0%) | 0 (0.0%) |
| 60 to 89 Minutes | 0 (0.0%) | 0 (0.0%) |
| 90 or more Minutes | 0 (0.0%) | 0 (0.0%) |
Time of Departure to Work by Sex in Brooklyn
The most frequent times of departure to work in Brooklyn are 4:00 PM to 11:59 PM (11, 78.6%) for males and 4:00 PM to 11:59 PM (65, 36.7%) for females.
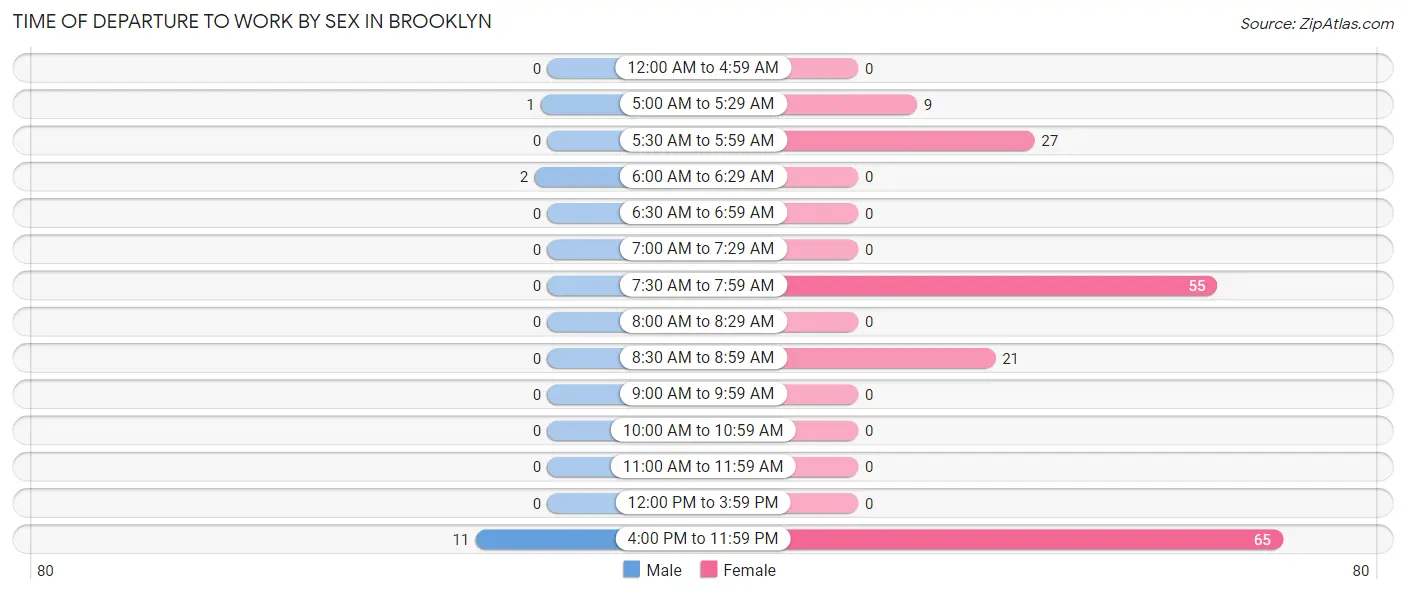
| Time of Departure | Male | Female |
| 12:00 AM to 4:59 AM | 0 (0.0%) | 0 (0.0%) |
| 5:00 AM to 5:29 AM | 1 (7.1%) | 9 (5.1%) |
| 5:30 AM to 5:59 AM | 0 (0.0%) | 27 (15.2%) |
| 6:00 AM to 6:29 AM | 2 (14.3%) | 0 (0.0%) |
| 6:30 AM to 6:59 AM | 0 (0.0%) | 0 (0.0%) |
| 7:00 AM to 7:29 AM | 0 (0.0%) | 0 (0.0%) |
| 7:30 AM to 7:59 AM | 0 (0.0%) | 55 (31.1%) |
| 8:00 AM to 8:29 AM | 0 (0.0%) | 0 (0.0%) |
| 8:30 AM to 8:59 AM | 0 (0.0%) | 21 (11.9%) |
| 9:00 AM to 9:59 AM | 0 (0.0%) | 0 (0.0%) |
| 10:00 AM to 10:59 AM | 0 (0.0%) | 0 (0.0%) |
| 11:00 AM to 11:59 AM | 0 (0.0%) | 0 (0.0%) |
| 12:00 PM to 3:59 PM | 0 (0.0%) | 0 (0.0%) |
| 4:00 PM to 11:59 PM | 11 (78.6%) | 65 (36.7%) |
| Total | 14 (100.0%) | 177 (100.0%) |
Housing Occupancy in Brooklyn
Occupancy by Ownership in Brooklyn
Of the total 204 dwellings in Brooklyn, owner-occupied units account for 115 (56.4%), while renter-occupied units make up 89 (43.6%).
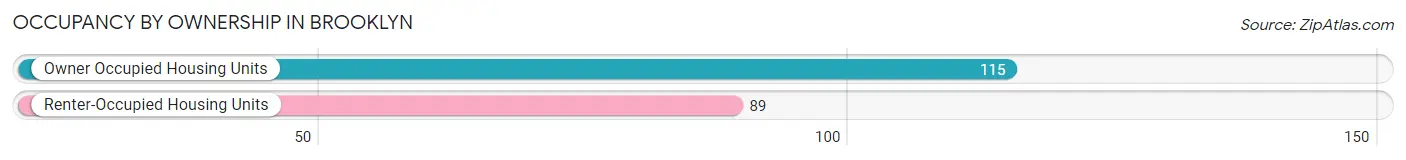
| Occupancy | # Housing Units | % Housing Units |
| Owner Occupied Housing Units | 115 | 56.4% |
| Renter-Occupied Housing Units | 89 | 43.6% |
| Total Occupied Housing Units | 204 | 100.0% |
Occupancy by Household Size in Brooklyn
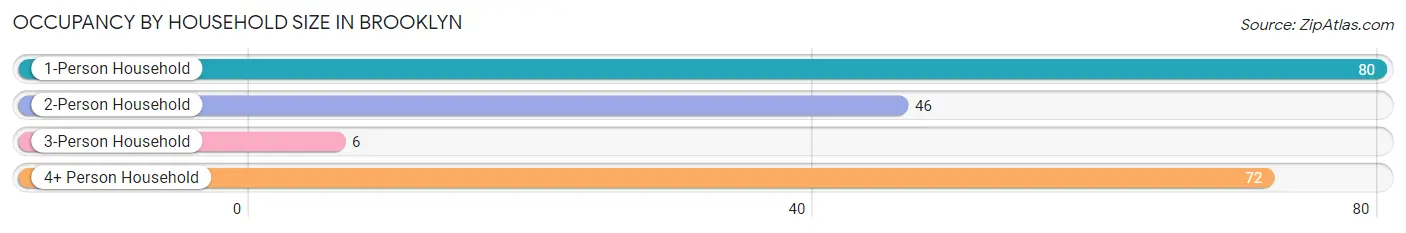
| Household Size | # Housing Units | % Housing Units |
| 1-Person Household | 80 | 39.2% |
| 2-Person Household | 46 | 22.6% |
| 3-Person Household | 6 | 2.9% |
| 4+ Person Household | 72 | 35.3% |
| Total Housing Units | 204 | 100.0% |
Occupancy by Ownership by Household Size in Brooklyn
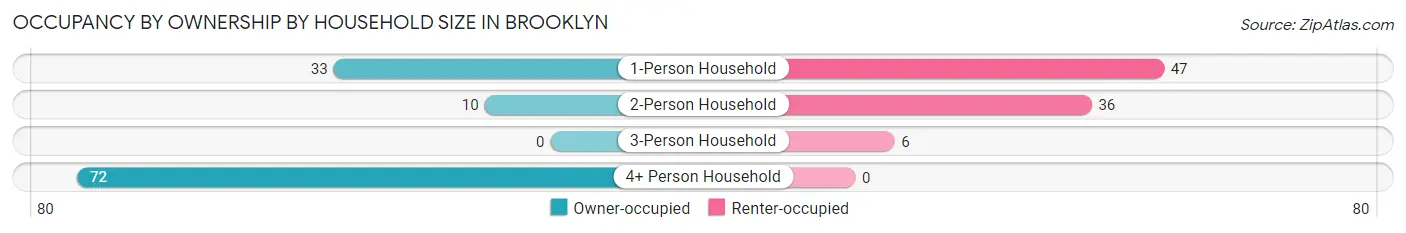
| Household Size | Owner-occupied | Renter-occupied |
| 1-Person Household | 33 (41.2%) | 47 (58.8%) |
| 2-Person Household | 10 (21.7%) | 36 (78.3%) |
| 3-Person Household | 0 (0.0%) | 6 (100.0%) |
| 4+ Person Household | 72 (100.0%) | 0 (0.0%) |
| Total Housing Units | 115 (56.4%) | 89 (43.6%) |
Occupancy by Educational Attainment in Brooklyn
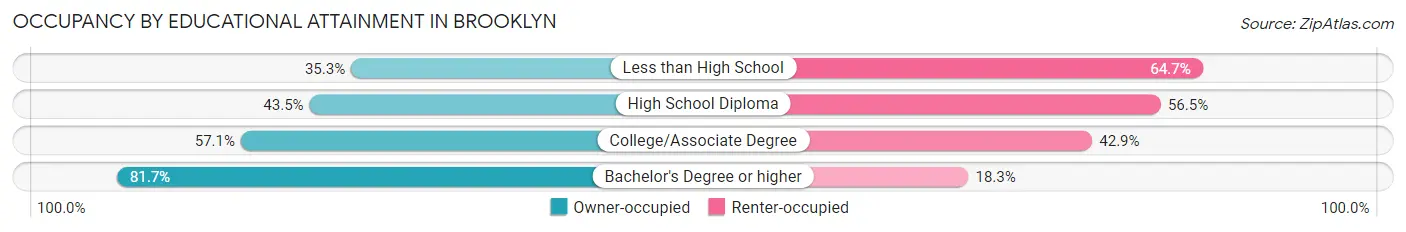
| Household Size | Owner-occupied | Renter-occupied |
| Less than High School | 12 (35.3%) | 22 (64.7%) |
| High School Diploma | 37 (43.5%) | 48 (56.5%) |
| College/Associate Degree | 8 (57.1%) | 6 (42.9%) |
| Bachelor's Degree or higher | 58 (81.7%) | 13 (18.3%) |
Occupancy by Age of Householder in Brooklyn
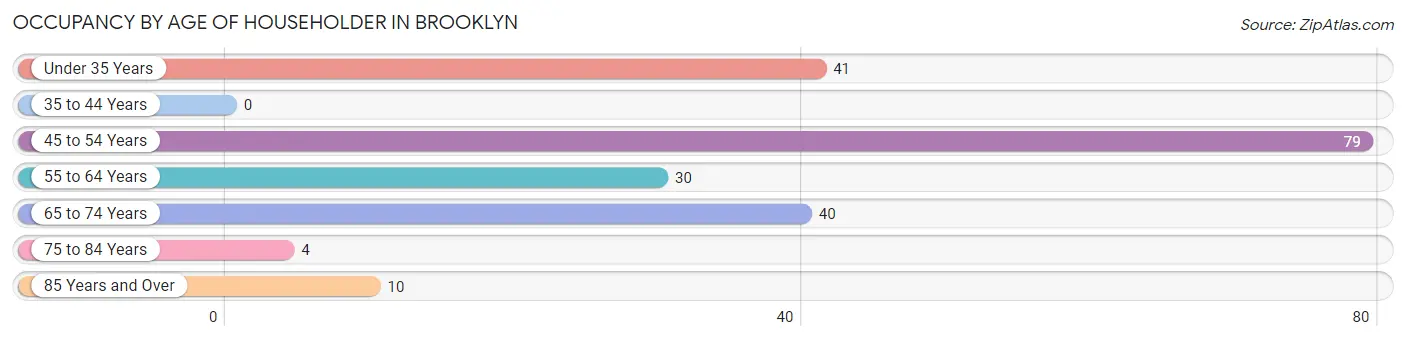
| Age Bracket | # Households | % Households |
| Under 35 Years | 41 | 20.1% |
| 35 to 44 Years | 0 | 0.0% |
| 45 to 54 Years | 79 | 38.7% |
| 55 to 64 Years | 30 | 14.7% |
| 65 to 74 Years | 40 | 19.6% |
| 75 to 84 Years | 4 | 2.0% |
| 85 Years and Over | 10 | 4.9% |
| Total | 204 | 100.0% |
Housing Finances in Brooklyn
Median Income by Occupancy in Brooklyn
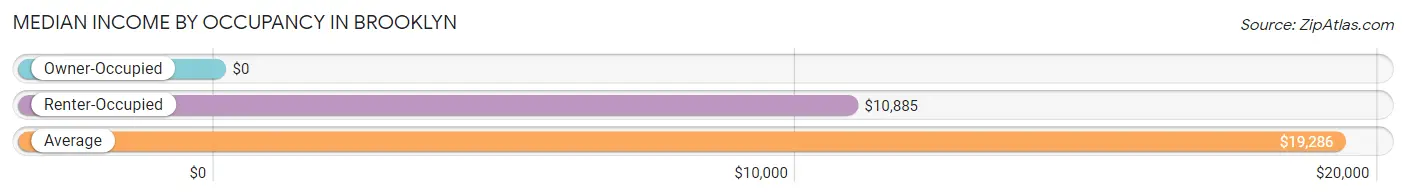
| Occupancy Type | # Households | Median Income |
| Owner-Occupied | 115 (56.4%) | $0 |
| Renter-Occupied | 89 (43.6%) | $10,885 |
| Average | 204 (100.0%) | $19,286 |
Occupancy by Householder Income Bracket in Brooklyn
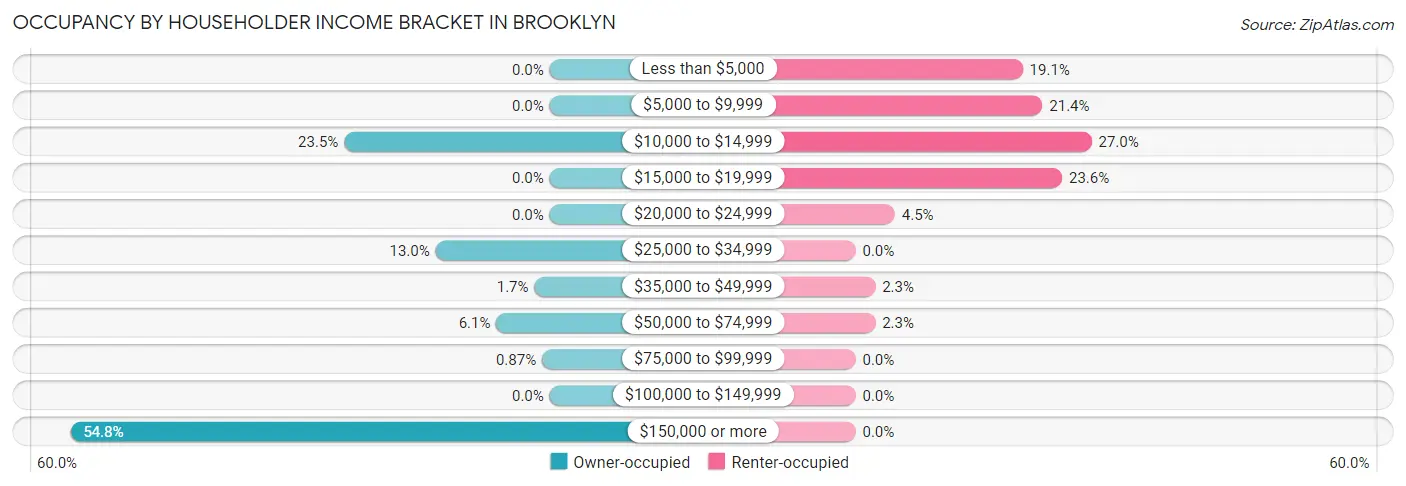
| Income Bracket | Owner-occupied | Renter-occupied |
| Less than $5,000 | 0 (0.0%) | 17 (19.1%) |
| $5,000 to $9,999 | 0 (0.0%) | 19 (21.3%) |
| $10,000 to $14,999 | 27 (23.5%) | 24 (27.0%) |
| $15,000 to $19,999 | 0 (0.0%) | 21 (23.6%) |
| $20,000 to $24,999 | 0 (0.0%) | 4 (4.5%) |
| $25,000 to $34,999 | 15 (13.0%) | 0 (0.0%) |
| $35,000 to $49,999 | 2 (1.7%) | 2 (2.2%) |
| $50,000 to $74,999 | 7 (6.1%) | 2 (2.2%) |
| $75,000 to $99,999 | 1 (0.9%) | 0 (0.0%) |
| $100,000 to $149,999 | 0 (0.0%) | 0 (0.0%) |
| $150,000 or more | 63 (54.8%) | 0 (0.0%) |
| Total | 115 (100.0%) | 89 (100.0%) |
Monthly Housing Cost Tiers in Brooklyn
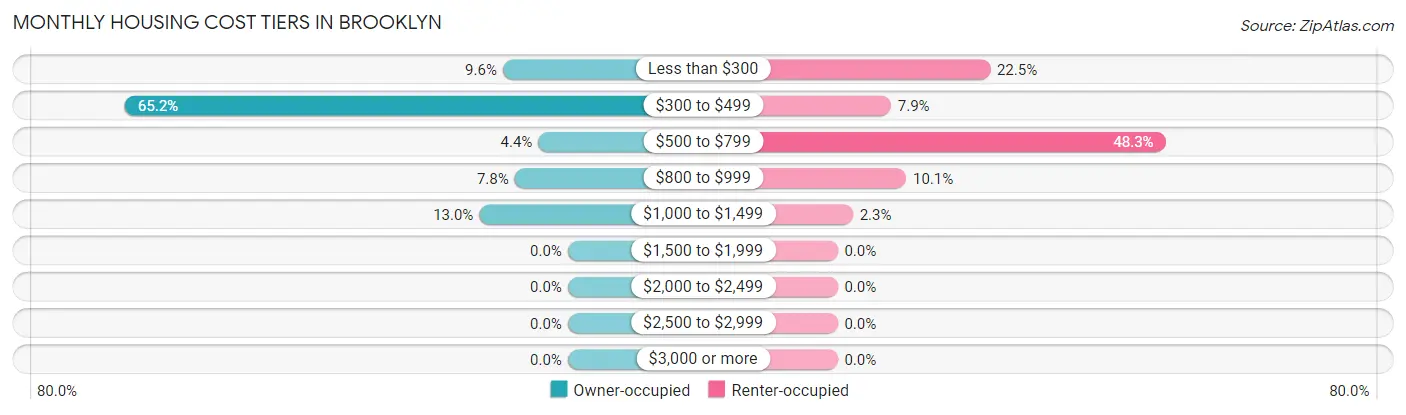
| Monthly Cost | Owner-occupied | Renter-occupied |
| Less than $300 | 11 (9.6%) | 20 (22.5%) |
| $300 to $499 | 75 (65.2%) | 7 (7.9%) |
| $500 to $799 | 5 (4.3%) | 43 (48.3%) |
| $800 to $999 | 9 (7.8%) | 9 (10.1%) |
| $1,000 to $1,499 | 15 (13.0%) | 2 (2.2%) |
| $1,500 to $1,999 | 0 (0.0%) | 0 (0.0%) |
| $2,000 to $2,499 | 0 (0.0%) | 0 (0.0%) |
| $2,500 to $2,999 | 0 (0.0%) | 0 (0.0%) |
| $3,000 or more | 0 (0.0%) | 0 (0.0%) |
| Total | 115 (100.0%) | 89 (100.0%) |
Physical Housing Characteristics in Brooklyn
Housing Structures in Brooklyn
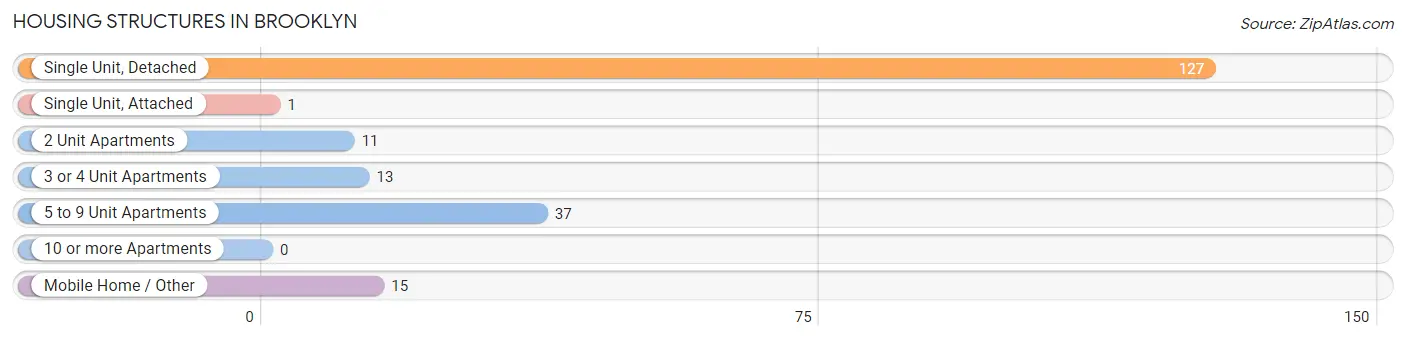
| Structure Type | # Housing Units | % Housing Units |
| Single Unit, Detached | 127 | 62.3% |
| Single Unit, Attached | 1 | 0.5% |
| 2 Unit Apartments | 11 | 5.4% |
| 3 or 4 Unit Apartments | 13 | 6.4% |
| 5 to 9 Unit Apartments | 37 | 18.1% |
| 10 or more Apartments | 0 | 0.0% |
| Mobile Home / Other | 15 | 7.3% |
| Total | 204 | 100.0% |
Housing Structures by Occupancy in Brooklyn
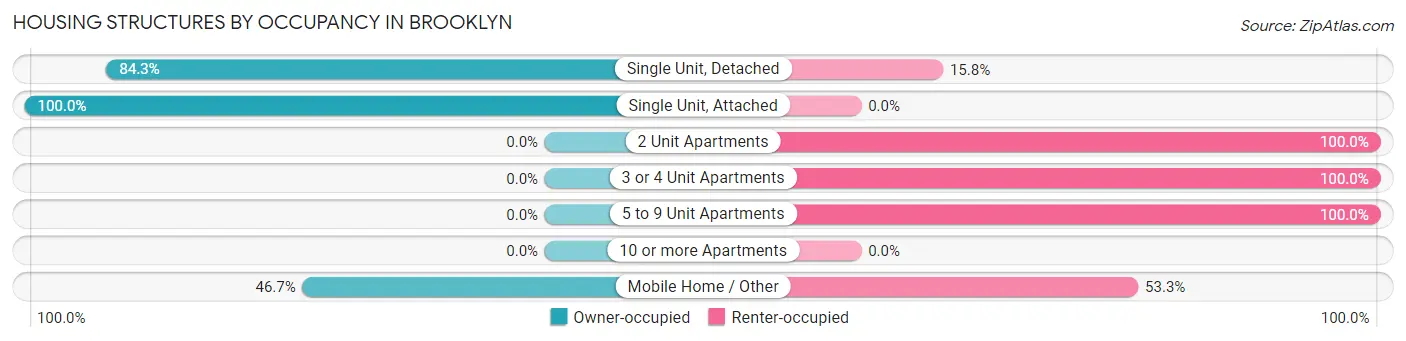
| Structure Type | Owner-occupied | Renter-occupied |
| Single Unit, Detached | 107 (84.3%) | 20 (15.8%) |
| Single Unit, Attached | 1 (100.0%) | 0 (0.0%) |
| 2 Unit Apartments | 0 (0.0%) | 11 (100.0%) |
| 3 or 4 Unit Apartments | 0 (0.0%) | 13 (100.0%) |
| 5 to 9 Unit Apartments | 0 (0.0%) | 37 (100.0%) |
| 10 or more Apartments | 0 (0.0%) | 0 (0.0%) |
| Mobile Home / Other | 7 (46.7%) | 8 (53.3%) |
| Total | 115 (56.4%) | 89 (43.6%) |
Housing Structures by Number of Rooms in Brooklyn
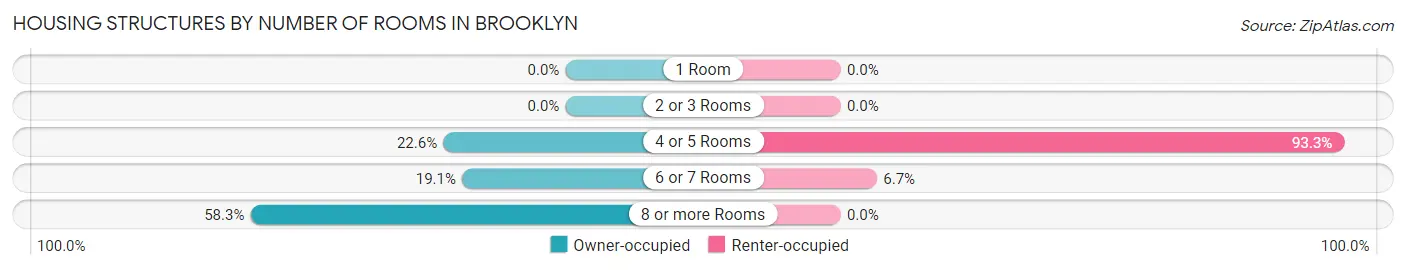
| Number of Rooms | Owner-occupied | Renter-occupied |
| 1 Room | 0 (0.0%) | 0 (0.0%) |
| 2 or 3 Rooms | 0 (0.0%) | 0 (0.0%) |
| 4 or 5 Rooms | 26 (22.6%) | 83 (93.3%) |
| 6 or 7 Rooms | 22 (19.1%) | 6 (6.7%) |
| 8 or more Rooms | 67 (58.3%) | 0 (0.0%) |
| Total | 115 (100.0%) | 89 (100.0%) |
Housing Structure by Heating Type in Brooklyn
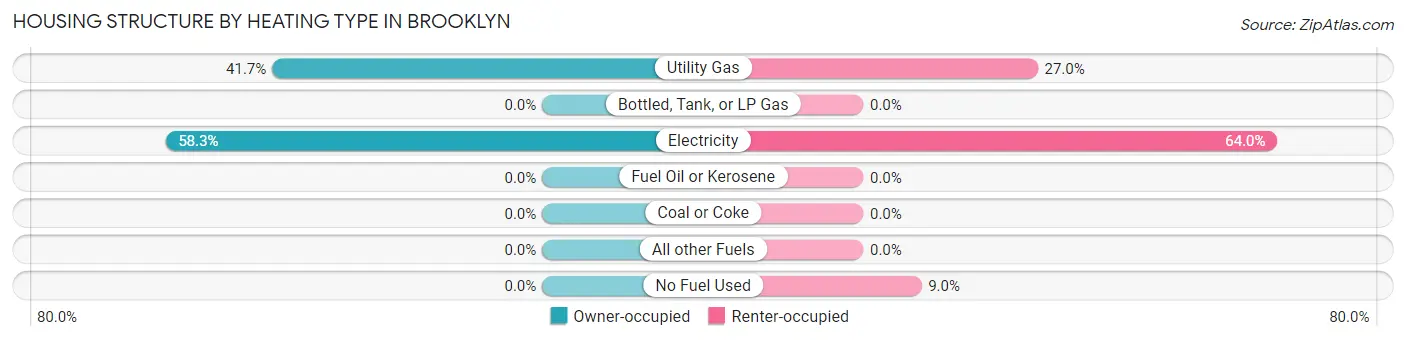
| Heating Type | Owner-occupied | Renter-occupied |
| Utility Gas | 48 (41.7%) | 24 (27.0%) |
| Bottled, Tank, or LP Gas | 0 (0.0%) | 0 (0.0%) |
| Electricity | 67 (58.3%) | 57 (64.0%) |
| Fuel Oil or Kerosene | 0 (0.0%) | 0 (0.0%) |
| Coal or Coke | 0 (0.0%) | 0 (0.0%) |
| All other Fuels | 0 (0.0%) | 0 (0.0%) |
| No Fuel Used | 0 (0.0%) | 8 (9.0%) |
| Total | 115 (100.0%) | 89 (100.0%) |
Household Vehicle Usage in Brooklyn
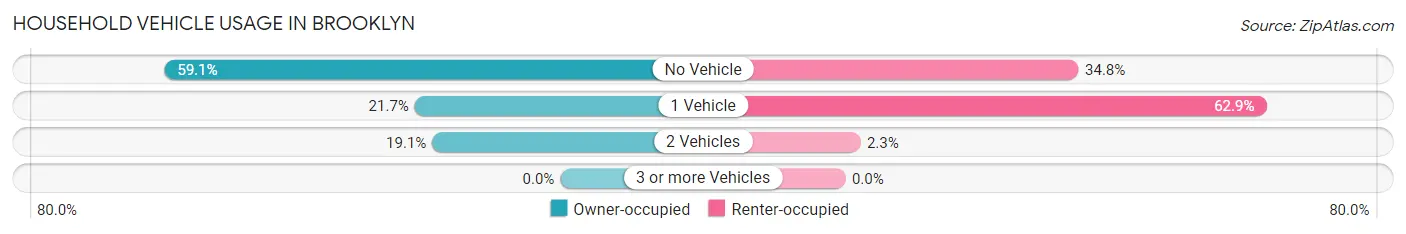
| Vehicles per Household | Owner-occupied | Renter-occupied |
| No Vehicle | 68 (59.1%) | 31 (34.8%) |
| 1 Vehicle | 25 (21.7%) | 56 (62.9%) |
| 2 Vehicles | 22 (19.1%) | 2 (2.2%) |
| 3 or more Vehicles | 0 (0.0%) | 0 (0.0%) |
| Total | 115 (100.0%) | 89 (100.0%) |
Real Estate & Mortgages in Brooklyn
Real Estate and Mortgage Overview in Brooklyn
| Characteristic | Without Mortgage | With Mortgage |
| Housing Units | 87 | 28 |
| Median Property Value | $32,400 | $0 |
| Median Household Income | $235,625 | $0 |
| Monthly Housing Costs | $435 | $0 |
| Real Estate Taxes | $253 | $5 |
Property Value by Mortgage Status in Brooklyn
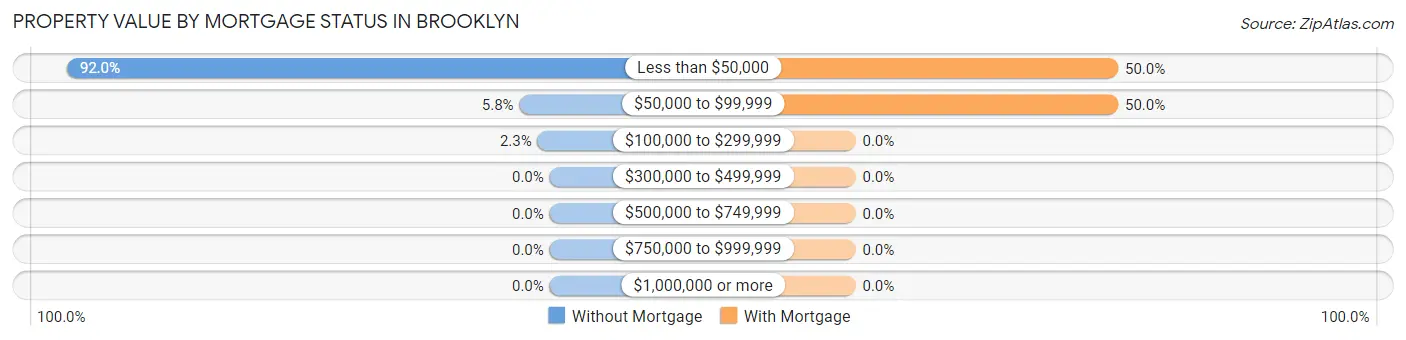
| Property Value | Without Mortgage | With Mortgage |
| Less than $50,000 | 80 (91.9%) | 14 (50.0%) |
| $50,000 to $99,999 | 5 (5.8%) | 14 (50.0%) |
| $100,000 to $299,999 | 2 (2.3%) | 0 (0.0%) |
| $300,000 to $499,999 | 0 (0.0%) | 0 (0.0%) |
| $500,000 to $749,999 | 0 (0.0%) | 0 (0.0%) |
| $750,000 to $999,999 | 0 (0.0%) | 0 (0.0%) |
| $1,000,000 or more | 0 (0.0%) | 0 (0.0%) |
| Total | 87 (100.0%) | 28 (100.0%) |
Household Income by Mortgage Status in Brooklyn
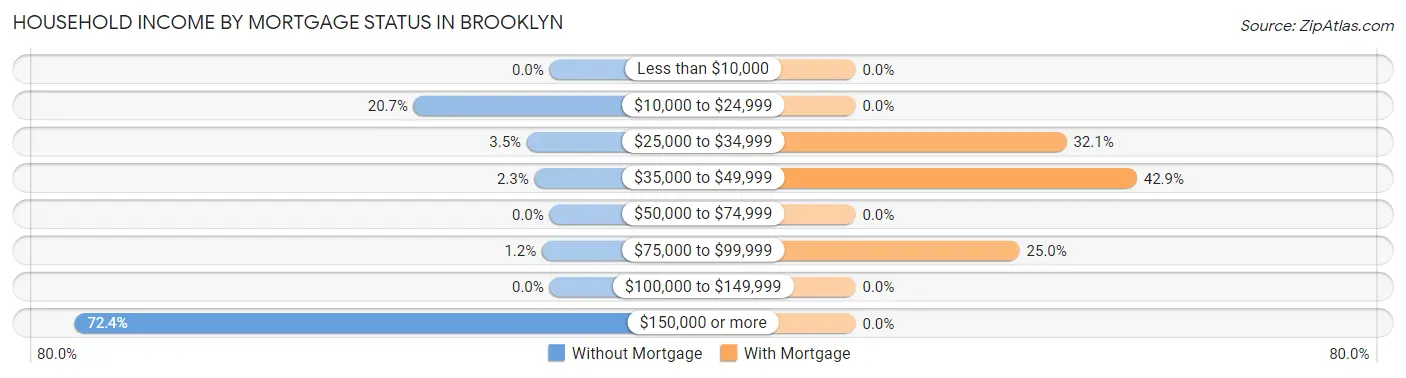
| Household Income | Without Mortgage | With Mortgage |
| Less than $10,000 | 0 (0.0%) | 0 (0.0%) |
| $10,000 to $24,999 | 18 (20.7%) | 0 (0.0%) |
| $25,000 to $34,999 | 3 (3.5%) | 9 (32.1%) |
| $35,000 to $49,999 | 2 (2.3%) | 12 (42.9%) |
| $50,000 to $74,999 | 0 (0.0%) | 0 (0.0%) |
| $75,000 to $99,999 | 1 (1.1%) | 7 (25.0%) |
| $100,000 to $149,999 | 0 (0.0%) | 0 (0.0%) |
| $150,000 or more | 63 (72.4%) | 0 (0.0%) |
| Total | 87 (100.0%) | 28 (100.0%) |
Property Value to Household Income Ratio in Brooklyn
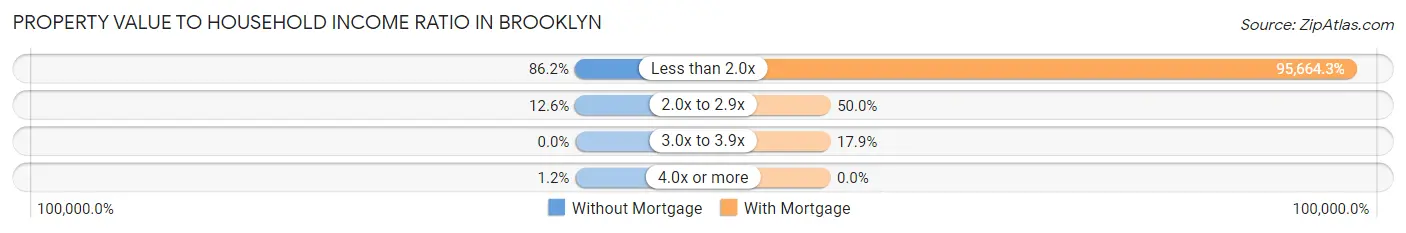
| Value-to-Income Ratio | Without Mortgage | With Mortgage |
| Less than 2.0x | 75 (86.2%) | 26,786 (95,664.3%) |
| 2.0x to 2.9x | 11 (12.6%) | 14 (50.0%) |
| 3.0x to 3.9x | 0 (0.0%) | 5 (17.9%) |
| 4.0x or more | 1 (1.1%) | 0 (0.0%) |
| Total | 87 (100.0%) | 28 (100.0%) |
Real Estate Taxes by Mortgage Status in Brooklyn
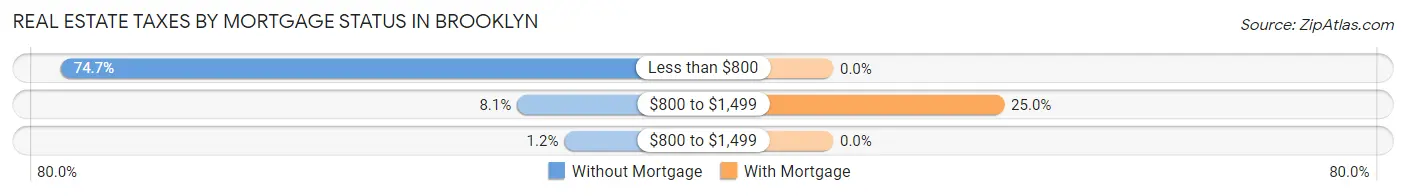
| Property Taxes | Without Mortgage | With Mortgage |
| Less than $800 | 65 (74.7%) | 0 (0.0%) |
| $800 to $1,499 | 7 (8.1%) | 7 (25.0%) |
| $800 to $1,499 | 1 (1.1%) | 0 (0.0%) |
| Total | 87 (100.0%) | 28 (100.0%) |
Health & Disability in Brooklyn
Health Insurance Coverage by Age in Brooklyn
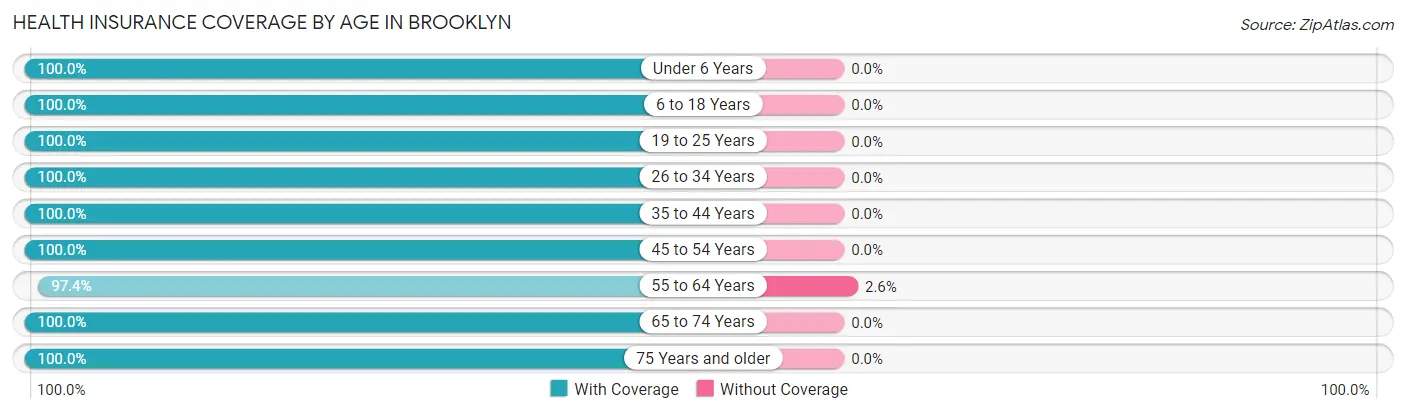
| Age Bracket | With Coverage | Without Coverage |
| Under 6 Years | 120 (100.0%) | 0 (0.0%) |
| 6 to 18 Years | 65 (100.0%) | 0 (0.0%) |
| 19 to 25 Years | 11 (100.0%) | 0 (0.0%) |
| 26 to 34 Years | 154 (100.0%) | 0 (0.0%) |
| 35 to 44 Years | 55 (100.0%) | 0 (0.0%) |
| 45 to 54 Years | 79 (100.0%) | 0 (0.0%) |
| 55 to 64 Years | 38 (97.4%) | 1 (2.6%) |
| 65 to 74 Years | 91 (100.0%) | 0 (0.0%) |
| 75 Years and older | 15 (100.0%) | 0 (0.0%) |
| Total | 628 (99.8%) | 1 (0.2%) |
Health Insurance Coverage by Citizenship Status in Brooklyn
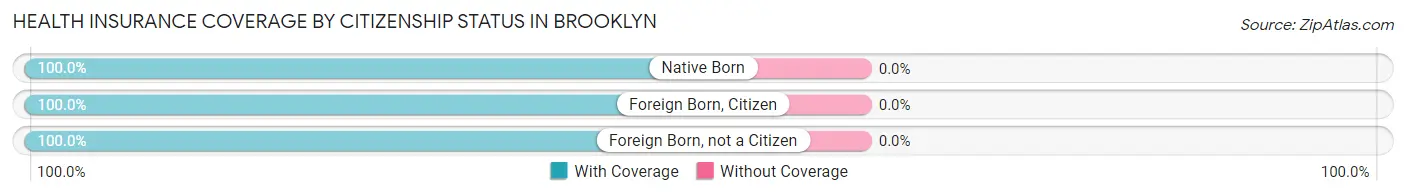
| Citizenship Status | With Coverage | Without Coverage |
| Native Born | 120 (100.0%) | 0 (0.0%) |
| Foreign Born, Citizen | 65 (100.0%) | 0 (0.0%) |
| Foreign Born, not a Citizen | 11 (100.0%) | 0 (0.0%) |
Health Insurance Coverage by Household Income in Brooklyn
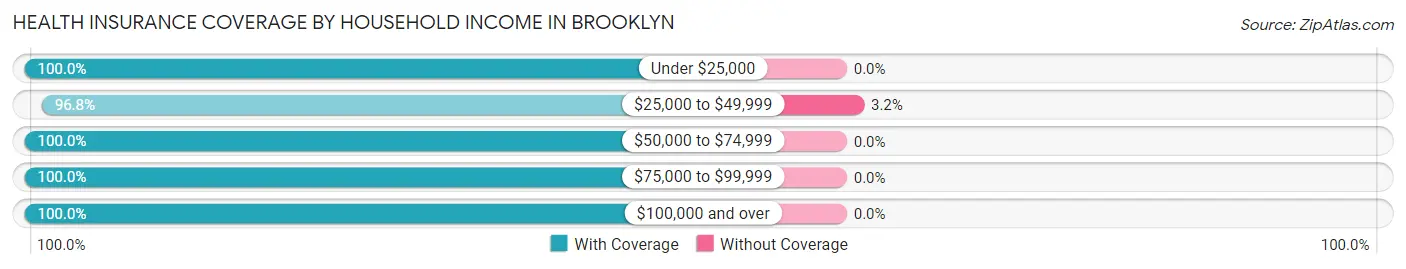
| Household Income | With Coverage | Without Coverage |
| Under $25,000 | 179 (100.0%) | 0 (0.0%) |
| $25,000 to $49,999 | 30 (96.8%) | 1 (3.2%) |
| $50,000 to $74,999 | 13 (100.0%) | 0 (0.0%) |
| $75,000 to $99,999 | 2 (100.0%) | 0 (0.0%) |
| $100,000 and over | 404 (100.0%) | 0 (0.0%) |
Public vs Private Health Insurance Coverage by Age in Brooklyn
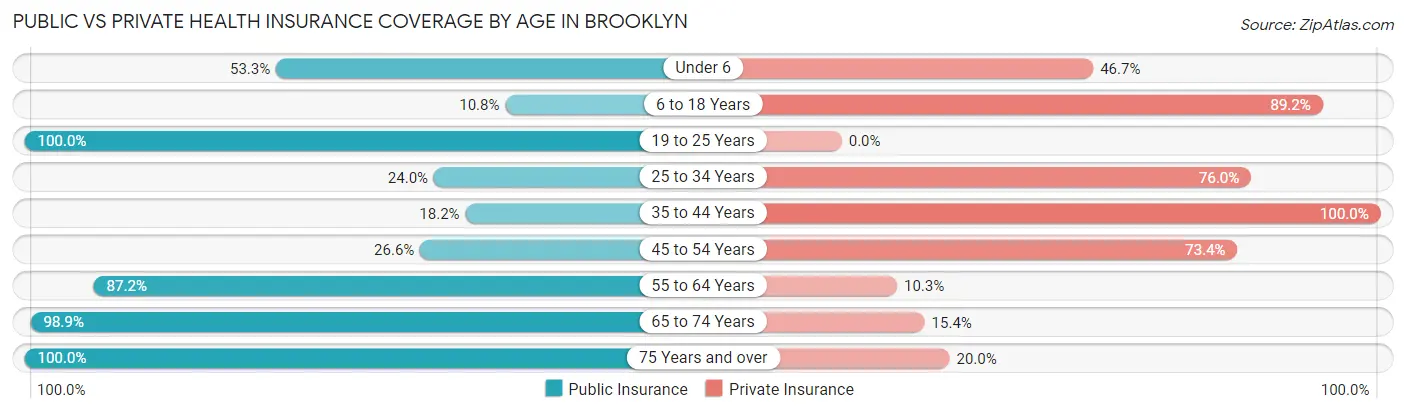
| Age Bracket | Public Insurance | Private Insurance |
| Under 6 | 64 (53.3%) | 56 (46.7%) |
| 6 to 18 Years | 7 (10.8%) | 58 (89.2%) |
| 19 to 25 Years | 11 (100.0%) | 0 (0.0%) |
| 25 to 34 Years | 37 (24.0%) | 117 (76.0%) |
| 35 to 44 Years | 10 (18.2%) | 55 (100.0%) |
| 45 to 54 Years | 21 (26.6%) | 58 (73.4%) |
| 55 to 64 Years | 34 (87.2%) | 4 (10.3%) |
| 65 to 74 Years | 90 (98.9%) | 14 (15.4%) |
| 75 Years and over | 15 (100.0%) | 3 (20.0%) |
| Total | 289 (46.0%) | 365 (58.0%) |
Disability Status by Sex by Age in Brooklyn
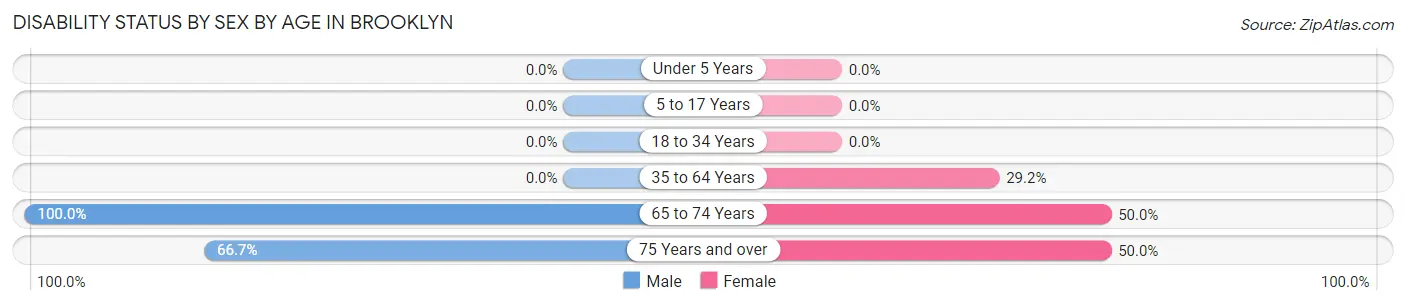
| Age Bracket | Male | Female |
| Under 5 Years | 0 (0.0%) | 0 (0.0%) |
| 5 to 17 Years | 0 (0.0%) | 0 (0.0%) |
| 18 to 34 Years | 0 (0.0%) | 0 (0.0%) |
| 35 to 64 Years | 0 (0.0%) | 45 (29.2%) |
| 65 to 74 Years | 49 (100.0%) | 21 (50.0%) |
| 75 Years and over | 6 (66.7%) | 3 (50.0%) |
Disability Class by Sex by Age in Brooklyn
Disability Class: Hearing Difficulty
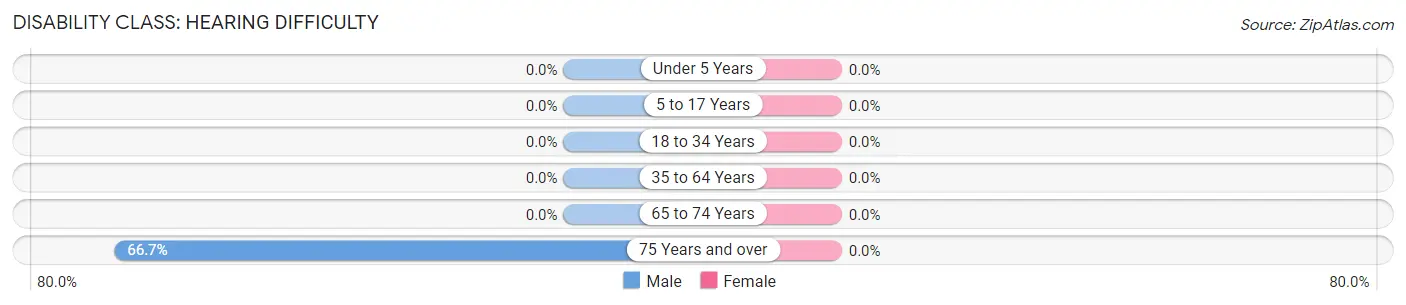
| Age Bracket | Male | Female |
| Under 5 Years | 0 (0.0%) | 0 (0.0%) |
| 5 to 17 Years | 0 (0.0%) | 0 (0.0%) |
| 18 to 34 Years | 0 (0.0%) | 0 (0.0%) |
| 35 to 64 Years | 0 (0.0%) | 0 (0.0%) |
| 65 to 74 Years | 0 (0.0%) | 0 (0.0%) |
| 75 Years and over | 6 (66.7%) | 0 (0.0%) |
Disability Class: Vision Difficulty
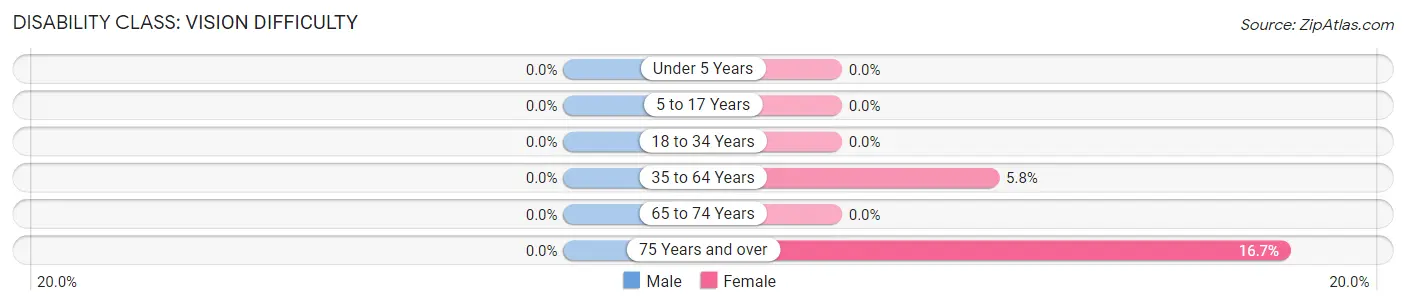
| Age Bracket | Male | Female |
| Under 5 Years | 0 (0.0%) | 0 (0.0%) |
| 5 to 17 Years | 0 (0.0%) | 0 (0.0%) |
| 18 to 34 Years | 0 (0.0%) | 0 (0.0%) |
| 35 to 64 Years | 0 (0.0%) | 9 (5.8%) |
| 65 to 74 Years | 0 (0.0%) | 0 (0.0%) |
| 75 Years and over | 0 (0.0%) | 1 (16.7%) |
Disability Class: Cognitive Difficulty
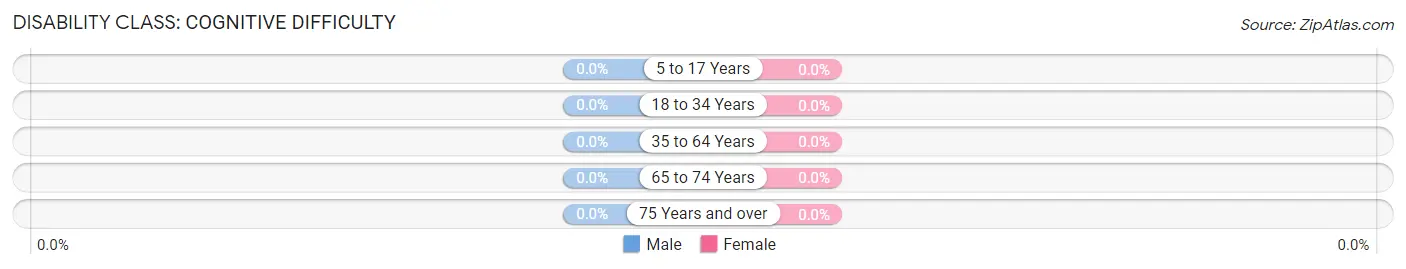
| Age Bracket | Male | Female |
| 5 to 17 Years | 0 (0.0%) | 0 (0.0%) |
| 18 to 34 Years | 0 (0.0%) | 0 (0.0%) |
| 35 to 64 Years | 0 (0.0%) | 0 (0.0%) |
| 65 to 74 Years | 0 (0.0%) | 0 (0.0%) |
| 75 Years and over | 0 (0.0%) | 0 (0.0%) |
Disability Class: Ambulatory Difficulty
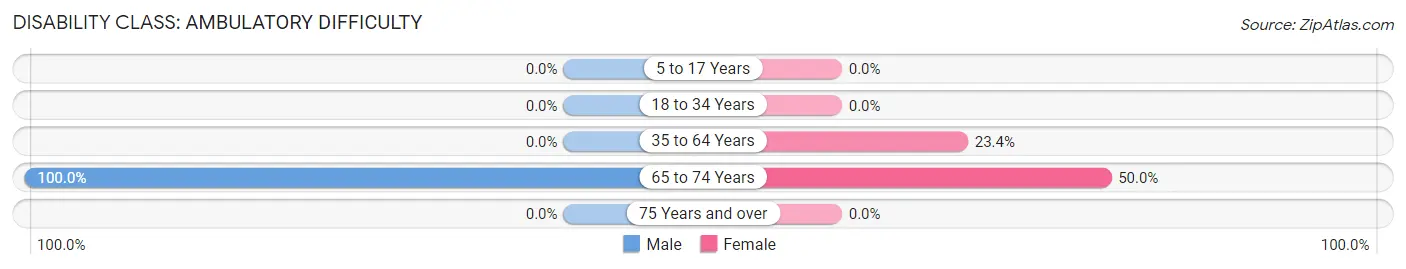
| Age Bracket | Male | Female |
| 5 to 17 Years | 0 (0.0%) | 0 (0.0%) |
| 18 to 34 Years | 0 (0.0%) | 0 (0.0%) |
| 35 to 64 Years | 0 (0.0%) | 36 (23.4%) |
| 65 to 74 Years | 49 (100.0%) | 21 (50.0%) |
| 75 Years and over | 0 (0.0%) | 0 (0.0%) |
Disability Class: Self-Care Difficulty
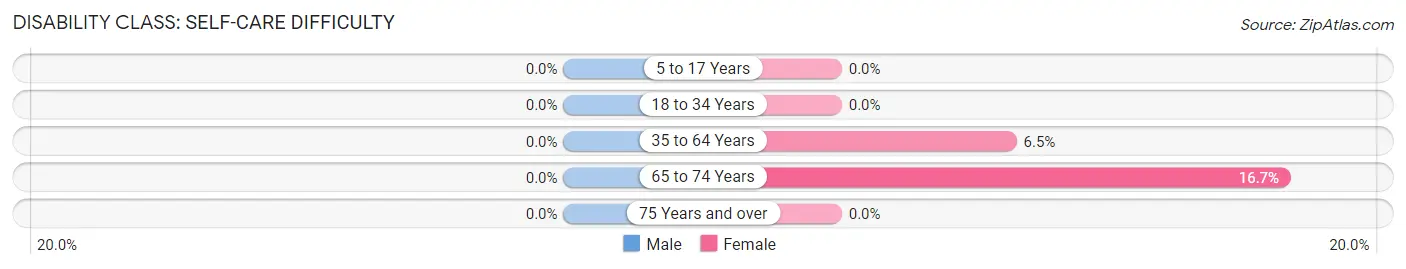
| Age Bracket | Male | Female |
| 5 to 17 Years | 0 (0.0%) | 0 (0.0%) |
| 18 to 34 Years | 0 (0.0%) | 0 (0.0%) |
| 35 to 64 Years | 0 (0.0%) | 10 (6.5%) |
| 65 to 74 Years | 0 (0.0%) | 7 (16.7%) |
| 75 Years and over | 0 (0.0%) | 0 (0.0%) |
Technology Access in Brooklyn
Computing Device Access in Brooklyn
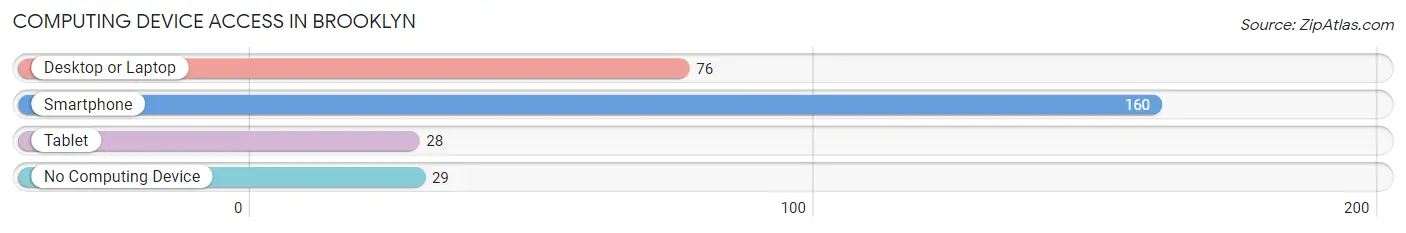
| Device Type | # Households | % Households |
| Desktop or Laptop | 76 | 37.2% |
| Smartphone | 160 | 78.4% |
| Tablet | 28 | 13.7% |
| No Computing Device | 29 | 14.2% |
| Total | 204 | 100.0% |
Internet Access in Brooklyn
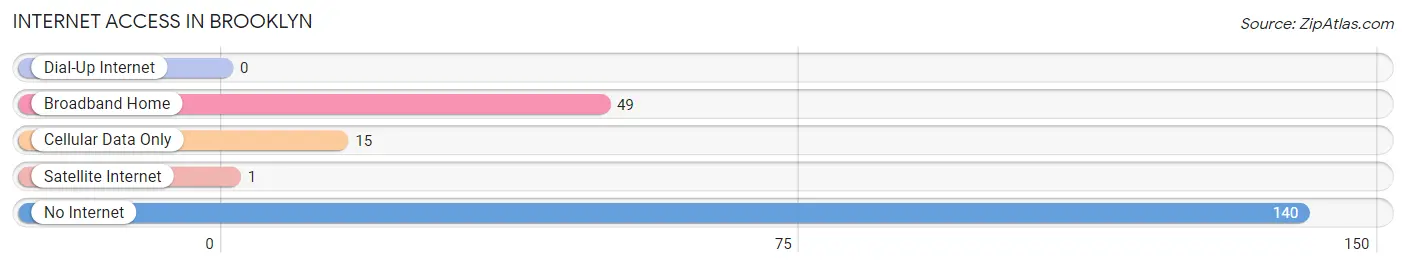
| Internet Type | # Households | % Households |
| Dial-Up Internet | 0 | 0.0% |
| Broadband Home | 49 | 24.0% |
| Cellular Data Only | 15 | 7.3% |
| Satellite Internet | 1 | 0.5% |
| No Internet | 140 | 68.6% |
| Total | 204 | 100.0% |
Brooklyn Summary
Brooklyn, Illinois is a small village located in St. Clair County, Illinois. It is situated on the banks of the Mississippi River, just south of the city of East St. Louis. The village has a population of just over 1,000 people, and is part of the Greater St. Louis metropolitan area.
History
The area that is now Brooklyn was first settled in the early 1800s by French and German immigrants. The village was originally known as “La Prairie”, and was later renamed “Brooklyn” in 1837. The name was chosen in honor of the Brooklyn neighborhood in New York City.
The village was incorporated in 1872, and the first mayor was elected in 1873. The village grew slowly over the years, and by the early 1900s, it had a population of around 500 people.
In the 1950s, the village experienced a period of rapid growth, as many people moved to the area from other parts of the country. This growth continued until the late 1970s, when the population began to decline.
Geography
Brooklyn is located in St. Clair County, Illinois, on the banks of the Mississippi River. It is situated just south of the city of East St. Louis, and is part of the Greater St. Louis metropolitan area.
The village covers an area of 1.2 square miles, and has a population density of 845 people per square mile. The terrain is mostly flat, with some rolling hills in the northern part of the village.
Economy
The economy of Brooklyn is largely based on agriculture and manufacturing. The village is home to several small businesses, including a grocery store, a hardware store, and a few restaurants.
The village also has a few industrial parks, which are home to several manufacturing companies. The largest employer in the village is the Brooklyn School District, which employs over 200 people.
Demographics
As of the 2010 census, the population of Brooklyn was 1,072. The racial makeup of the village was 94.3% White, 2.2% African American, 0.3% Native American, 0.7% Asian, 0.1% Pacific Islander, and 2.4% from other races.
The median household income in Brooklyn was $41,250, and the median family income was $45,000. The per capita income was $19,845. About 11.2% of the population was below the poverty line.
The village is served by the Brooklyn School District, which consists of two elementary schools, one middle school, and one high school. The village also has a public library, a post office, and several churches.
Common Questions
What is Per Capita Income in Brooklyn?
Per Capita income in Brooklyn is $30,523.
What is the Median Household income in Brooklyn?
Median Household Income in Brooklyn is $19,286.
What is Income or Wage Gap in Brooklyn?
Income or Wage Gap in Brooklyn is 15.9%.
Women in Brooklyn earn 84.1 cents for every dollar earned by a man.
What is Family Income Deficit in Brooklyn?
Family Income Deficit in Brooklyn is $14,657.
Families that are below poverty line in Brooklyn earn $14,657 less on average than the poverty threshold level.
What is Inequality or Gini Index in Brooklyn?
Inequality or Gini Index in Brooklyn is 0.59.
What is the Total Population of Brooklyn?
Total Population of Brooklyn is 629.
What is the Total Male Population of Brooklyn?
Total Male Population of Brooklyn is 260.
What is the Total Female Population of Brooklyn?
Total Female Population of Brooklyn is 369.
What is the Ratio of Males per 100 Females in Brooklyn?
There are 70.46 Males per 100 Females in Brooklyn.
What is the Ratio of Females per 100 Males in Brooklyn?
There are 141.92 Females per 100 Males in Brooklyn.
What is the Median Population Age in Brooklyn?
Median Population Age in Brooklyn is 29.7 Years.
What is the Average Family Size in Brooklyn
Average Family Size in Brooklyn is 4.0 People.
What is the Average Household Size in Brooklyn
Average Household Size in Brooklyn is 3.1 People.
How Large is the Labor Force in Brooklyn?
There are 307 People in the Labor Forcein in Brooklyn.
What is the Percentage of People in the Labor Force in Brooklyn?
68.8% of People are in the Labor Force in Brooklyn.
What is the Unemployment Rate in Brooklyn?
Unemployment Rate in Brooklyn is 12.1%.