Ford Heights, IL Map & Demographics
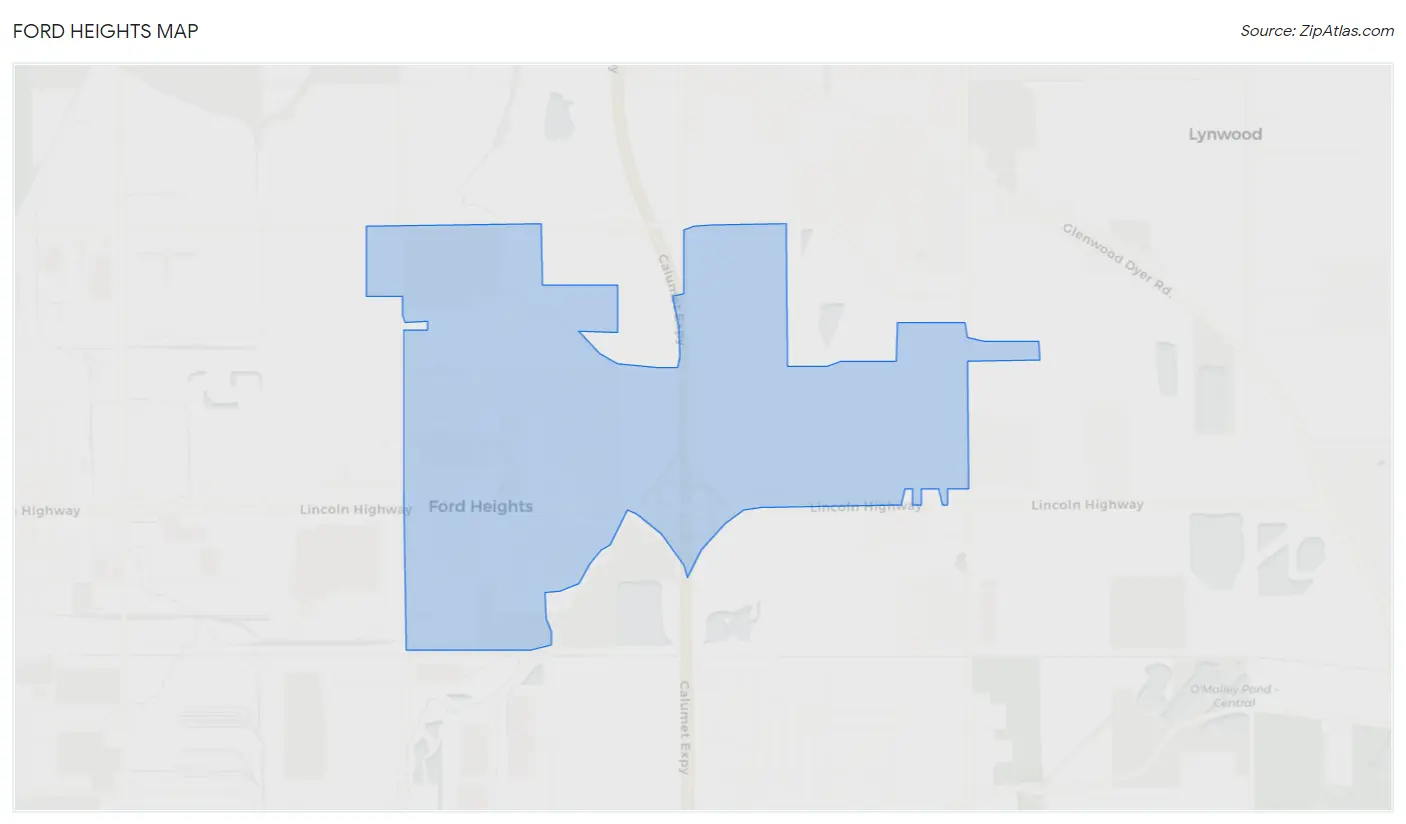
Ford Heights Map
Ford Heights Overview
$15,803
PER CAPITA INCOME
$46,422
AVG FAMILY INCOME
$43,086
AVG HOUSEHOLD INCOME
0.39
INEQUALITY / GINI INDEX
1,618
TOTAL POPULATION
805
MALE POPULATION
813
FEMALE POPULATION
99.02
MALES / 100 FEMALES
100.99
FEMALES / 100 MALES
37.4
MEDIAN AGE
4.0
AVG FAMILY SIZE
2.8
AVG HOUSEHOLD SIZE
599
LABOR FORCE [ PEOPLE ]
47.2%
PERCENT IN LABOR FORCE
11.2%
UNEMPLOYMENT RATE
Ford Heights Area Codes
Income in Ford Heights
Income Overview in Ford Heights
Per Capita Income in Ford Heights is $15,803, while median incomes of families and households are $46,422 and $43,086 respectively.
| Characteristic | Number | Measure |
| Per Capita Income | 1,618 | $15,803 |
| Median Family Income | 343 | $46,422 |
| Mean Family Income | 343 | $47,253 |
| Median Household Income | 569 | $43,086 |
| Mean Household Income | 569 | $41,410 |
| Income Deficit | 343 | $0 |
| Wage / Income Gap (%) | 1,618 | 0.00% |
| Wage / Income Gap ($) | 1,618 | 100.00¢ per $1 |
| Gini / Inequality Index | 1,618 | 0.39 |
Earnings by Sex in Ford Heights
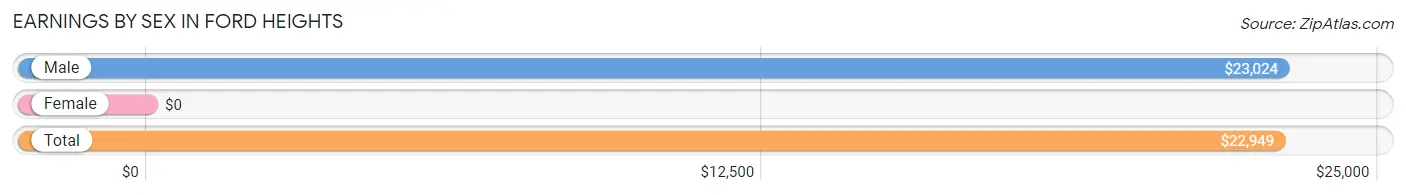
| Sex | Number | Average Earnings |
| Male | 320 (54.6%) | $23,024 |
| Female | 266 (45.4%) | $0 |
| Total | 586 (100.0%) | $22,949 |
Earnings by Sex by Income Bracket in Ford Heights
The most common earnings brackets in Ford Heights are $22,500 to $24,999 for men (62 | 19.4%) and $10,000 to $12,499 for women (42 | 15.8%).
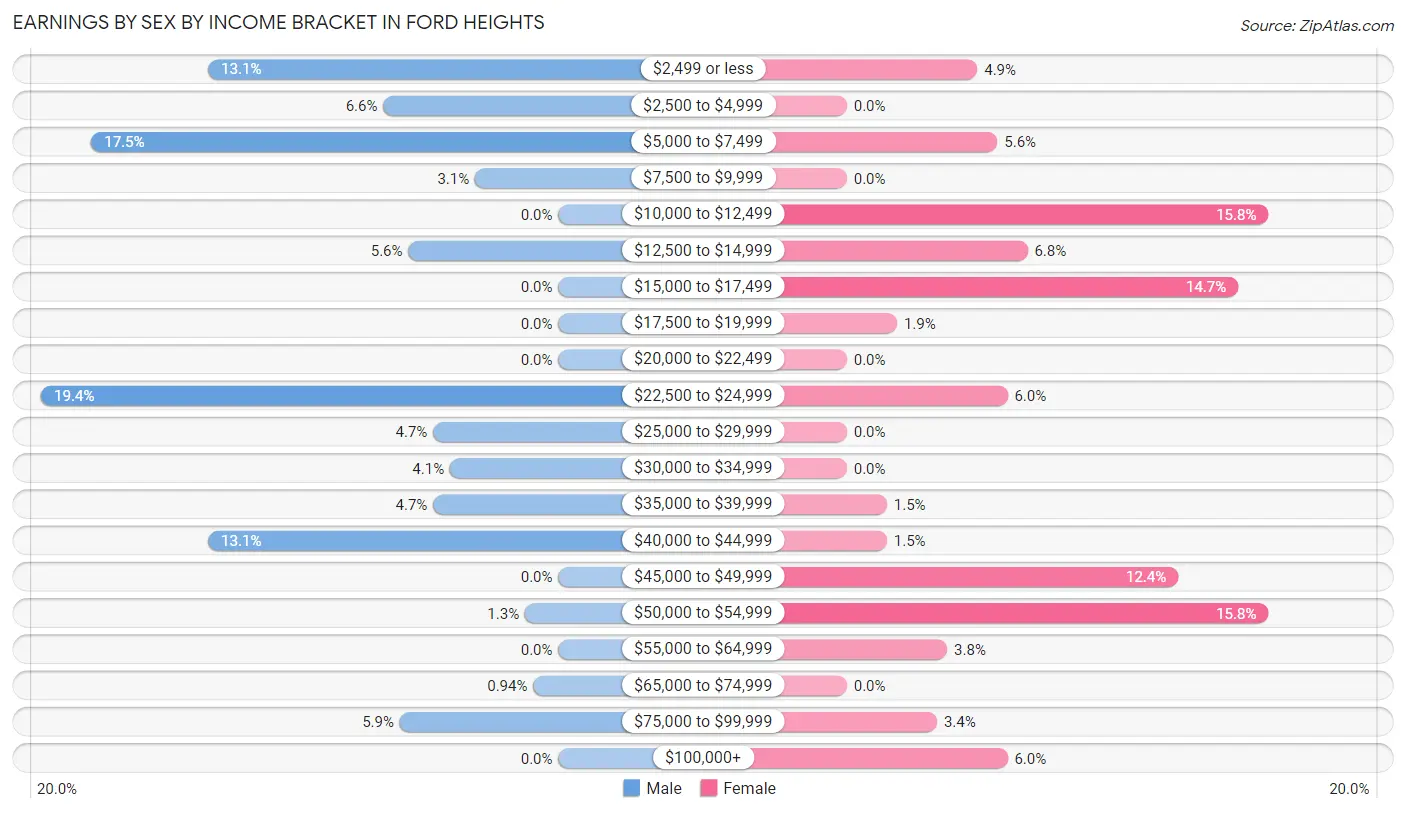
| Income | Male | Female |
| $2,499 or less | 42 (13.1%) | 13 (4.9%) |
| $2,500 to $4,999 | 21 (6.6%) | 0 (0.0%) |
| $5,000 to $7,499 | 56 (17.5%) | 15 (5.6%) |
| $7,500 to $9,999 | 10 (3.1%) | 0 (0.0%) |
| $10,000 to $12,499 | 0 (0.0%) | 42 (15.8%) |
| $12,500 to $14,999 | 18 (5.6%) | 18 (6.8%) |
| $15,000 to $17,499 | 0 (0.0%) | 39 (14.7%) |
| $17,500 to $19,999 | 0 (0.0%) | 5 (1.9%) |
| $20,000 to $22,499 | 0 (0.0%) | 0 (0.0%) |
| $22,500 to $24,999 | 62 (19.4%) | 16 (6.0%) |
| $25,000 to $29,999 | 15 (4.7%) | 0 (0.0%) |
| $30,000 to $34,999 | 13 (4.1%) | 0 (0.0%) |
| $35,000 to $39,999 | 15 (4.7%) | 4 (1.5%) |
| $40,000 to $44,999 | 42 (13.1%) | 4 (1.5%) |
| $45,000 to $49,999 | 0 (0.0%) | 33 (12.4%) |
| $50,000 to $54,999 | 4 (1.3%) | 42 (15.8%) |
| $55,000 to $64,999 | 0 (0.0%) | 10 (3.8%) |
| $65,000 to $74,999 | 3 (0.9%) | 0 (0.0%) |
| $75,000 to $99,999 | 19 (5.9%) | 9 (3.4%) |
| $100,000+ | 0 (0.0%) | 16 (6.0%) |
| Total | 320 (100.0%) | 266 (100.0%) |
Earnings by Sex by Educational Attainment in Ford Heights
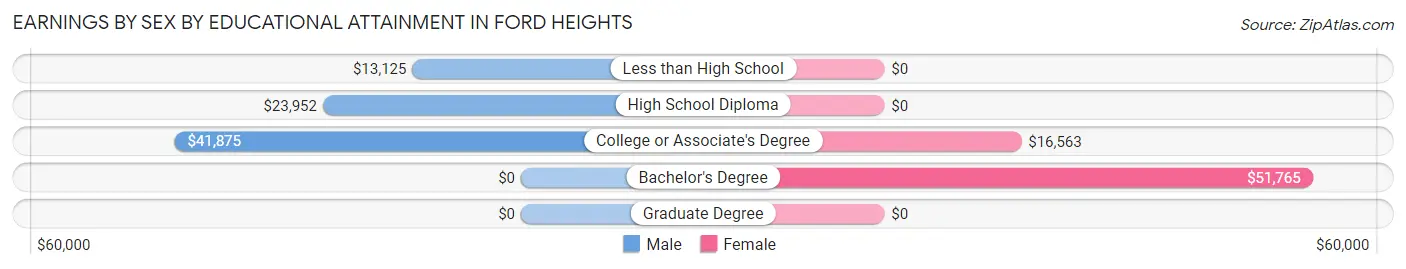
| Educational Attainment | Male Income | Female Income |
| Less than High School | $13,125 | $0 |
| High School Diploma | $23,952 | $0 |
| College or Associate's Degree | $41,875 | $16,563 |
| Bachelor's Degree | - | - |
| Graduate Degree | - | - |
| Total | $23,468 | $0 |
Family Income in Ford Heights
Family Income Brackets in Ford Heights
According to the Ford Heights family income data, there are 113 families falling into the $50,000 to $74,999 income range, which is the most common income bracket and makes up 32.9% of all families.
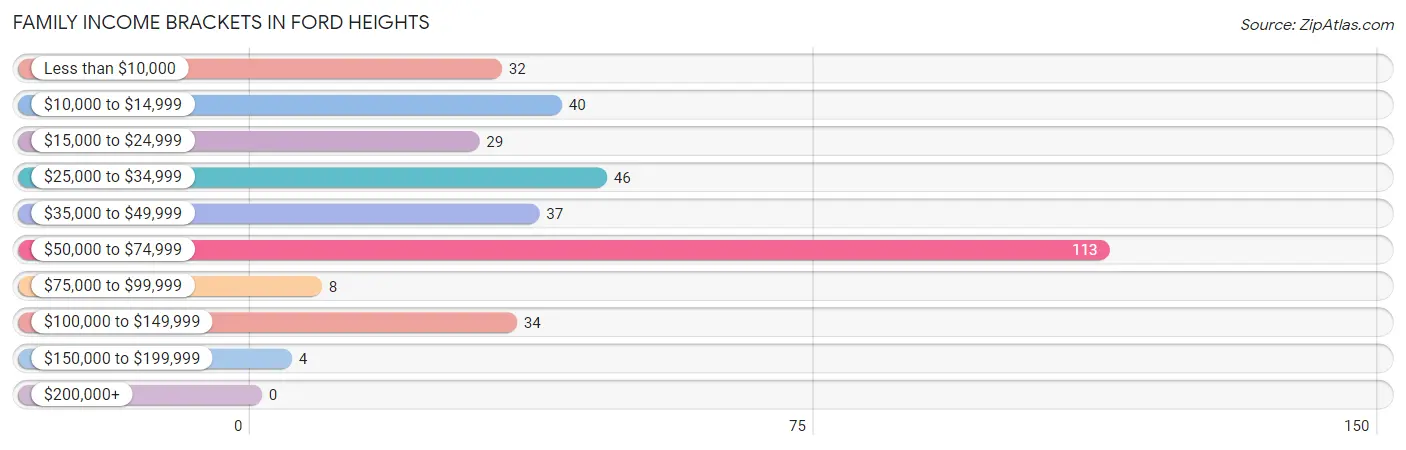
| Income Bracket | # Families | % Families |
| Less than $10,000 | 32 | 9.3% |
| $10,000 to $14,999 | 40 | 11.7% |
| $15,000 to $24,999 | 29 | 8.5% |
| $25,000 to $34,999 | 46 | 13.4% |
| $35,000 to $49,999 | 37 | 10.8% |
| $50,000 to $74,999 | 113 | 32.9% |
| $75,000 to $99,999 | 8 | 2.3% |
| $100,000 to $149,999 | 34 | 9.9% |
| $150,000 to $199,999 | 4 | 1.2% |
| $200,000+ | 0 | 0.0% |
Family Income by Famaliy Size in Ford Heights
4-person families (59 | 17.2%) account for the highest median family income in Ford Heights with $53,836 per family, while 2-person families (126 | 36.7%) have the highest median income of $23,026 per family member.
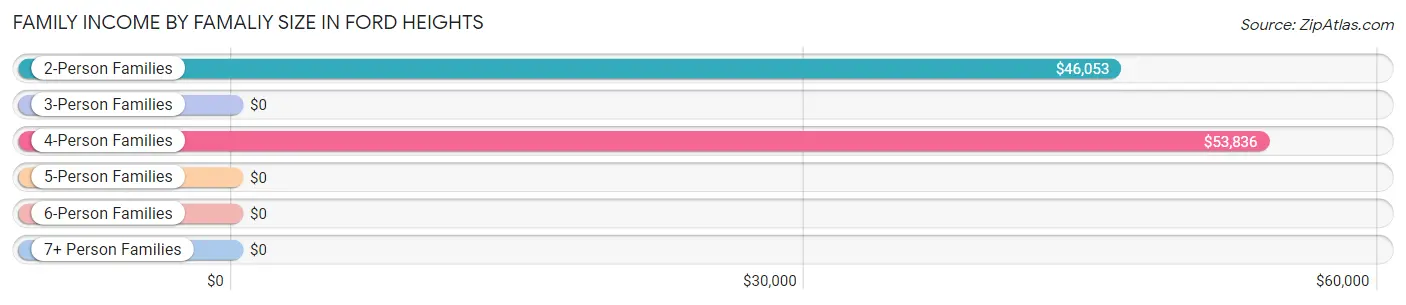
| Income Bracket | # Families | Median Income |
| 2-Person Families | 126 (36.7%) | $46,053 |
| 3-Person Families | 104 (30.3%) | $0 |
| 4-Person Families | 59 (17.2%) | $53,836 |
| 5-Person Families | 15 (4.4%) | $0 |
| 6-Person Families | 31 (9.0%) | $0 |
| 7+ Person Families | 8 (2.3%) | $0 |
| Total | 343 (100.0%) | $46,422 |
Family Income by Number of Earners in Ford Heights
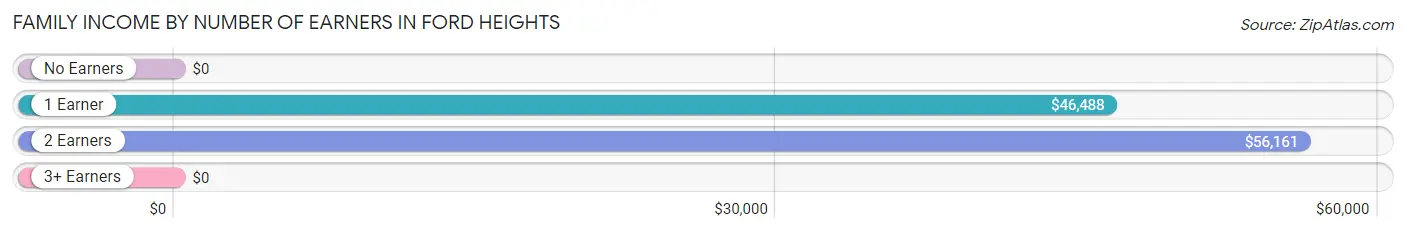
| Number of Earners | # Families | Median Income |
| No Earners | 60 (17.5%) | $0 |
| 1 Earner | 185 (53.9%) | $46,488 |
| 2 Earners | 91 (26.5%) | $56,161 |
| 3+ Earners | 7 (2.0%) | $0 |
| Total | 343 (100.0%) | $46,422 |
Household Income in Ford Heights
Household Income Brackets in Ford Heights
With 152 households falling in the category, the $50,000 to $74,999 income range is the most frequent in Ford Heights, accounting for 26.7% of all households.
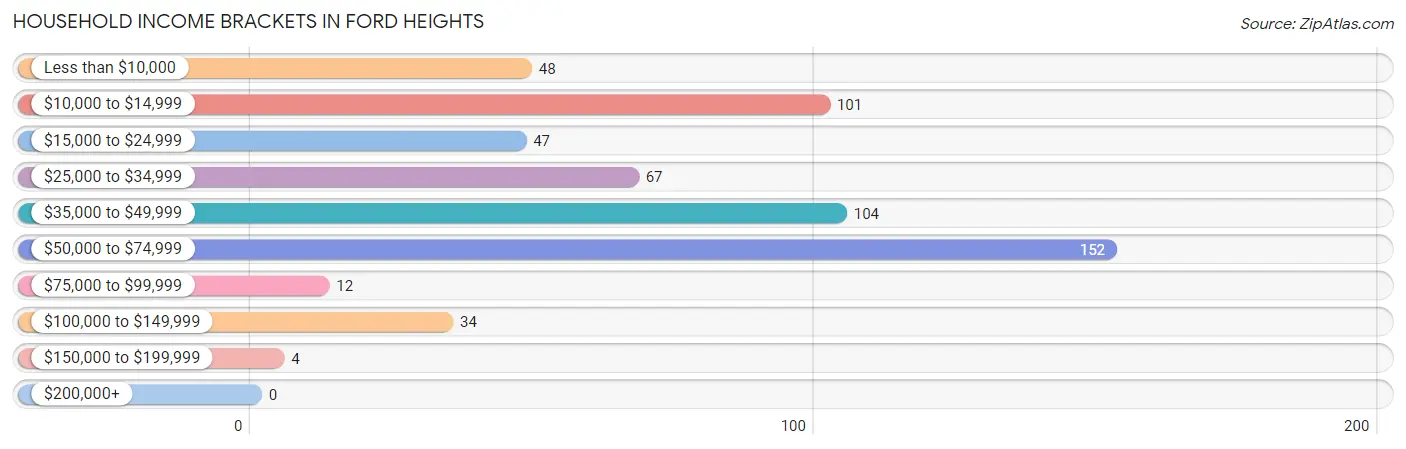
| Income Bracket | # Households | % Households |
| Less than $10,000 | 48 | 8.4% |
| $10,000 to $14,999 | 101 | 17.8% |
| $15,000 to $24,999 | 47 | 8.3% |
| $25,000 to $34,999 | 67 | 11.8% |
| $35,000 to $49,999 | 104 | 18.3% |
| $50,000 to $74,999 | 152 | 26.7% |
| $75,000 to $99,999 | 12 | 2.1% |
| $100,000 to $149,999 | 34 | 6.0% |
| $150,000 to $199,999 | 4 | 0.7% |
| $200,000+ | 0 | 0.0% |
Household Income by Householder Age in Ford Heights
The median household income in Ford Heights is $43,086, with the highest median household income of $47,000 found in the 45 to 64 years age bracket for the primary householder. A total of 262 households (46.1%) fall into this category.
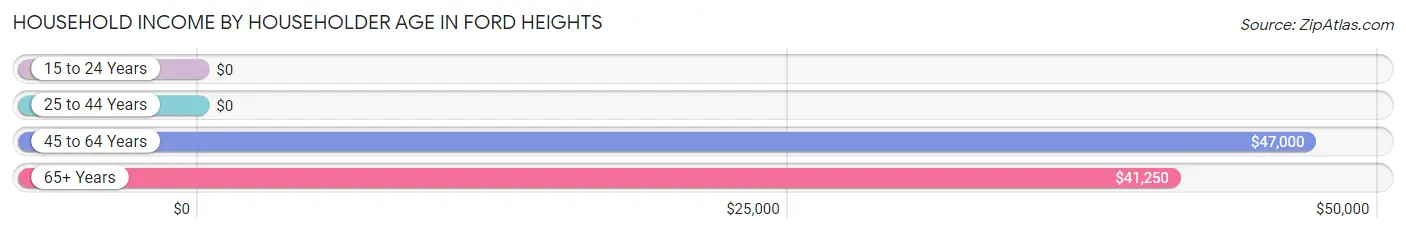
| Income Bracket | # Households | Median Income |
| 15 to 24 Years | 0 (0.0%) | $0 |
| 25 to 44 Years | 117 (20.6%) | $0 |
| 45 to 64 Years | 262 (46.1%) | $47,000 |
| 65+ Years | 190 (33.4%) | $41,250 |
| Total | 569 (100.0%) | $43,086 |
Poverty in Ford Heights
Income Below Poverty by Sex and Age in Ford Heights
With 35.2% poverty level for males and 38.5% for females among the residents of Ford Heights, 15 year old males and 12 to 14 year old females are the most vulnerable to poverty, with 22 males (100.0%) and 22 females (100.0%) in their respective age groups living below the poverty level.
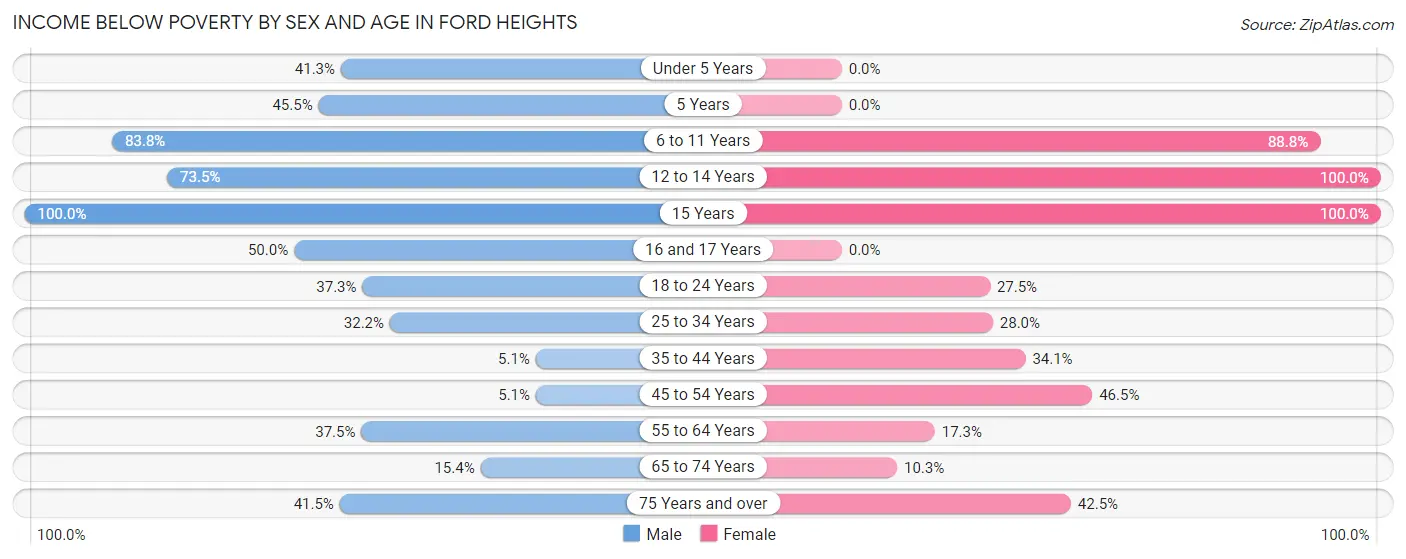
| Age Bracket | Male | Female |
| Under 5 Years | 19 (41.3%) | 0 (0.0%) |
| 5 Years | 10 (45.5%) | 0 (0.0%) |
| 6 to 11 Years | 62 (83.8%) | 71 (88.7%) |
| 12 to 14 Years | 25 (73.5%) | 22 (100.0%) |
| 15 Years | 22 (100.0%) | 22 (100.0%) |
| 16 and 17 Years | 11 (50.0%) | 0 (0.0%) |
| 18 to 24 Years | 25 (37.3%) | 11 (27.5%) |
| 25 to 34 Years | 38 (32.2%) | 53 (28.0%) |
| 35 to 44 Years | 6 (5.1%) | 15 (34.1%) |
| 45 to 54 Years | 5 (5.1%) | 53 (46.5%) |
| 55 to 64 Years | 30 (37.5%) | 19 (17.3%) |
| 65 to 74 Years | 8 (15.4%) | 8 (10.3%) |
| 75 Years and over | 22 (41.5%) | 37 (42.5%) |
| Total | 283 (35.2%) | 311 (38.5%) |
Income Above Poverty by Sex and Age in Ford Heights
According to the poverty statistics in Ford Heights, males aged 45 to 54 years and females aged under 5 years are the age groups that are most secure financially, with 94.9% of males and 100.0% of females in these age groups living above the poverty line.
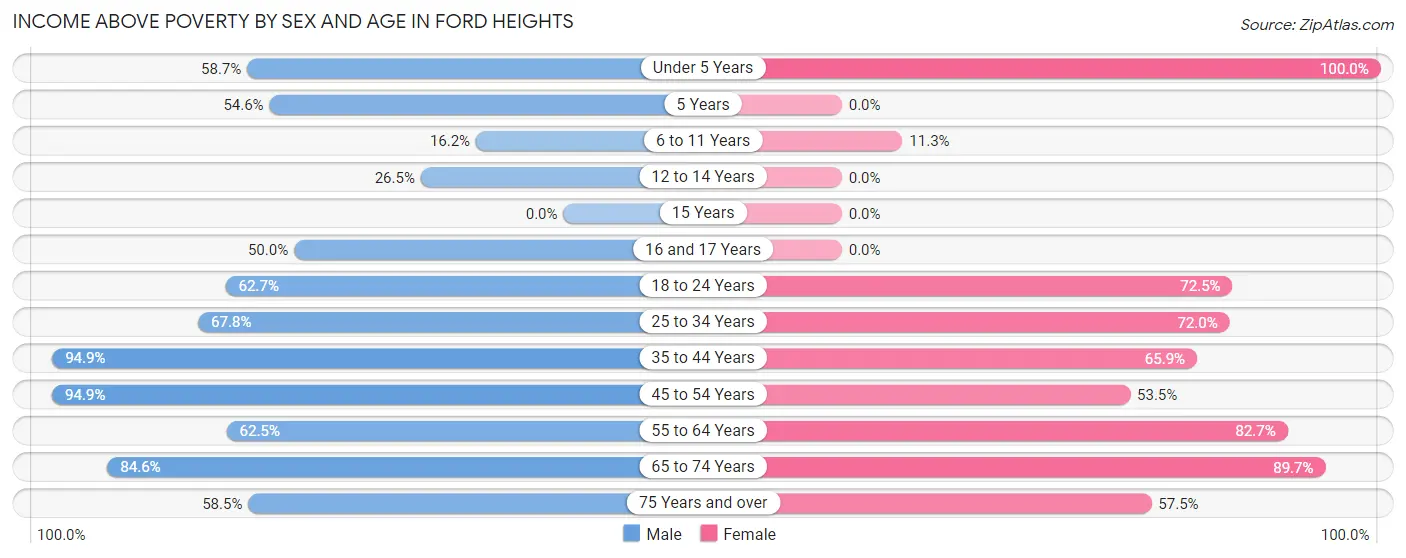
| Age Bracket | Male | Female |
| Under 5 Years | 27 (58.7%) | 22 (100.0%) |
| 5 Years | 12 (54.5%) | 0 (0.0%) |
| 6 to 11 Years | 12 (16.2%) | 9 (11.3%) |
| 12 to 14 Years | 9 (26.5%) | 0 (0.0%) |
| 15 Years | 0 (0.0%) | 0 (0.0%) |
| 16 and 17 Years | 11 (50.0%) | 0 (0.0%) |
| 18 to 24 Years | 42 (62.7%) | 29 (72.5%) |
| 25 to 34 Years | 80 (67.8%) | 136 (72.0%) |
| 35 to 44 Years | 111 (94.9%) | 29 (65.9%) |
| 45 to 54 Years | 93 (94.9%) | 61 (53.5%) |
| 55 to 64 Years | 50 (62.5%) | 91 (82.7%) |
| 65 to 74 Years | 44 (84.6%) | 70 (89.7%) |
| 75 Years and over | 31 (58.5%) | 50 (57.5%) |
| Total | 522 (64.8%) | 497 (61.5%) |
Income Below Poverty Among Married-Couple Families in Ford Heights
The poverty statistics for married-couple families in Ford Heights show that 7.5% or 4 of the total 53 families live below the poverty line. Families with no children have the highest poverty rate of 8.2%, comprising of 4 families. On the other hand, families with 1 or 2 children have the lowest poverty rate of 0.0%, which includes 0 families.
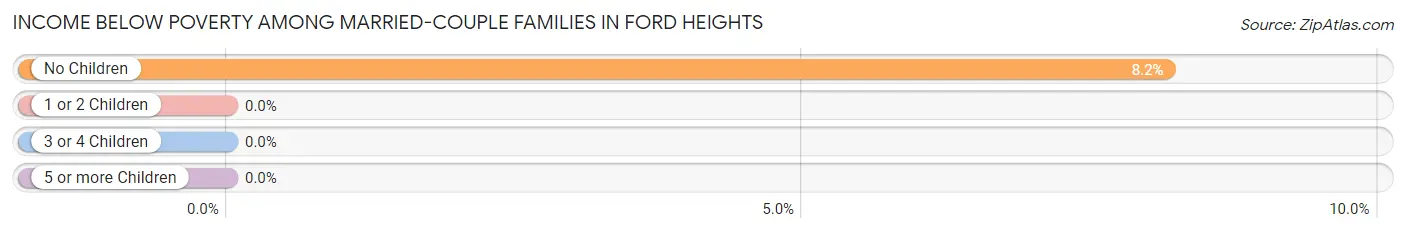
| Children | Above Poverty | Below Poverty |
| No Children | 45 (91.8%) | 4 (8.2%) |
| 1 or 2 Children | 4 (100.0%) | 0 (0.0%) |
| 3 or 4 Children | 0 (0.0%) | 0 (0.0%) |
| 5 or more Children | 0 (0.0%) | 0 (0.0%) |
| Total | 49 (92.4%) | 4 (7.5%) |
Income Below Poverty Among Single-Parent Households in Ford Heights
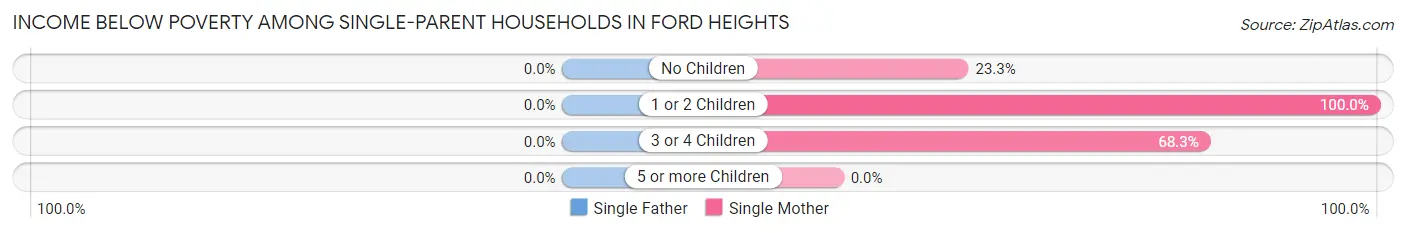
| Children | Single Father | Single Mother |
| No Children | 0 (0.0%) | 30 (23.3%) |
| 1 or 2 Children | 0 (0.0%) | 52 (100.0%) |
| 3 or 4 Children | 0 (0.0%) | 41 (68.3%) |
| 5 or more Children | 0 (0.0%) | 0 (0.0%) |
| Total | 0 (0.0%) | 123 (51.0%) |
Income Below Poverty Among Married-Couple vs Single-Parent Households in Ford Heights
The poverty data for Ford Heights shows that 4 of the married-couple family households (7.5%) and 123 of the single-parent households (42.4%) are living below the poverty level. Within the married-couple family households, those with no children have the highest poverty rate, with 4 households (8.2%) falling below the poverty line. Among the single-parent households, those with 1 or 2 children have the highest poverty rate, with 52 household (76.5%) living below poverty.
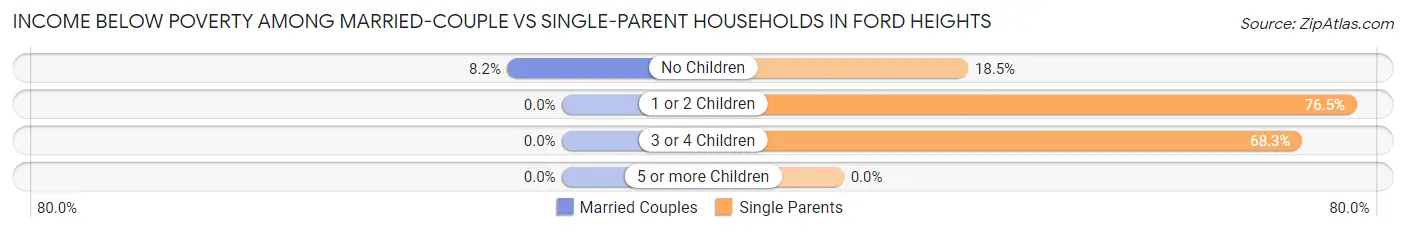
| Children | Married-Couple Families | Single-Parent Households |
| No Children | 4 (8.2%) | 30 (18.5%) |
| 1 or 2 Children | 0 (0.0%) | 52 (76.5%) |
| 3 or 4 Children | 0 (0.0%) | 41 (68.3%) |
| 5 or more Children | 0 (0.0%) | 0 (0.0%) |
| Total | 4 (7.5%) | 123 (42.4%) |
Race in Ford Heights
The most populous races in Ford Heights are Black / African American (1,505 | 93.0%), Two or more Races (77 | 4.8%), and Hispanic or Latino (44 | 2.7%).
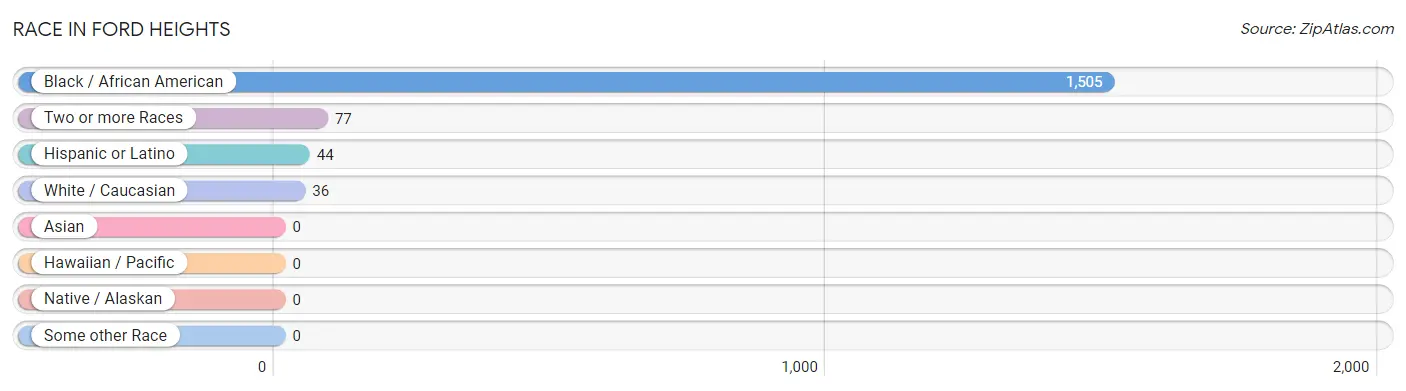
| Race | # Population | % Population |
| Asian | 0 | 0.0% |
| Black / African American | 1,505 | 93.0% |
| Hawaiian / Pacific | 0 | 0.0% |
| Hispanic or Latino | 44 | 2.7% |
| Native / Alaskan | 0 | 0.0% |
| White / Caucasian | 36 | 2.2% |
| Two or more Races | 77 | 4.8% |
| Some other Race | 0 | 0.0% |
| Total | 1,618 | 100.0% |
Ancestry in Ford Heights
The most populous ancestries reported in Ford Heights are Mexican (44 | 2.7%), American (20 | 1.2%), English (7 | 0.4%), Irish (7 | 0.4%), and Bhutanese (5 | 0.3%), together accounting for 5.1% of all Ford Heights residents.
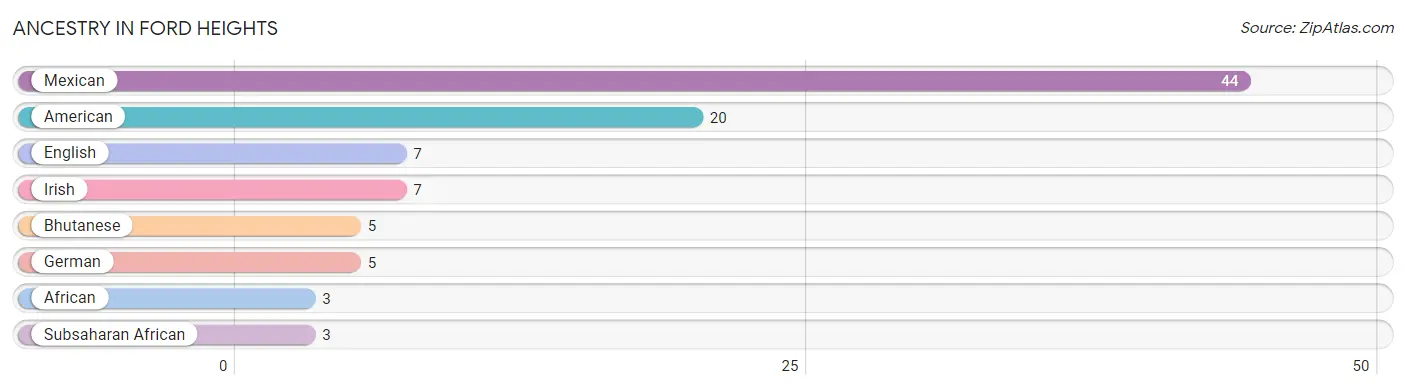
| Ancestry | # Population | % Population |
| African | 3 | 0.2% |
| American | 20 | 1.2% |
| Bhutanese | 5 | 0.3% |
| English | 7 | 0.4% |
| German | 5 | 0.3% |
| Irish | 7 | 0.4% |
| Mexican | 44 | 2.7% |
| Subsaharan African | 3 | 0.2% | View All 8 Rows |
Immigrants in Ford Heights

| Immigration Origin | # Population | % Population | View All 0 Rows |
Sex and Age in Ford Heights
Sex and Age in Ford Heights
The most populous age groups in Ford Heights are 25 to 29 Years (105 | 13.0%) for men and 25 to 29 Years (150 | 18.4%) for women.
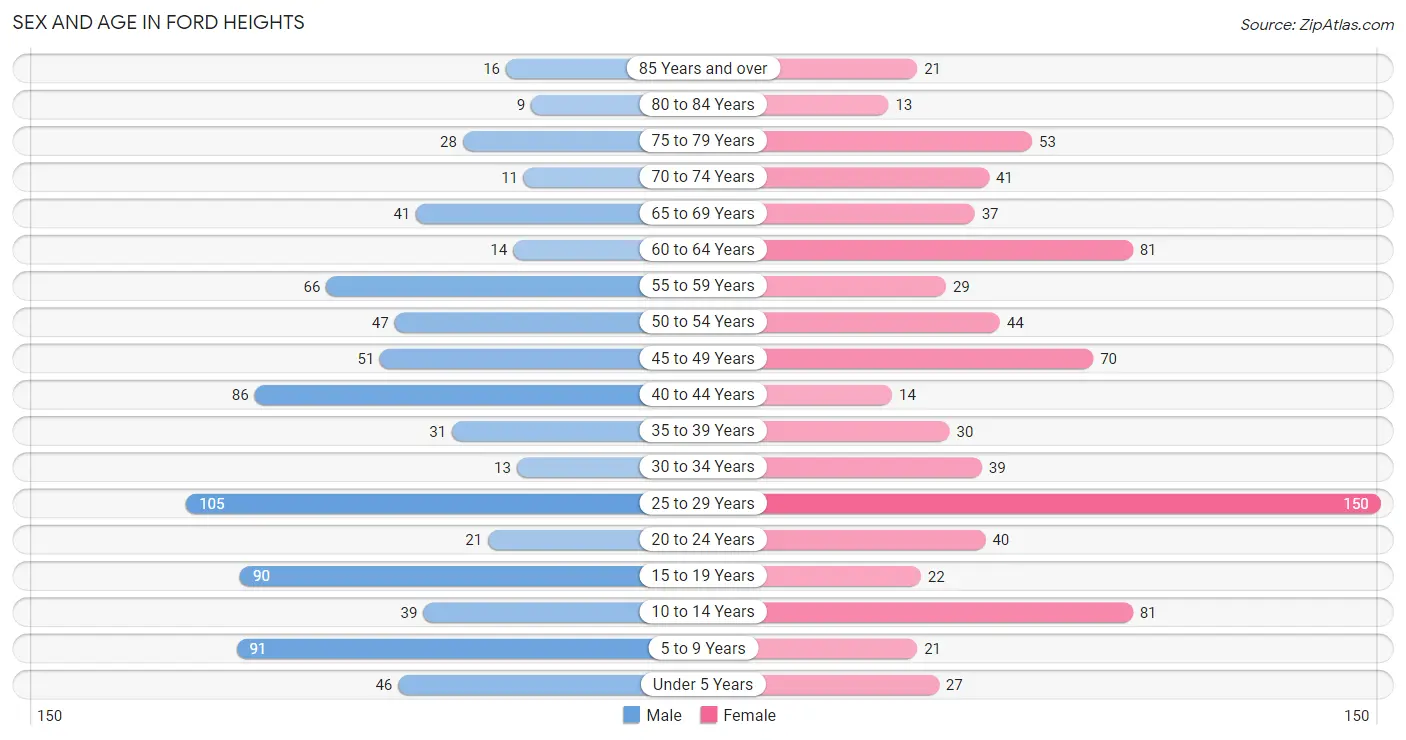
| Age Bracket | Male | Female |
| Under 5 Years | 46 (5.7%) | 27 (3.3%) |
| 5 to 9 Years | 91 (11.3%) | 21 (2.6%) |
| 10 to 14 Years | 39 (4.8%) | 81 (10.0%) |
| 15 to 19 Years | 90 (11.2%) | 22 (2.7%) |
| 20 to 24 Years | 21 (2.6%) | 40 (4.9%) |
| 25 to 29 Years | 105 (13.0%) | 150 (18.4%) |
| 30 to 34 Years | 13 (1.6%) | 39 (4.8%) |
| 35 to 39 Years | 31 (3.8%) | 30 (3.7%) |
| 40 to 44 Years | 86 (10.7%) | 14 (1.7%) |
| 45 to 49 Years | 51 (6.3%) | 70 (8.6%) |
| 50 to 54 Years | 47 (5.8%) | 44 (5.4%) |
| 55 to 59 Years | 66 (8.2%) | 29 (3.6%) |
| 60 to 64 Years | 14 (1.7%) | 81 (10.0%) |
| 65 to 69 Years | 41 (5.1%) | 37 (4.5%) |
| 70 to 74 Years | 11 (1.4%) | 41 (5.0%) |
| 75 to 79 Years | 28 (3.5%) | 53 (6.5%) |
| 80 to 84 Years | 9 (1.1%) | 13 (1.6%) |
| 85 Years and over | 16 (2.0%) | 21 (2.6%) |
| Total | 805 (100.0%) | 813 (100.0%) |
Families and Households in Ford Heights
Median Family Size in Ford Heights
The median family size in Ford Heights is 3.95 persons per family, with single female/mother families (241 | 70.3%) accounting for the largest median family size of 4.45 persons per family. On the other hand, single male/father families (49 | 14.3%) represent the smallest median family size with 2.51 persons per family.
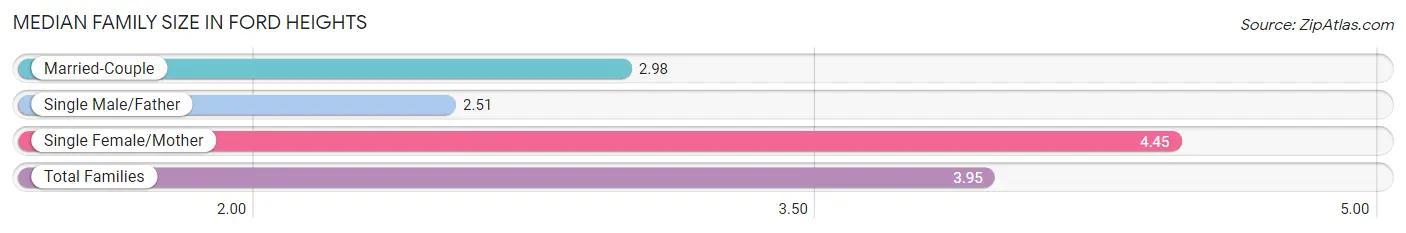
| Family Type | # Families | Family Size |
| Married-Couple | 53 (15.4%) | 2.98 |
| Single Male/Father | 49 (14.3%) | 2.51 |
| Single Female/Mother | 241 (70.3%) | 4.45 |
| Total Families | 343 (100.0%) | 3.95 |
Median Household Size in Ford Heights
The median household size in Ford Heights is 2.84 persons per household, with single female/mother households (241 | 42.4%) accounting for the largest median household size of 4.45 persons per household. non-family households (226 | 39.7%) represent the smallest median household size with 1.07 persons per household.
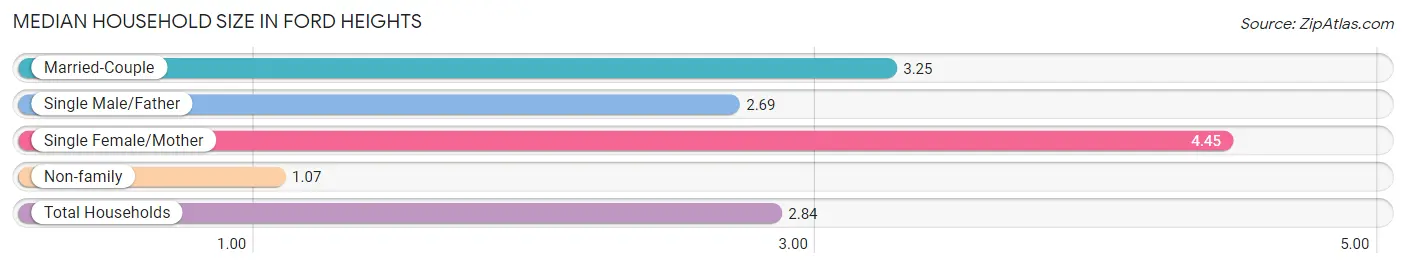
| Household Type | # Households | Household Size |
| Married-Couple | 53 (9.3%) | 3.25 |
| Single Male/Father | 49 (8.6%) | 2.69 |
| Single Female/Mother | 241 (42.4%) | 4.45 |
| Non-family | 226 (39.7%) | 1.07 |
| Total Households | 569 (100.0%) | 2.84 |
Household Size by Marriage Status in Ford Heights
Out of a total of 569 households in Ford Heights, 343 (60.3%) are family households, while 226 (39.7%) are nonfamily households. The most numerous type of family households are 2-person households, comprising 117, and the most common type of nonfamily households are 1-person households, comprising 213.
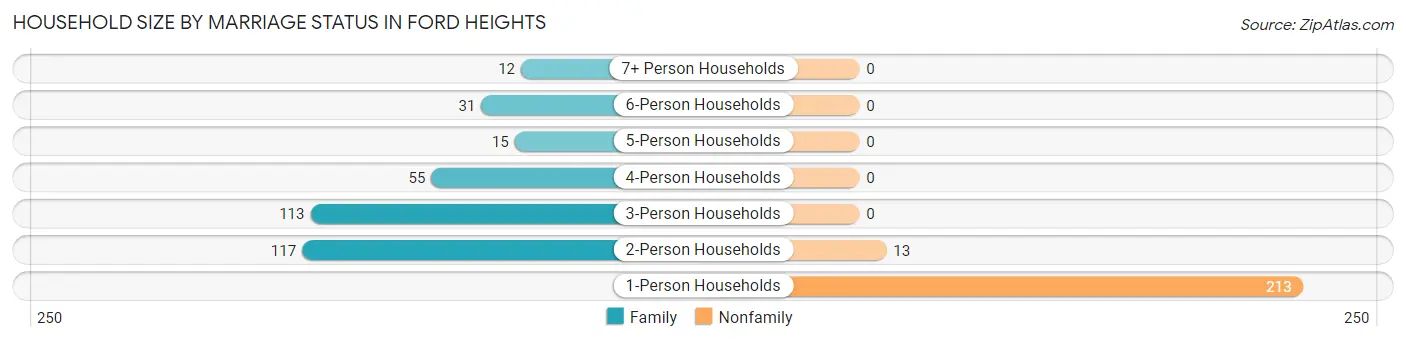
| Household Size | Family Households | Nonfamily Households |
| 1-Person Households | - | 213 (37.4%) |
| 2-Person Households | 117 (20.6%) | 13 (2.3%) |
| 3-Person Households | 113 (19.9%) | 0 (0.0%) |
| 4-Person Households | 55 (9.7%) | 0 (0.0%) |
| 5-Person Households | 15 (2.6%) | 0 (0.0%) |
| 6-Person Households | 31 (5.4%) | 0 (0.0%) |
| 7+ Person Households | 12 (2.1%) | 0 (0.0%) |
| Total | 343 (60.3%) | 226 (39.7%) |
Female Fertility in Ford Heights
Fertility by Age in Ford Heights
Average fertility rate in Ford Heights is 81.0 births per 1,000 women. Women in the age bracket of 20 to 34 years have the highest fertility rate with 131.0 births per 1,000 women. Women in the age bracket of 20 to 34 years acount for 100.0% of all women with births.
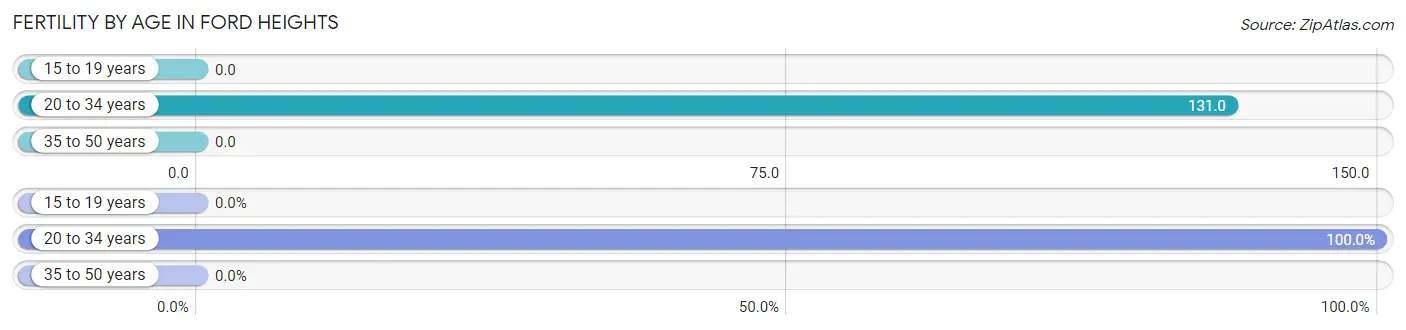
| Age Bracket | Women with Births | Births / 1,000 Women |
| 15 to 19 years | 0 (0.0%) | 0.0 |
| 20 to 34 years | 30 (100.0%) | 131.0 |
| 35 to 50 years | 0 (0.0%) | 0.0 |
| Total | 30 (100.0%) | 81.0 |
Fertility by Age by Marriage Status in Ford Heights
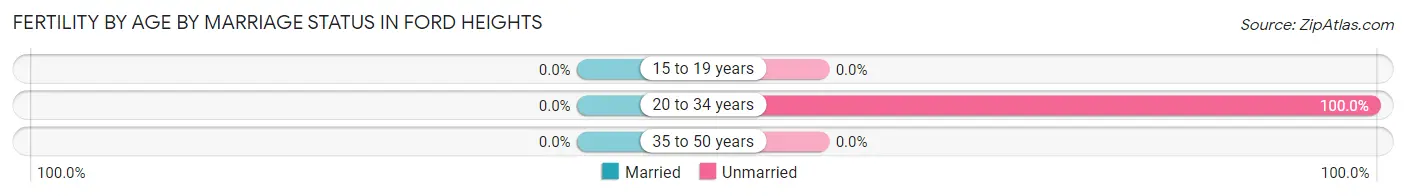
| Age Bracket | Married | Unmarried |
| 15 to 19 years | 0 (0.0%) | 0 (0.0%) |
| 20 to 34 years | 0 (0.0%) | 30 (100.0%) |
| 35 to 50 years | 0 (0.0%) | 0 (0.0%) |
| Total | 0 (0.0%) | 30 (100.0%) |
Fertility by Education in Ford Heights
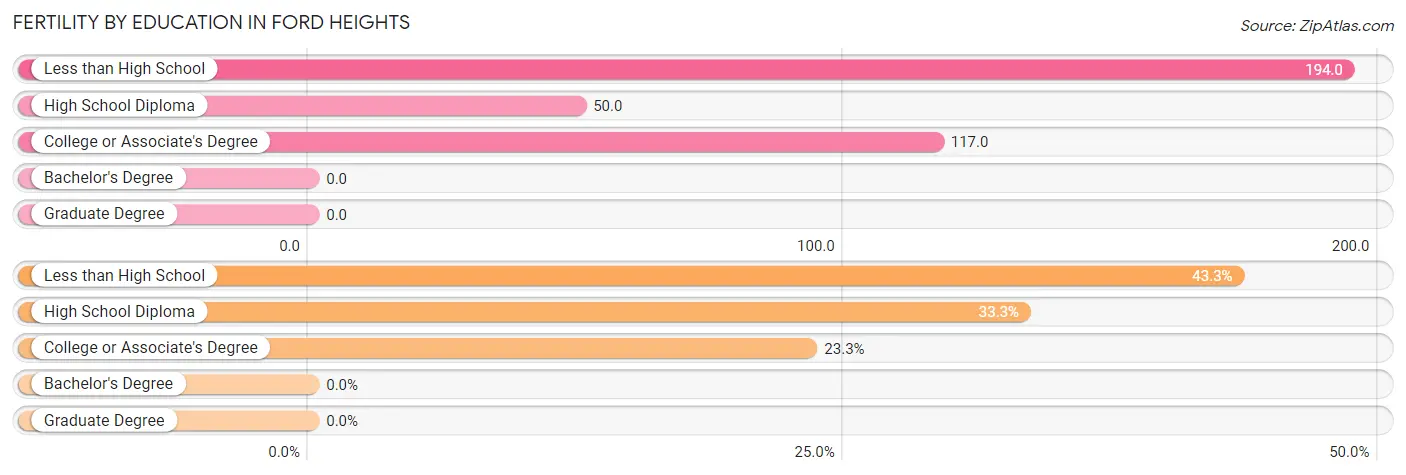
| Educational Attainment | Women with Births | Births / 1,000 Women |
| Less than High School | 13 (43.3%) | 194.0 |
| High School Diploma | 10 (33.3%) | 50.0 |
| College or Associate's Degree | 7 (23.3%) | 117.0 |
| Bachelor's Degree | 0 (0.0%) | 0.0 |
| Graduate Degree | 0 (0.0%) | 0.0 |
| Total | 30 (100.0%) | 81.0 |
Fertility by Education by Marriage Status in Ford Heights
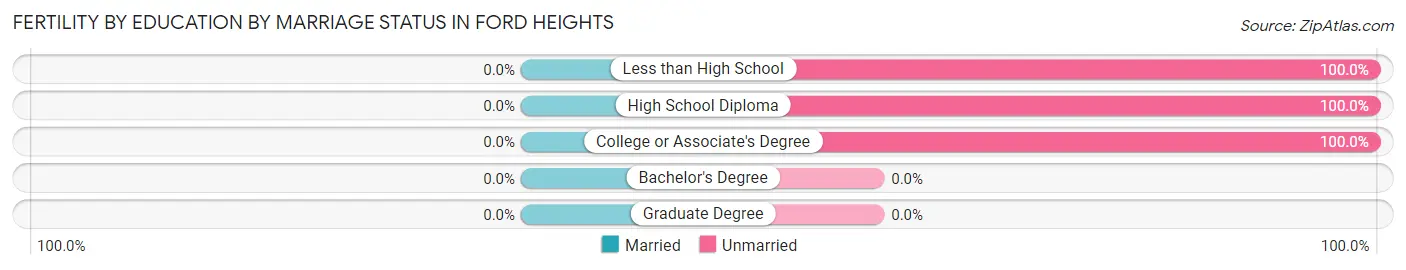
| Educational Attainment | Married | Unmarried |
| Less than High School | 0 (0.0%) | 13 (100.0%) |
| High School Diploma | 0 (0.0%) | 10 (100.0%) |
| College or Associate's Degree | 0 (0.0%) | 7 (100.0%) |
| Bachelor's Degree | 0 (0.0%) | 0 (0.0%) |
| Graduate Degree | 0 (0.0%) | 0 (0.0%) |
| Total | 0 (0.0%) | 30 (100.0%) |
Employment Characteristics in Ford Heights
Employment by Class of Employer in Ford Heights
Among the 497 employed individuals in Ford Heights, private company employees (222 | 44.7%), not-for-profit organizations (165 | 33.2%), and self-employed (not incorporated) (67 | 13.5%) make up the most common classes of employment.
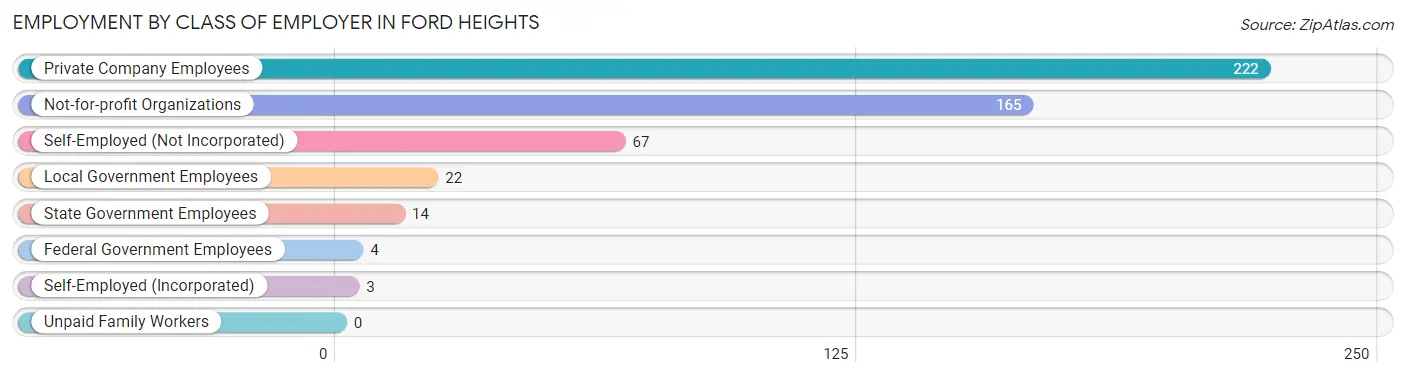
| Employer Class | # Employees | % Employees |
| Private Company Employees | 222 | 44.7% |
| Self-Employed (Incorporated) | 3 | 0.6% |
| Self-Employed (Not Incorporated) | 67 | 13.5% |
| Not-for-profit Organizations | 165 | 33.2% |
| Local Government Employees | 22 | 4.4% |
| State Government Employees | 14 | 2.8% |
| Federal Government Employees | 4 | 0.8% |
| Unpaid Family Workers | 0 | 0.0% |
| Total | 497 | 100.0% |
Employment Status by Age in Ford Heights
According to the labor force statistics for Ford Heights, out of the total population over 16 years of age (1,269), 47.2% or 599 individuals are in the labor force, with 11.2% or 67 of them unemployed. The age group with the highest labor force participation rate is 45 to 54 years, with 71.7% or 152 individuals in the labor force. Within the labor force, the 16 to 19 years age range has the highest percentage of unemployed individuals, with 100.0% or 21 of them being unemployed.
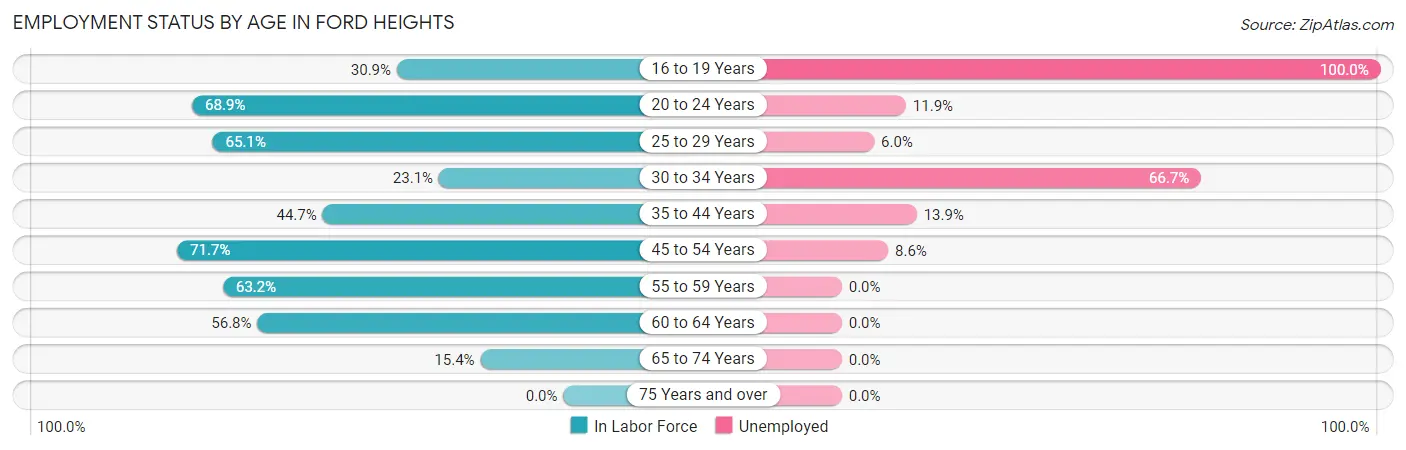
| Age Bracket | In Labor Force | Unemployed |
| 16 to 19 Years | 21 (30.9%) | 21 (100.0%) |
| 20 to 24 Years | 42 (68.9%) | 5 (11.9%) |
| 25 to 29 Years | 166 (65.1%) | 10 (6.0%) |
| 30 to 34 Years | 12 (23.1%) | 8 (66.7%) |
| 35 to 44 Years | 72 (44.7%) | 10 (13.9%) |
| 45 to 54 Years | 152 (71.7%) | 13 (8.6%) |
| 55 to 59 Years | 60 (63.2%) | 0 (0.0%) |
| 60 to 64 Years | 54 (56.8%) | 0 (0.0%) |
| 65 to 74 Years | 20 (15.4%) | 0 (0.0%) |
| 75 Years and over | 0 (0.0%) | 0 (0.0%) |
| Total | 599 (47.2%) | 67 (11.2%) |
Employment Status by Educational Attainment in Ford Heights
According to labor force statistics for Ford Heights, 59.3% of individuals (516) out of the total population between 25 and 64 years of age (870) are in the labor force, with 7.9% or 41 of them being unemployed. The group with the highest labor force participation rate are those with the educational attainment of bachelor's degree or higher, with 100.0% or 129 individuals in the labor force. Within the labor force, individuals with less than high school education have the highest percentage of unemployment, with 20.0% or 5 of them being unemployed.
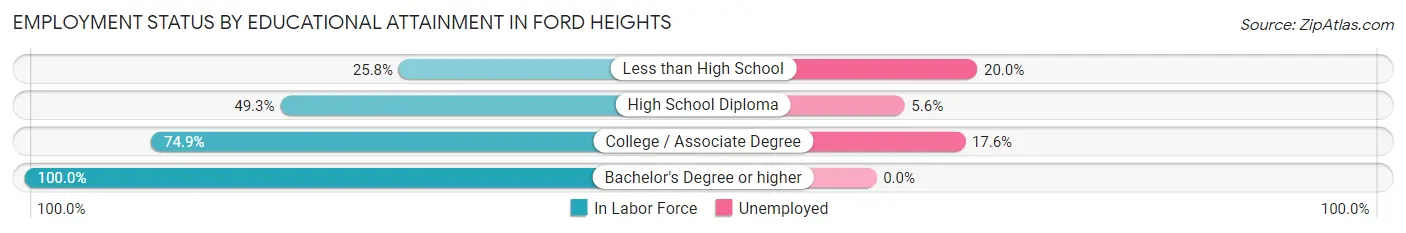
| Educational Attainment | In Labor Force | Unemployed |
| Less than High School | 25 (25.8%) | 19 (20.0%) |
| High School Diploma | 231 (49.3%) | 26 (5.6%) |
| College / Associate Degree | 131 (74.9%) | 31 (17.6%) |
| Bachelor's Degree or higher | 129 (100.0%) | 0 (0.0%) |
| Total | 516 (59.3%) | 69 (7.9%) |
Employment Occupations by Sex in Ford Heights
Management, Business, Science and Arts Occupations
The most common Management, Business, Science and Arts occupations in Ford Heights are Community & Social Service (65 | 12.2%), Education, Arts & Media (38 | 7.1%), Management (34 | 6.4%), Health Diagnosing & Treating (30 | 5.6%), and Education Instruction & Library (27 | 5.1%).
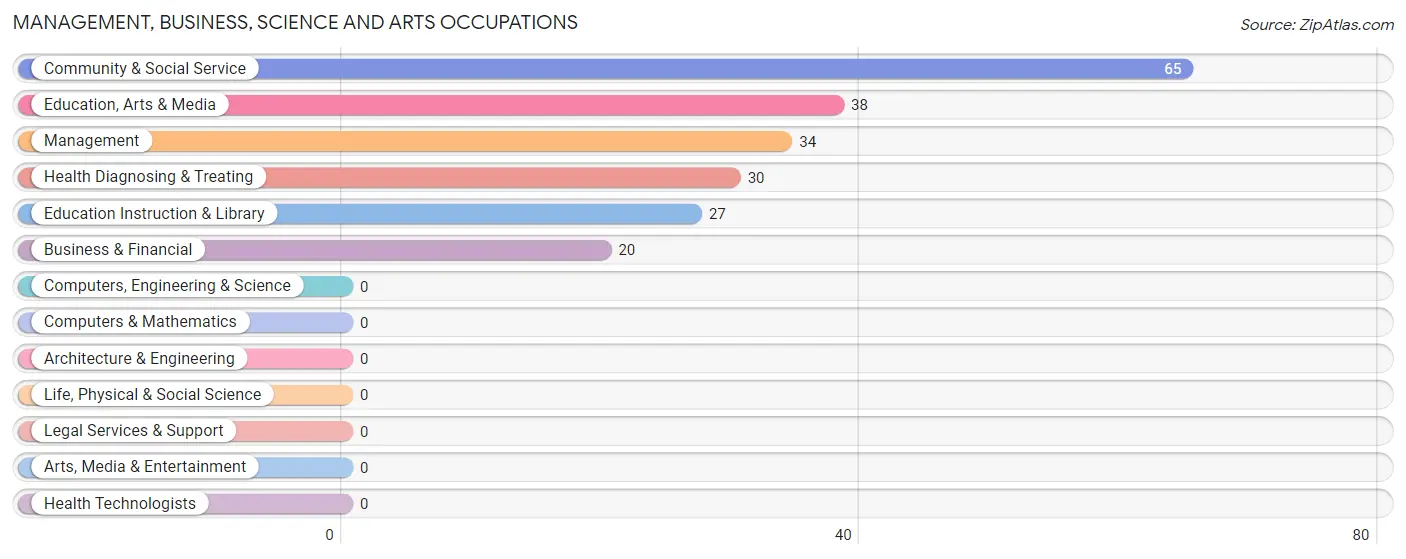
Management, Business, Science and Arts Occupations by Sex
Within the Management, Business, Science and Arts occupations in Ford Heights, the most male-oriented occupations are Management (88.2%), Health Diagnosing & Treating (86.7%), and Business & Financial (55.0%), while the most female-oriented occupations are Community & Social Service (100.0%), Education, Arts & Media (100.0%), and Education Instruction & Library (100.0%).
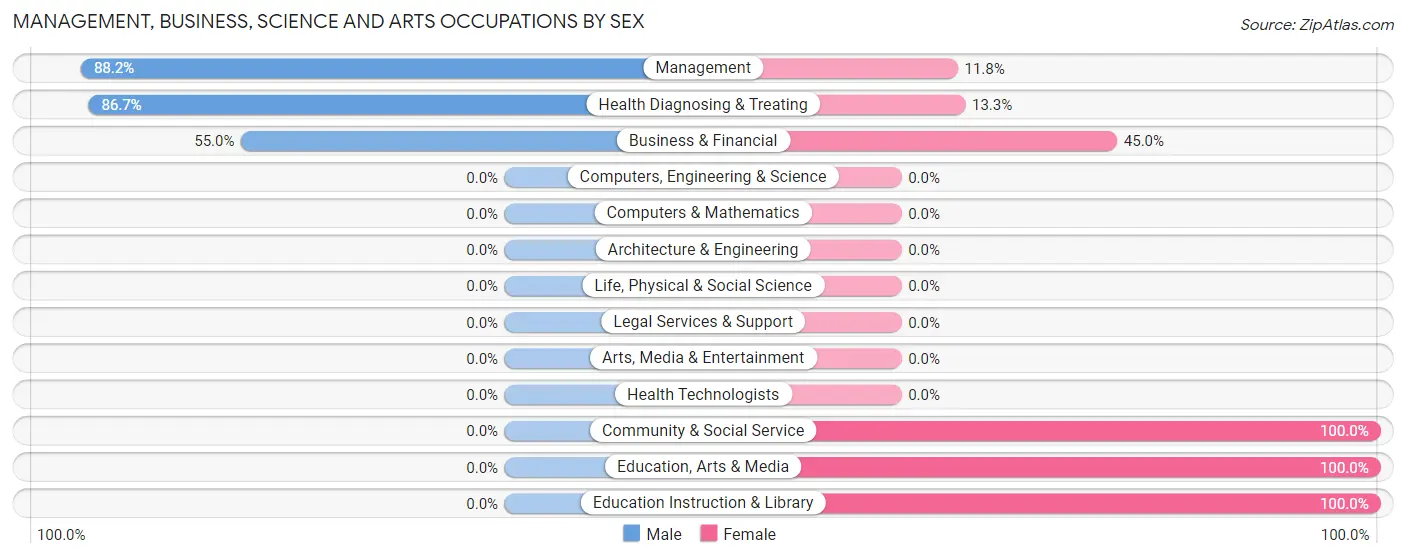
| Occupation | Male | Female |
| Management | 30 (88.2%) | 4 (11.8%) |
| Business & Financial | 11 (55.0%) | 9 (45.0%) |
| Computers, Engineering & Science | 0 (0.0%) | 0 (0.0%) |
| Computers & Mathematics | 0 (0.0%) | 0 (0.0%) |
| Architecture & Engineering | 0 (0.0%) | 0 (0.0%) |
| Life, Physical & Social Science | 0 (0.0%) | 0 (0.0%) |
| Community & Social Service | 0 (0.0%) | 65 (100.0%) |
| Education, Arts & Media | 0 (0.0%) | 38 (100.0%) |
| Legal Services & Support | 0 (0.0%) | 0 (0.0%) |
| Education Instruction & Library | 0 (0.0%) | 27 (100.0%) |
| Arts, Media & Entertainment | 0 (0.0%) | 0 (0.0%) |
| Health Diagnosing & Treating | 26 (86.7%) | 4 (13.3%) |
| Health Technologists | 0 (0.0%) | 0 (0.0%) |
| Total (Category) | 67 (45.0%) | 82 (55.0%) |
| Total (Overall) | 285 (53.6%) | 247 (46.4%) |
Services Occupations
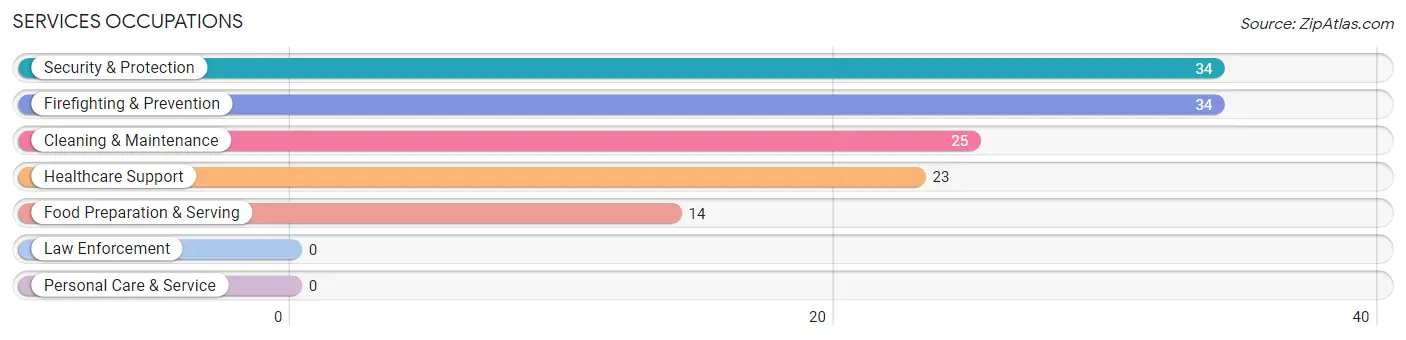
The most common Services occupations in Ford Heights are Security & Protection (34 | 6.4%), Firefighting & Prevention (34 | 6.4%), Cleaning & Maintenance (25 | 4.7%), Healthcare Support (23 | 4.3%), and Food Preparation & Serving (14 | 2.6%).
Services Occupations by Sex
Within the Services occupations in Ford Heights, the most male-oriented occupations are Security & Protection (100.0%), Firefighting & Prevention (100.0%), and Cleaning & Maintenance (60.0%), while the most female-oriented occupations are Healthcare Support (100.0%), Food Preparation & Serving (100.0%), and Cleaning & Maintenance (40.0%).
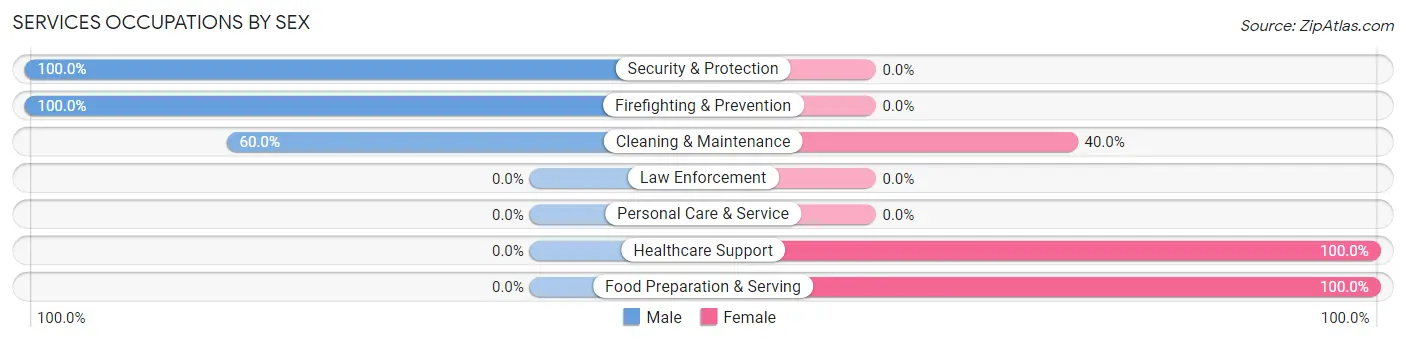
| Occupation | Male | Female |
| Healthcare Support | 0 (0.0%) | 23 (100.0%) |
| Security & Protection | 34 (100.0%) | 0 (0.0%) |
| Firefighting & Prevention | 34 (100.0%) | 0 (0.0%) |
| Law Enforcement | 0 (0.0%) | 0 (0.0%) |
| Food Preparation & Serving | 0 (0.0%) | 14 (100.0%) |
| Cleaning & Maintenance | 15 (60.0%) | 10 (40.0%) |
| Personal Care & Service | 0 (0.0%) | 0 (0.0%) |
| Total (Category) | 49 (51.0%) | 47 (49.0%) |
| Total (Overall) | 285 (53.6%) | 247 (46.4%) |
Sales and Office Occupations
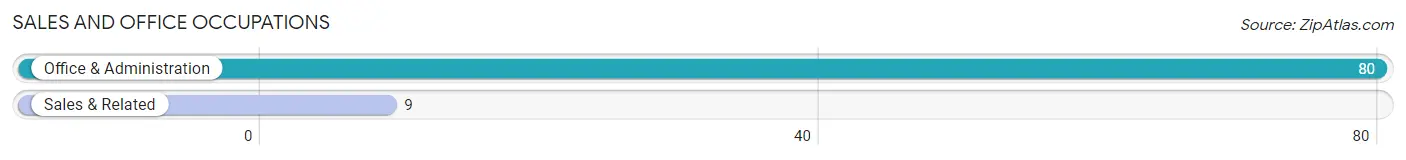
The most common Sales and Office occupations in Ford Heights are Office & Administration (80 | 15.0%), and Sales & Related (9 | 1.7%).
Sales and Office Occupations by Sex
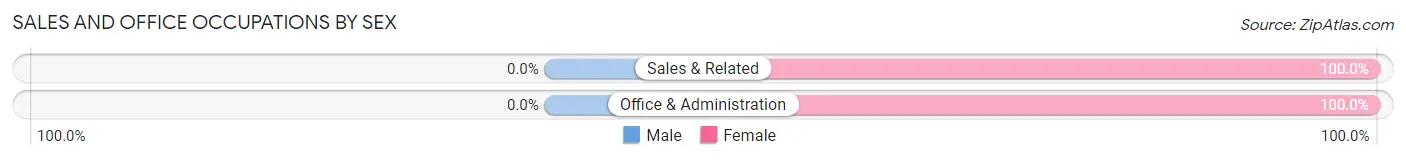
| Occupation | Male | Female |
| Sales & Related | 0 (0.0%) | 9 (100.0%) |
| Office & Administration | 0 (0.0%) | 80 (100.0%) |
| Total (Category) | 0 (0.0%) | 89 (100.0%) |
| Total (Overall) | 285 (53.6%) | 247 (46.4%) |
Natural Resources, Construction and Maintenance Occupations
The most common Natural Resources, Construction and Maintenance occupations in Ford Heights are , and Construction & Extraction (13 | 2.4%).
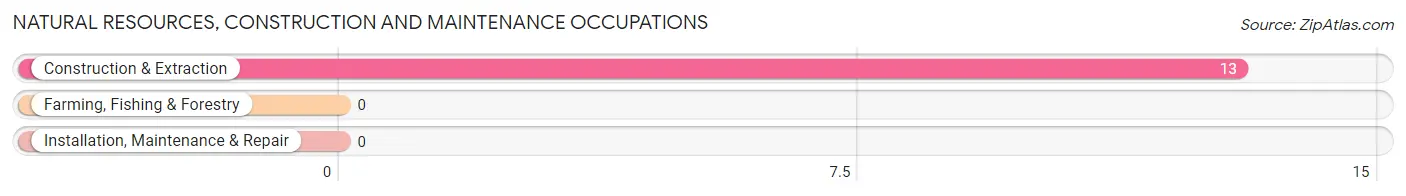
Natural Resources, Construction and Maintenance Occupations by Sex
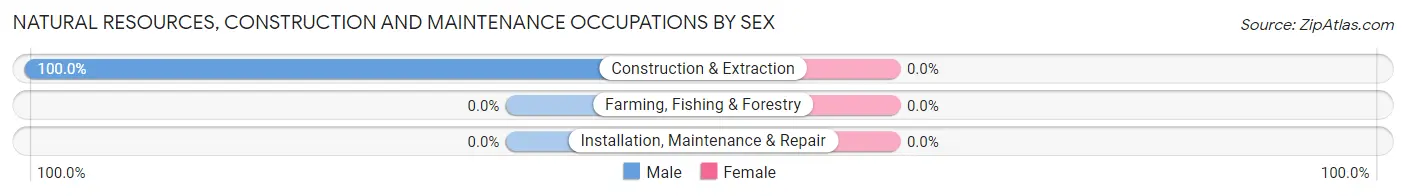
| Occupation | Male | Female |
| Farming, Fishing & Forestry | 0 (0.0%) | 0 (0.0%) |
| Construction & Extraction | 13 (100.0%) | 0 (0.0%) |
| Installation, Maintenance & Repair | 0 (0.0%) | 0 (0.0%) |
| Total (Category) | 13 (100.0%) | 0 (0.0%) |
| Total (Overall) | 285 (53.6%) | 247 (46.4%) |
Production, Transportation and Moving Occupations
The most common Production, Transportation and Moving occupations in Ford Heights are Material Moving (91 | 17.1%), Transportation (73 | 13.7%), and Production (21 | 4.0%).
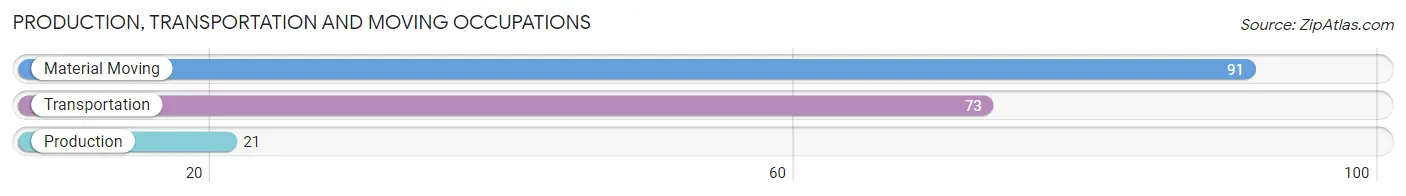
Production, Transportation and Moving Occupations by Sex
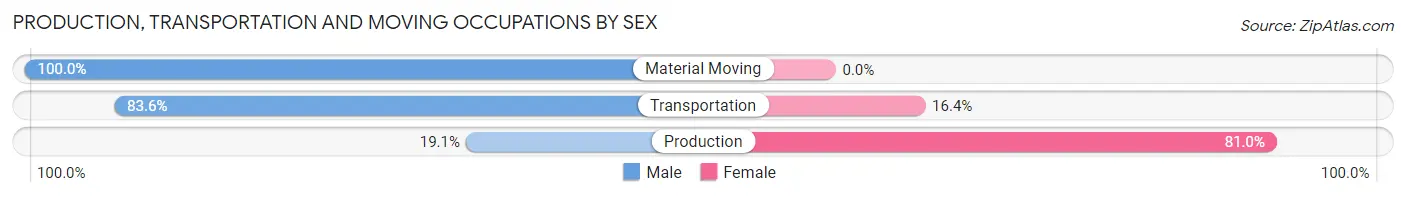
| Occupation | Male | Female |
| Production | 4 (19.1%) | 17 (80.9%) |
| Transportation | 61 (83.6%) | 12 (16.4%) |
| Material Moving | 91 (100.0%) | 0 (0.0%) |
| Total (Category) | 156 (84.3%) | 29 (15.7%) |
| Total (Overall) | 285 (53.6%) | 247 (46.4%) |
Employment Industries by Sex in Ford Heights
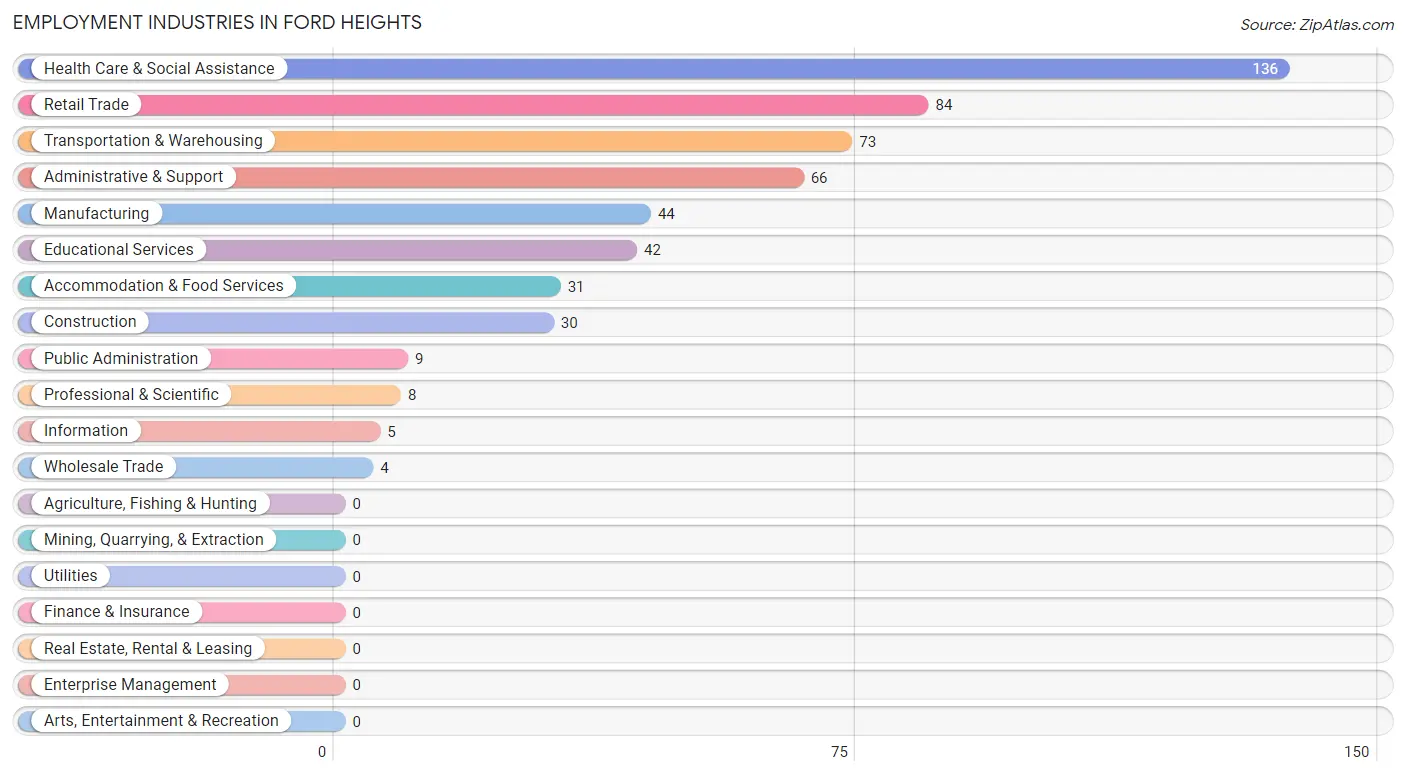
Employment Industries in Ford Heights
The major employment industries in Ford Heights include Health Care & Social Assistance (136 | 25.6%), Retail Trade (84 | 15.8%), Transportation & Warehousing (73 | 13.7%), Administrative & Support (66 | 12.4%), and Manufacturing (44 | 8.3%).
Employment Industries by Sex in Ford Heights
The Ford Heights industries that see more men than women are Wholesale Trade (100.0%), Professional & Scientific (100.0%), and Administrative & Support (100.0%), whereas the industries that tend to have a higher number of women are Information (100.0%), Public Administration (100.0%), and Educational Services (78.6%).
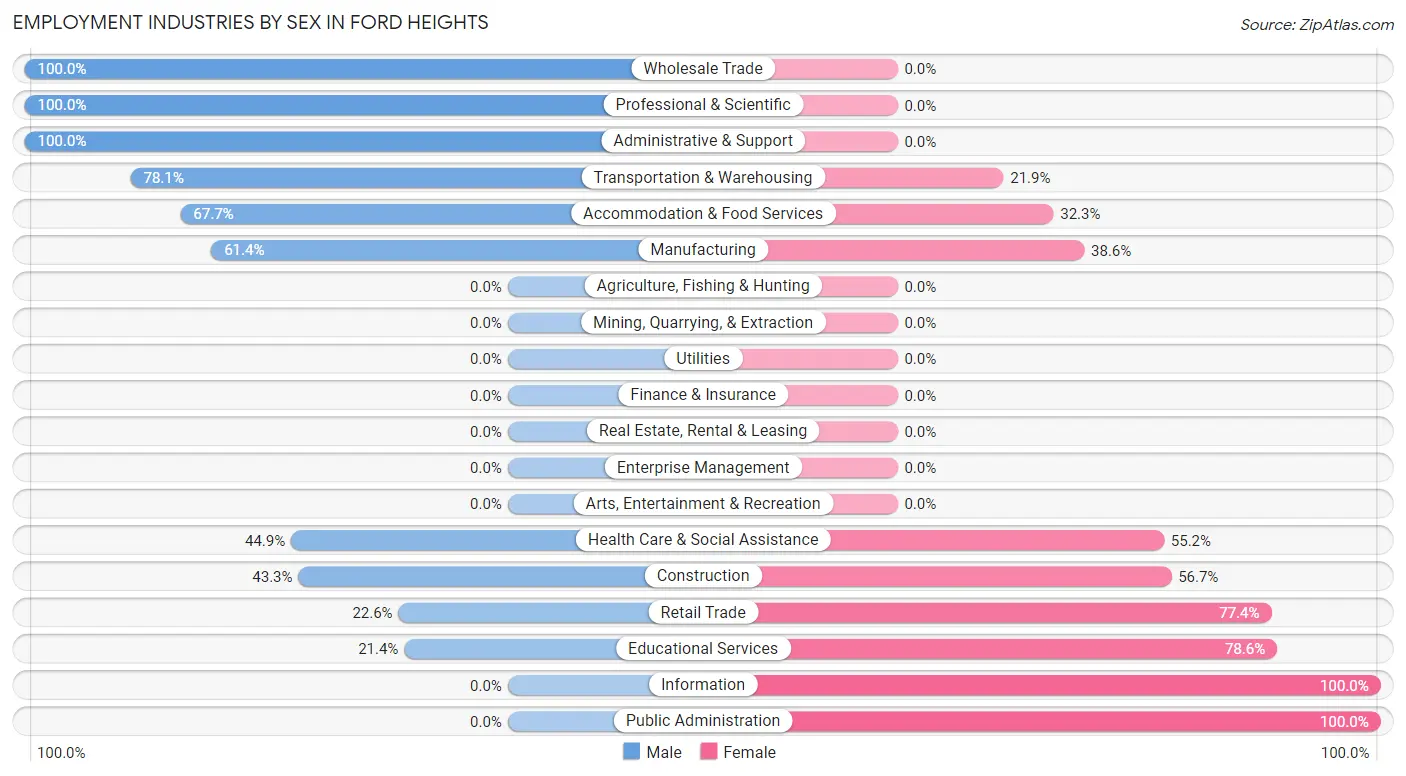
| Industry | Male | Female |
| Agriculture, Fishing & Hunting | 0 (0.0%) | 0 (0.0%) |
| Mining, Quarrying, & Extraction | 0 (0.0%) | 0 (0.0%) |
| Construction | 13 (43.3%) | 17 (56.7%) |
| Manufacturing | 27 (61.4%) | 17 (38.6%) |
| Wholesale Trade | 4 (100.0%) | 0 (0.0%) |
| Retail Trade | 19 (22.6%) | 65 (77.4%) |
| Transportation & Warehousing | 57 (78.1%) | 16 (21.9%) |
| Utilities | 0 (0.0%) | 0 (0.0%) |
| Information | 0 (0.0%) | 5 (100.0%) |
| Finance & Insurance | 0 (0.0%) | 0 (0.0%) |
| Real Estate, Rental & Leasing | 0 (0.0%) | 0 (0.0%) |
| Professional & Scientific | 8 (100.0%) | 0 (0.0%) |
| Enterprise Management | 0 (0.0%) | 0 (0.0%) |
| Administrative & Support | 66 (100.0%) | 0 (0.0%) |
| Educational Services | 9 (21.4%) | 33 (78.6%) |
| Health Care & Social Assistance | 61 (44.9%) | 75 (55.1%) |
| Arts, Entertainment & Recreation | 0 (0.0%) | 0 (0.0%) |
| Accommodation & Food Services | 21 (67.7%) | 10 (32.3%) |
| Public Administration | 0 (0.0%) | 9 (100.0%) |
| Total | 285 (53.6%) | 247 (46.4%) |
Education in Ford Heights
School Enrollment in Ford Heights
The most common levels of schooling among the 338 students in Ford Heights are middle school (110 | 32.5%), elementary school (79 | 23.4%), and high school (70 | 20.7%).
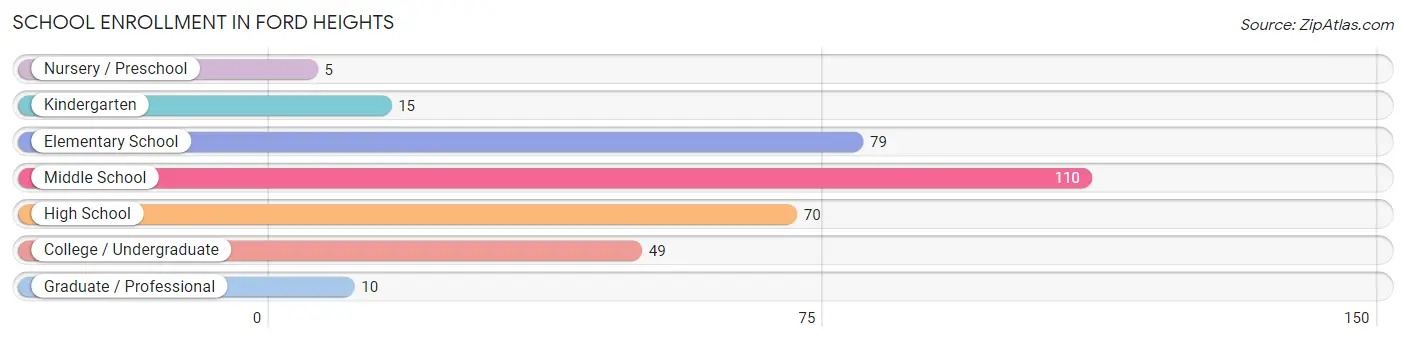
| School Level | # Students | % Students |
| Nursery / Preschool | 5 | 1.5% |
| Kindergarten | 15 | 4.4% |
| Elementary School | 79 | 23.4% |
| Middle School | 110 | 32.5% |
| High School | 70 | 20.7% |
| College / Undergraduate | 49 | 14.5% |
| Graduate / Professional | 10 | 3.0% |
| Total | 338 | 100.0% |
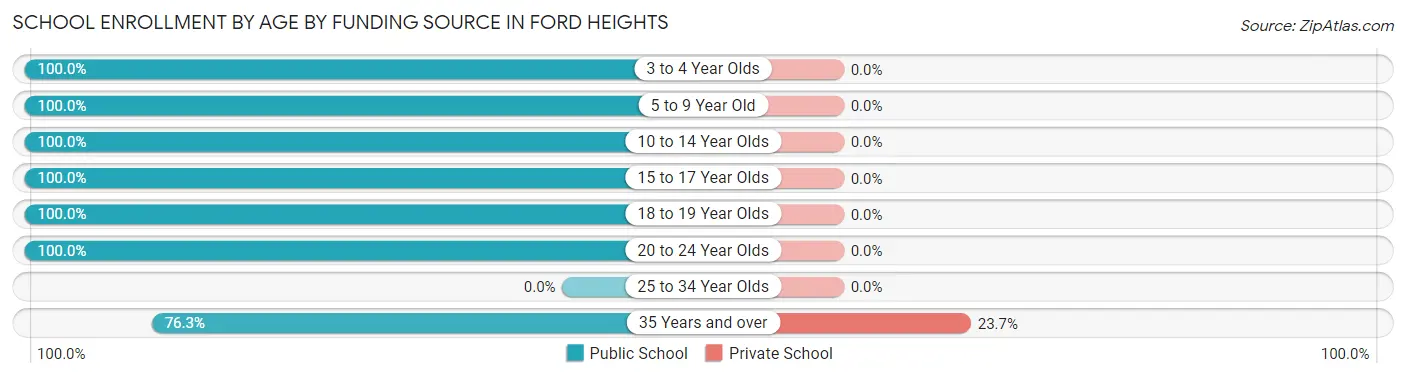
School Enrollment by Age by Funding Source in Ford Heights
Out of a total of 338 students who are enrolled in schools in Ford Heights, 9 (2.7%) attend a private institution, while the remaining 329 (97.3%) are enrolled in public schools. The age group of 35 years and over has the highest likelihood of being enrolled in private schools, with 9 (23.7% in the age bracket) enrolled. Conversely, the age group of 3 to 4 year olds has the lowest likelihood of being enrolled in a private school, with 5 (100.0% in the age bracket) attending a public institution.
| Age Bracket | Public School | Private School |
| 3 to 4 Year Olds | 5 (100.0%) | 0 (0.0%) |
| 5 to 9 Year Old | 84 (100.0%) | 0 (0.0%) |
| 10 to 14 Year Olds | 120 (100.0%) | 0 (0.0%) |
| 15 to 17 Year Olds | 66 (100.0%) | 0 (0.0%) |
| 18 to 19 Year Olds | 4 (100.0%) | 0 (0.0%) |
| 20 to 24 Year Olds | 21 (100.0%) | 0 (0.0%) |
| 25 to 34 Year Olds | 0 (0.0%) | 0 (0.0%) |
| 35 Years and over | 29 (76.3%) | 9 (23.7%) |
| Total | 329 (97.3%) | 9 (2.7%) |
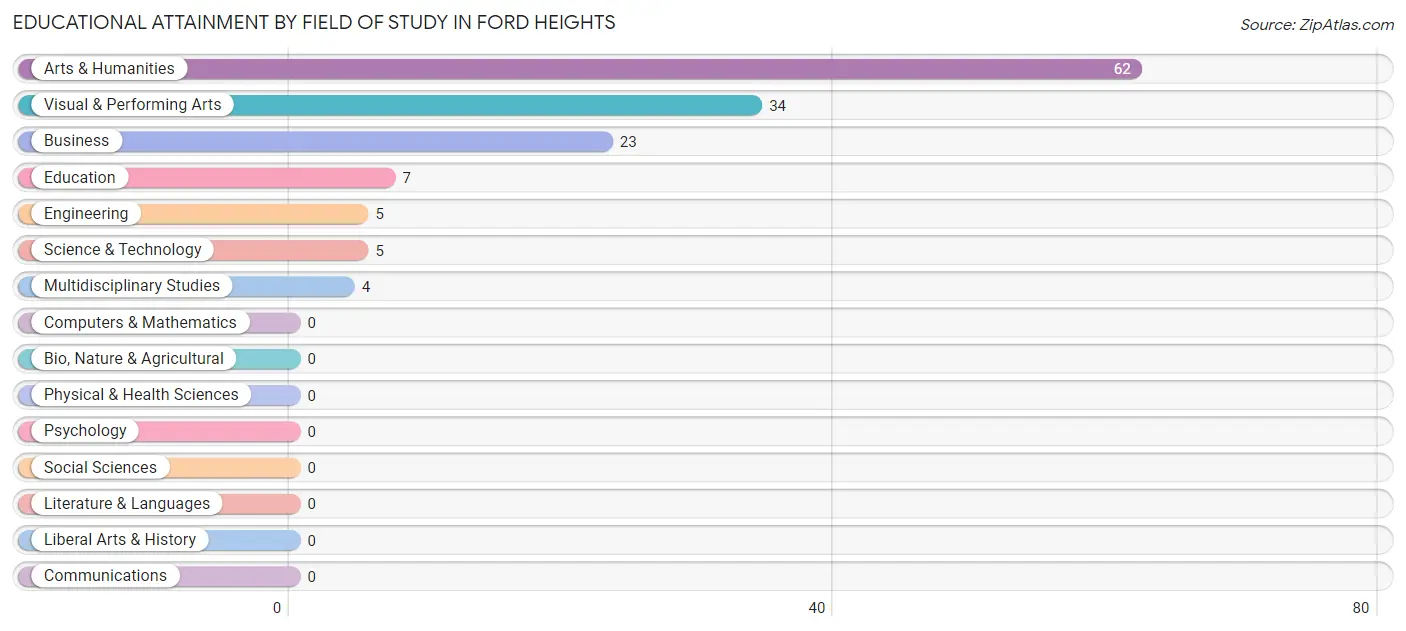
Educational Attainment by Field of Study in Ford Heights
Arts & humanities (62 | 44.3%), visual & performing arts (34 | 24.3%), business (23 | 16.4%), education (7 | 5.0%), and engineering (5 | 3.6%) are the most common fields of study among 140 individuals in Ford Heights who have obtained a bachelor's degree or higher.
| Field of Study | # Graduates | % Graduates |
| Computers & Mathematics | 0 | 0.0% |
| Bio, Nature & Agricultural | 0 | 0.0% |
| Physical & Health Sciences | 0 | 0.0% |
| Psychology | 0 | 0.0% |
| Social Sciences | 0 | 0.0% |
| Engineering | 5 | 3.6% |
| Multidisciplinary Studies | 4 | 2.9% |
| Science & Technology | 5 | 3.6% |
| Business | 23 | 16.4% |
| Education | 7 | 5.0% |
| Literature & Languages | 0 | 0.0% |
| Liberal Arts & History | 0 | 0.0% |
| Visual & Performing Arts | 34 | 24.3% |
| Communications | 0 | 0.0% |
| Arts & Humanities | 62 | 44.3% |
| Total | 140 | 100.0% |
Transportation & Commute in Ford Heights
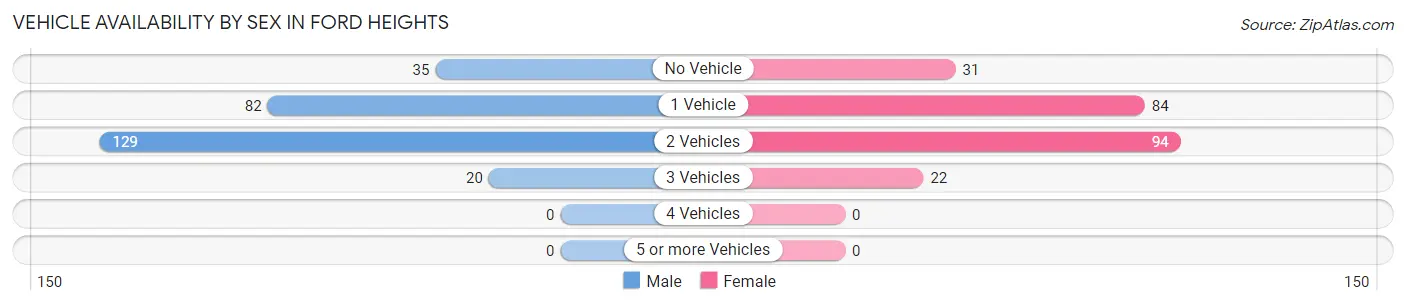
Vehicle Availability by Sex in Ford Heights
The most prevalent vehicle ownership categories in Ford Heights are males with 2 vehicles (129, accounting for 48.5%) and females with 2 vehicles (94, making up 55.8%).
| Vehicles Available | Male | Female |
| No Vehicle | 35 (13.2%) | 31 (13.4%) |
| 1 Vehicle | 82 (30.8%) | 84 (36.4%) |
| 2 Vehicles | 129 (48.5%) | 94 (40.7%) |
| 3 Vehicles | 20 (7.5%) | 22 (9.5%) |
| 4 Vehicles | 0 (0.0%) | 0 (0.0%) |
| 5 or more Vehicles | 0 (0.0%) | 0 (0.0%) |
| Total | 266 (100.0%) | 231 (100.0%) |
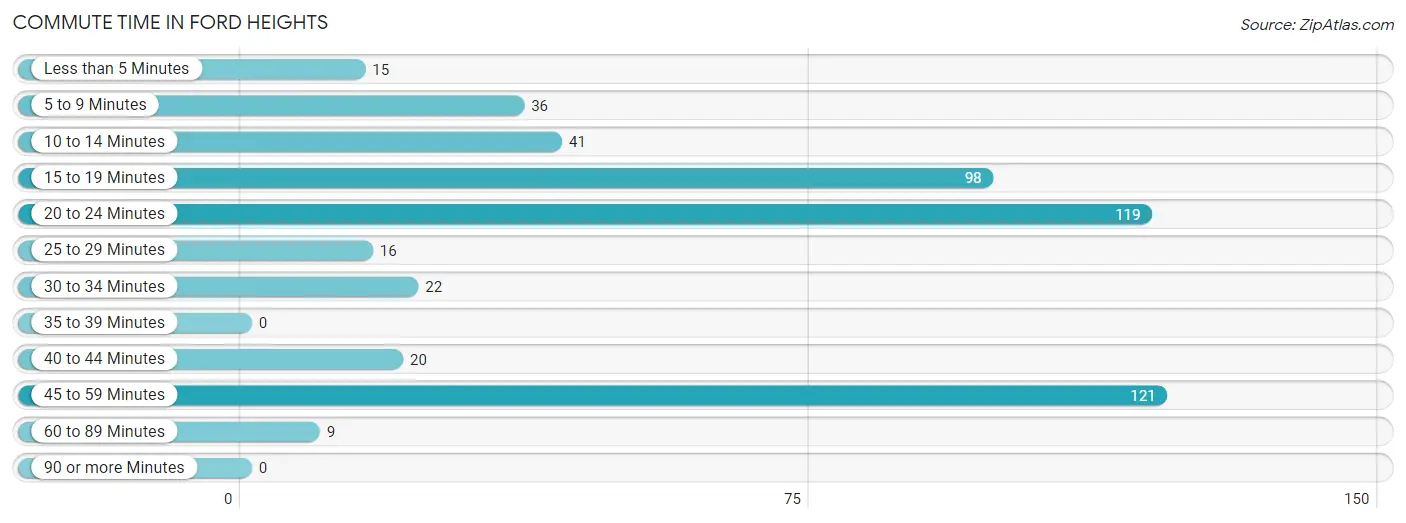
Commute Time in Ford Heights
The most frequently occuring commute durations in Ford Heights are 45 to 59 minutes (121 commuters, 24.3%), 20 to 24 minutes (119 commuters, 23.9%), and 15 to 19 minutes (98 commuters, 19.7%).
| Commute Time | # Commuters | % Commuters |
| Less than 5 Minutes | 15 | 3.0% |
| 5 to 9 Minutes | 36 | 7.2% |
| 10 to 14 Minutes | 41 | 8.3% |
| 15 to 19 Minutes | 98 | 19.7% |
| 20 to 24 Minutes | 119 | 23.9% |
| 25 to 29 Minutes | 16 | 3.2% |
| 30 to 34 Minutes | 22 | 4.4% |
| 35 to 39 Minutes | 0 | 0.0% |
| 40 to 44 Minutes | 20 | 4.0% |
| 45 to 59 Minutes | 121 | 24.3% |
| 60 to 89 Minutes | 9 | 1.8% |
| 90 or more Minutes | 0 | 0.0% |
Commute Time by Sex in Ford Heights
The most common commute times in Ford Heights are 45 to 59 minutes (95 commuters, 35.7%) for males and 15 to 19 minutes (56 commuters, 24.2%) for females.
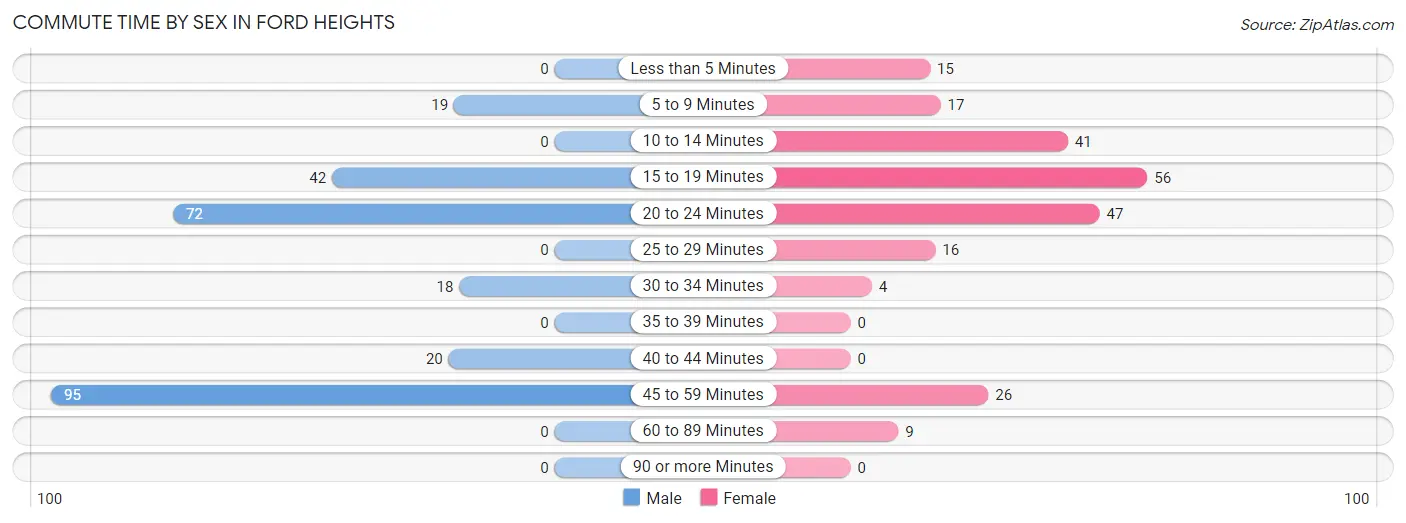
| Commute Time | Male | Female |
| Less than 5 Minutes | 0 (0.0%) | 15 (6.5%) |
| 5 to 9 Minutes | 19 (7.1%) | 17 (7.4%) |
| 10 to 14 Minutes | 0 (0.0%) | 41 (17.7%) |
| 15 to 19 Minutes | 42 (15.8%) | 56 (24.2%) |
| 20 to 24 Minutes | 72 (27.1%) | 47 (20.3%) |
| 25 to 29 Minutes | 0 (0.0%) | 16 (6.9%) |
| 30 to 34 Minutes | 18 (6.8%) | 4 (1.7%) |
| 35 to 39 Minutes | 0 (0.0%) | 0 (0.0%) |
| 40 to 44 Minutes | 20 (7.5%) | 0 (0.0%) |
| 45 to 59 Minutes | 95 (35.7%) | 26 (11.3%) |
| 60 to 89 Minutes | 0 (0.0%) | 9 (3.9%) |
| 90 or more Minutes | 0 (0.0%) | 0 (0.0%) |
Time of Departure to Work by Sex in Ford Heights
The most frequent times of departure to work in Ford Heights are 5:30 AM to 5:59 AM (102, 38.4%) for males and 8:30 AM to 8:59 AM (48, 20.8%) for females.
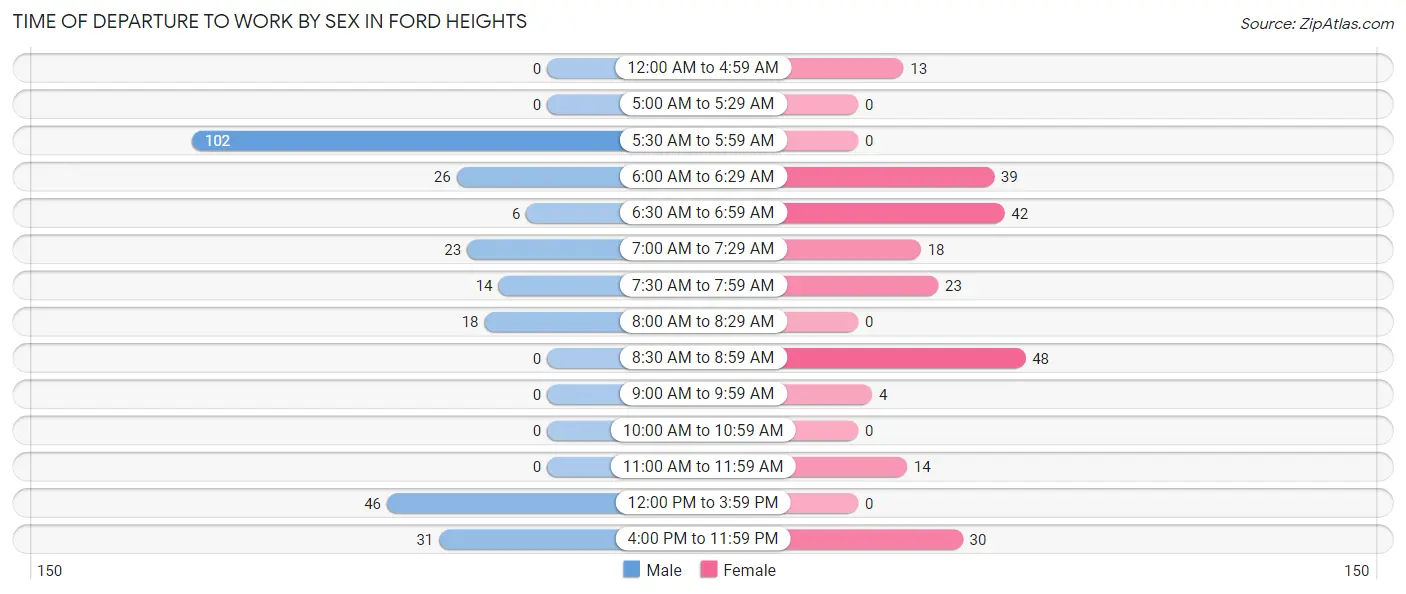
| Time of Departure | Male | Female |
| 12:00 AM to 4:59 AM | 0 (0.0%) | 13 (5.6%) |
| 5:00 AM to 5:29 AM | 0 (0.0%) | 0 (0.0%) |
| 5:30 AM to 5:59 AM | 102 (38.4%) | 0 (0.0%) |
| 6:00 AM to 6:29 AM | 26 (9.8%) | 39 (16.9%) |
| 6:30 AM to 6:59 AM | 6 (2.3%) | 42 (18.2%) |
| 7:00 AM to 7:29 AM | 23 (8.6%) | 18 (7.8%) |
| 7:30 AM to 7:59 AM | 14 (5.3%) | 23 (10.0%) |
| 8:00 AM to 8:29 AM | 18 (6.8%) | 0 (0.0%) |
| 8:30 AM to 8:59 AM | 0 (0.0%) | 48 (20.8%) |
| 9:00 AM to 9:59 AM | 0 (0.0%) | 4 (1.7%) |
| 10:00 AM to 10:59 AM | 0 (0.0%) | 0 (0.0%) |
| 11:00 AM to 11:59 AM | 0 (0.0%) | 14 (6.1%) |
| 12:00 PM to 3:59 PM | 46 (17.3%) | 0 (0.0%) |
| 4:00 PM to 11:59 PM | 31 (11.7%) | 30 (13.0%) |
| Total | 266 (100.0%) | 231 (100.0%) |
Housing Occupancy in Ford Heights
Occupancy by Ownership in Ford Heights
Of the total 569 dwellings in Ford Heights, owner-occupied units account for 216 (38.0%), while renter-occupied units make up 353 (62.0%).
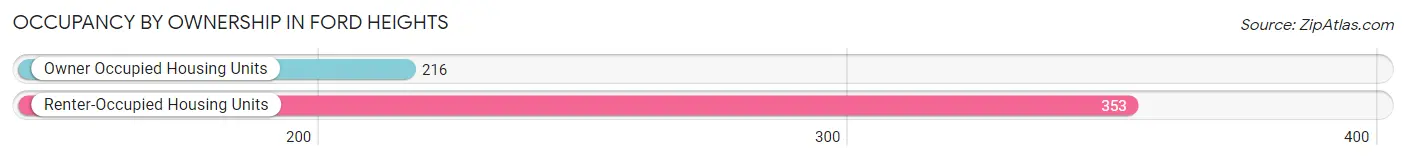
| Occupancy | # Housing Units | % Housing Units |
| Owner Occupied Housing Units | 216 | 38.0% |
| Renter-Occupied Housing Units | 353 | 62.0% |
| Total Occupied Housing Units | 569 | 100.0% |
Occupancy by Household Size in Ford Heights
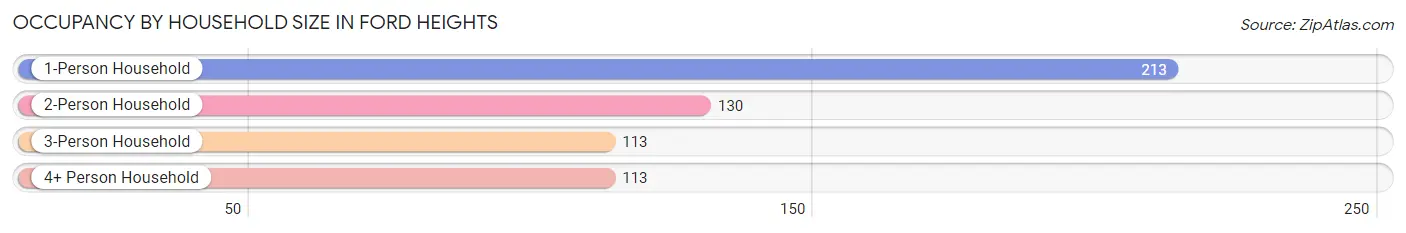
| Household Size | # Housing Units | % Housing Units |
| 1-Person Household | 213 | 37.4% |
| 2-Person Household | 130 | 22.9% |
| 3-Person Household | 113 | 19.9% |
| 4+ Person Household | 113 | 19.9% |
| Total Housing Units | 569 | 100.0% |
Occupancy by Ownership by Household Size in Ford Heights
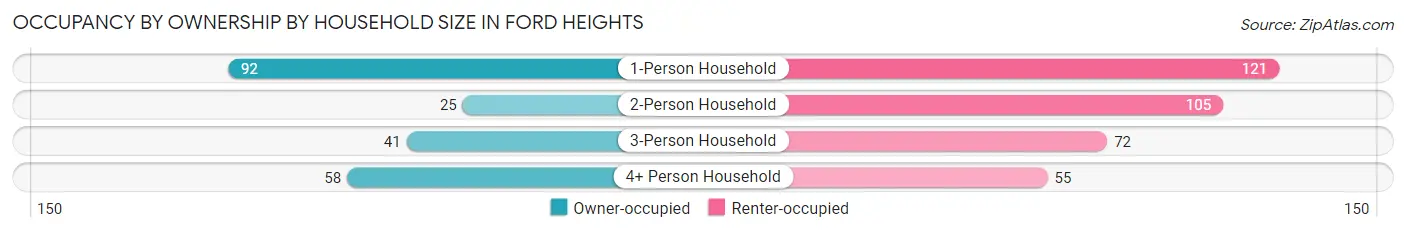
| Household Size | Owner-occupied | Renter-occupied |
| 1-Person Household | 92 (43.2%) | 121 (56.8%) |
| 2-Person Household | 25 (19.2%) | 105 (80.8%) |
| 3-Person Household | 41 (36.3%) | 72 (63.7%) |
| 4+ Person Household | 58 (51.3%) | 55 (48.7%) |
| Total Housing Units | 216 (38.0%) | 353 (62.0%) |
Occupancy by Educational Attainment in Ford Heights
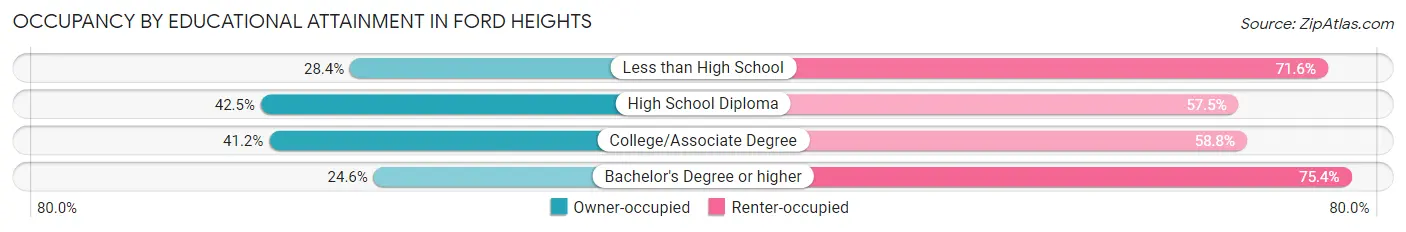
| Household Size | Owner-occupied | Renter-occupied |
| Less than High School | 21 (28.4%) | 53 (71.6%) |
| High School Diploma | 77 (42.5%) | 104 (57.5%) |
| College/Associate Degree | 101 (41.2%) | 144 (58.8%) |
| Bachelor's Degree or higher | 17 (24.6%) | 52 (75.4%) |
Occupancy by Age of Householder in Ford Heights
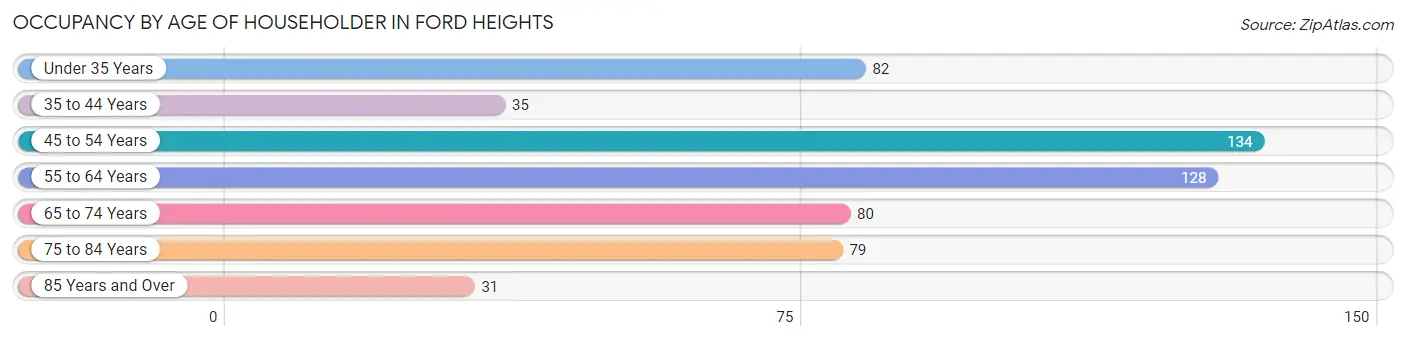
| Age Bracket | # Households | % Households |
| Under 35 Years | 82 | 14.4% |
| 35 to 44 Years | 35 | 6.1% |
| 45 to 54 Years | 134 | 23.5% |
| 55 to 64 Years | 128 | 22.5% |
| 65 to 74 Years | 80 | 14.1% |
| 75 to 84 Years | 79 | 13.9% |
| 85 Years and Over | 31 | 5.4% |
| Total | 569 | 100.0% |
Housing Finances in Ford Heights
Median Income by Occupancy in Ford Heights
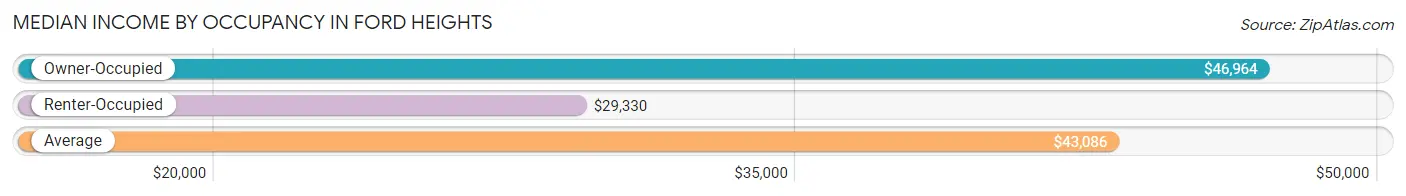
| Occupancy Type | # Households | Median Income |
| Owner-Occupied | 216 (38.0%) | $46,964 |
| Renter-Occupied | 353 (62.0%) | $29,330 |
| Average | 569 (100.0%) | $43,086 |
Occupancy by Householder Income Bracket in Ford Heights
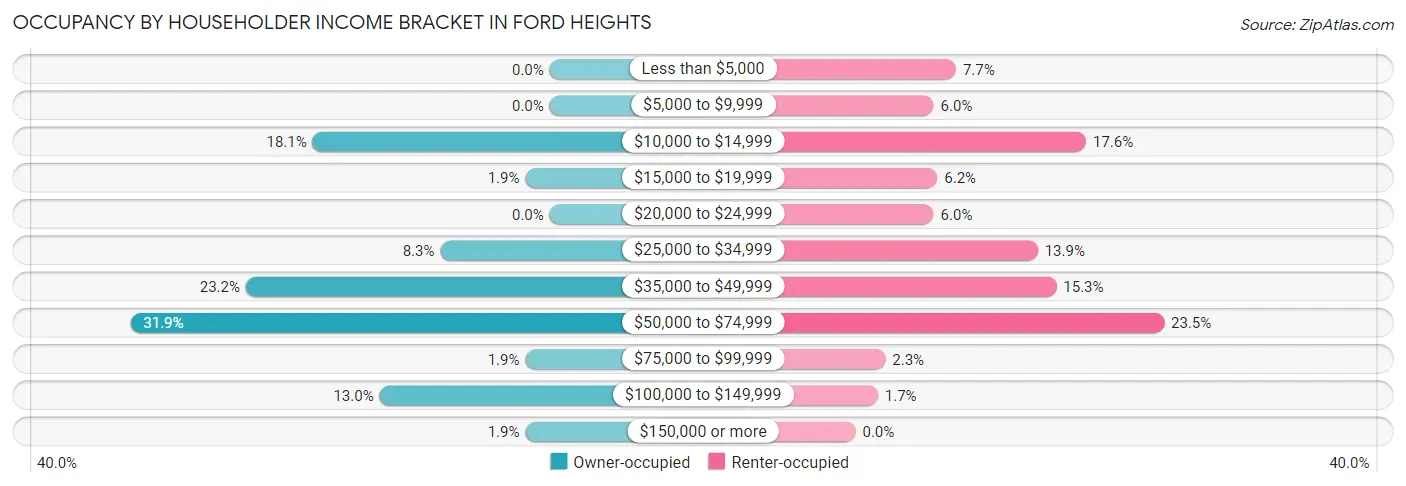
| Income Bracket | Owner-occupied | Renter-occupied |
| Less than $5,000 | 0 (0.0%) | 27 (7.6%) |
| $5,000 to $9,999 | 0 (0.0%) | 21 (5.9%) |
| $10,000 to $14,999 | 39 (18.1%) | 62 (17.6%) |
| $15,000 to $19,999 | 4 (1.8%) | 22 (6.2%) |
| $20,000 to $24,999 | 0 (0.0%) | 21 (5.9%) |
| $25,000 to $34,999 | 18 (8.3%) | 49 (13.9%) |
| $35,000 to $49,999 | 50 (23.2%) | 54 (15.3%) |
| $50,000 to $74,999 | 69 (31.9%) | 83 (23.5%) |
| $75,000 to $99,999 | 4 (1.8%) | 8 (2.3%) |
| $100,000 to $149,999 | 28 (13.0%) | 6 (1.7%) |
| $150,000 or more | 4 (1.8%) | 0 (0.0%) |
| Total | 216 (100.0%) | 353 (100.0%) |
Monthly Housing Cost Tiers in Ford Heights
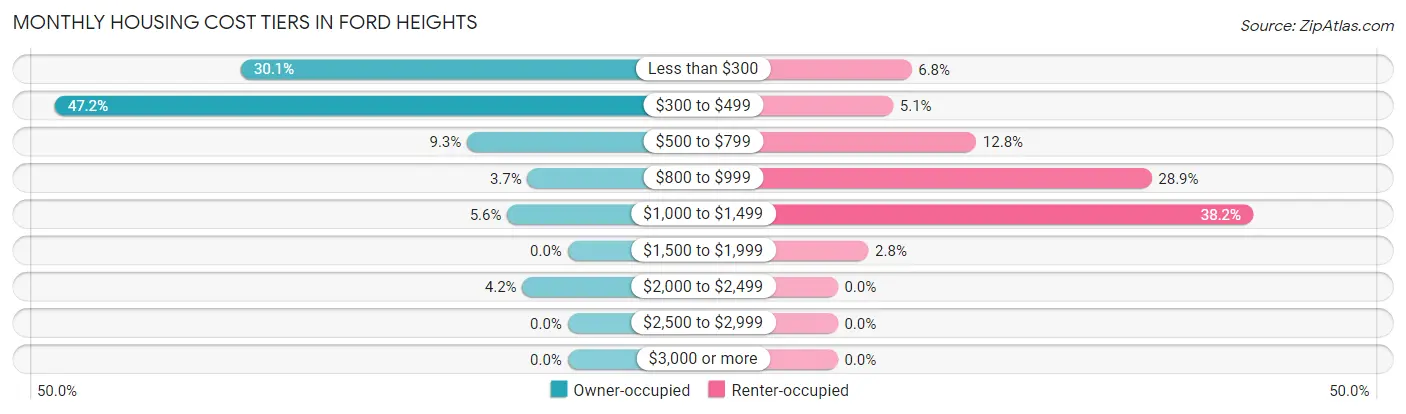
| Monthly Cost | Owner-occupied | Renter-occupied |
| Less than $300 | 65 (30.1%) | 24 (6.8%) |
| $300 to $499 | 102 (47.2%) | 18 (5.1%) |
| $500 to $799 | 20 (9.3%) | 45 (12.8%) |
| $800 to $999 | 8 (3.7%) | 102 (28.9%) |
| $1,000 to $1,499 | 12 (5.6%) | 135 (38.2%) |
| $1,500 to $1,999 | 0 (0.0%) | 10 (2.8%) |
| $2,000 to $2,499 | 9 (4.2%) | 0 (0.0%) |
| $2,500 to $2,999 | 0 (0.0%) | 0 (0.0%) |
| $3,000 or more | 0 (0.0%) | 0 (0.0%) |
| Total | 216 (100.0%) | 353 (100.0%) |
Physical Housing Characteristics in Ford Heights
Housing Structures in Ford Heights
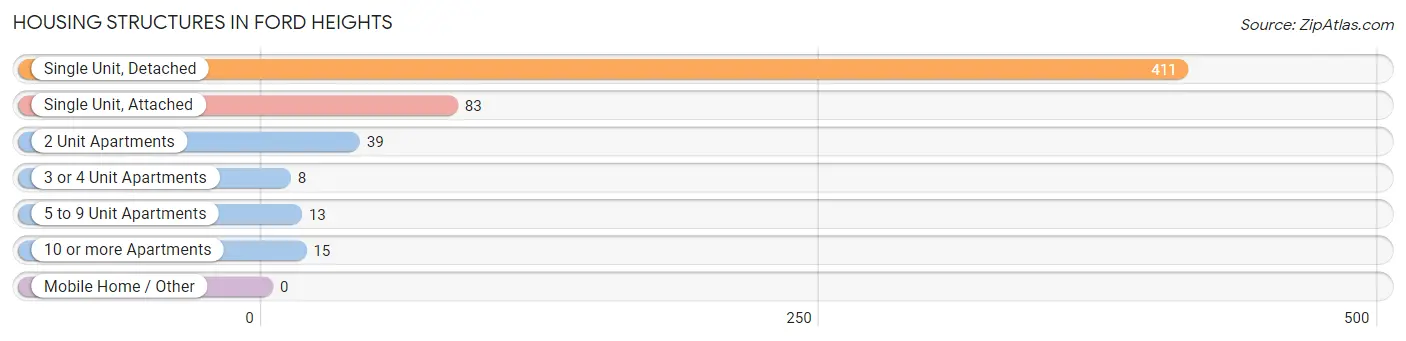
| Structure Type | # Housing Units | % Housing Units |
| Single Unit, Detached | 411 | 72.2% |
| Single Unit, Attached | 83 | 14.6% |
| 2 Unit Apartments | 39 | 6.9% |
| 3 or 4 Unit Apartments | 8 | 1.4% |
| 5 to 9 Unit Apartments | 13 | 2.3% |
| 10 or more Apartments | 15 | 2.6% |
| Mobile Home / Other | 0 | 0.0% |
| Total | 569 | 100.0% |
Housing Structures by Occupancy in Ford Heights
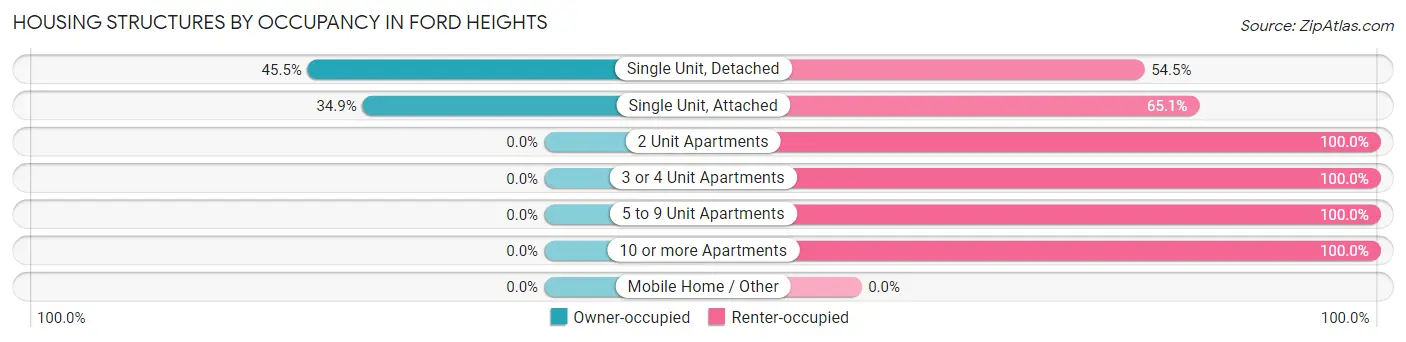
| Structure Type | Owner-occupied | Renter-occupied |
| Single Unit, Detached | 187 (45.5%) | 224 (54.5%) |
| Single Unit, Attached | 29 (34.9%) | 54 (65.1%) |
| 2 Unit Apartments | 0 (0.0%) | 39 (100.0%) |
| 3 or 4 Unit Apartments | 0 (0.0%) | 8 (100.0%) |
| 5 to 9 Unit Apartments | 0 (0.0%) | 13 (100.0%) |
| 10 or more Apartments | 0 (0.0%) | 15 (100.0%) |
| Mobile Home / Other | 0 (0.0%) | 0 (0.0%) |
| Total | 216 (38.0%) | 353 (62.0%) |
Housing Structures by Number of Rooms in Ford Heights
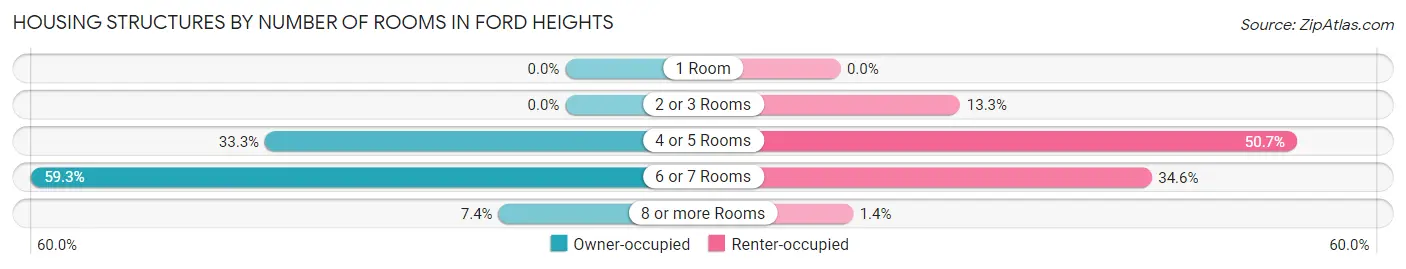
| Number of Rooms | Owner-occupied | Renter-occupied |
| 1 Room | 0 (0.0%) | 0 (0.0%) |
| 2 or 3 Rooms | 0 (0.0%) | 47 (13.3%) |
| 4 or 5 Rooms | 72 (33.3%) | 179 (50.7%) |
| 6 or 7 Rooms | 128 (59.3%) | 122 (34.6%) |
| 8 or more Rooms | 16 (7.4%) | 5 (1.4%) |
| Total | 216 (100.0%) | 353 (100.0%) |
Housing Structure by Heating Type in Ford Heights
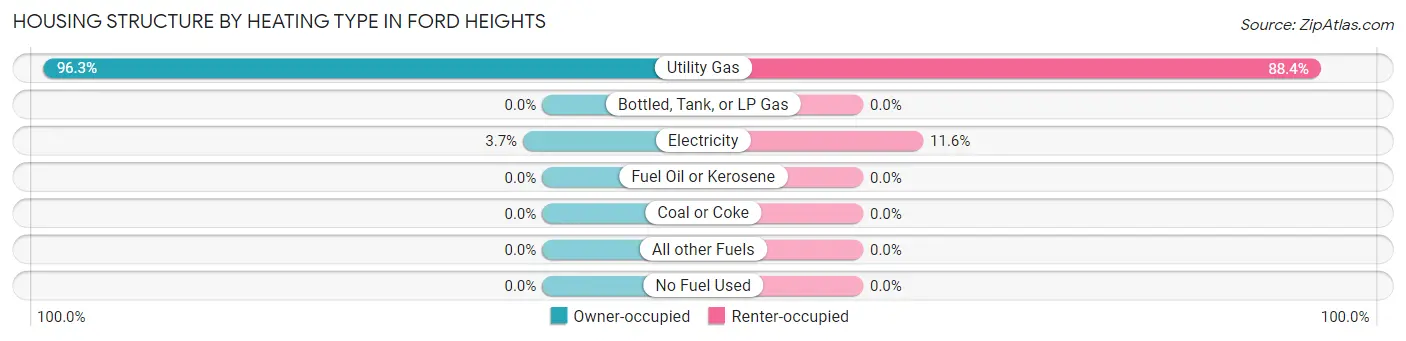
| Heating Type | Owner-occupied | Renter-occupied |
| Utility Gas | 208 (96.3%) | 312 (88.4%) |
| Bottled, Tank, or LP Gas | 0 (0.0%) | 0 (0.0%) |
| Electricity | 8 (3.7%) | 41 (11.6%) |
| Fuel Oil or Kerosene | 0 (0.0%) | 0 (0.0%) |
| Coal or Coke | 0 (0.0%) | 0 (0.0%) |
| All other Fuels | 0 (0.0%) | 0 (0.0%) |
| No Fuel Used | 0 (0.0%) | 0 (0.0%) |
| Total | 216 (100.0%) | 353 (100.0%) |
Household Vehicle Usage in Ford Heights
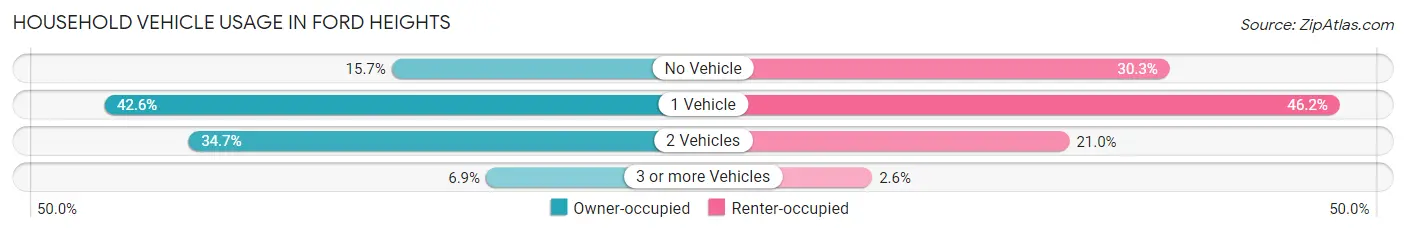
| Vehicles per Household | Owner-occupied | Renter-occupied |
| No Vehicle | 34 (15.7%) | 107 (30.3%) |
| 1 Vehicle | 92 (42.6%) | 163 (46.2%) |
| 2 Vehicles | 75 (34.7%) | 74 (21.0%) |
| 3 or more Vehicles | 15 (6.9%) | 9 (2.5%) |
| Total | 216 (100.0%) | 353 (100.0%) |
Real Estate & Mortgages in Ford Heights
Real Estate and Mortgage Overview in Ford Heights
| Characteristic | Without Mortgage | With Mortgage |
| Housing Units | 191 | 25 |
| Median Property Value | $39,600 | $178,100 |
| Median Household Income | $44,883 | $4 |
| Monthly Housing Costs | $361 | $0 |
| Real Estate Taxes | $2,018 | $7 |
Property Value by Mortgage Status in Ford Heights
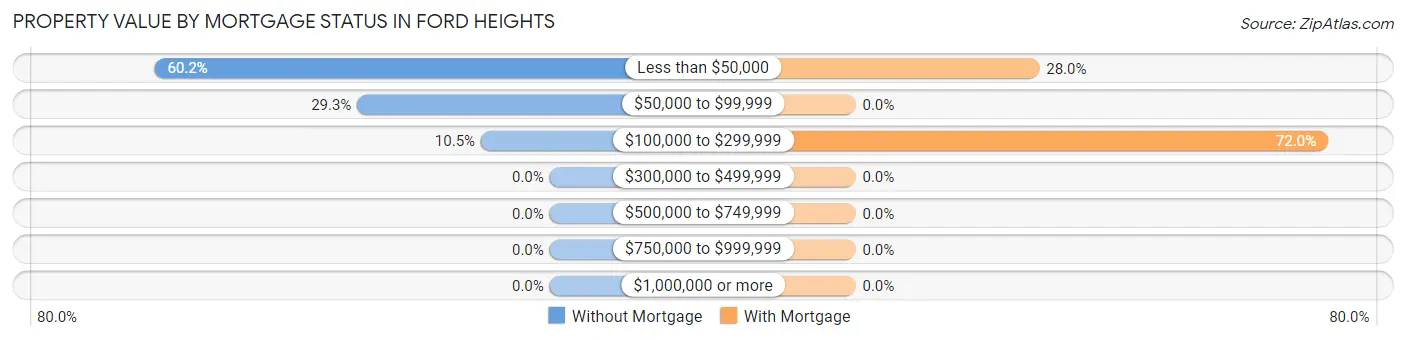
| Property Value | Without Mortgage | With Mortgage |
| Less than $50,000 | 115 (60.2%) | 7 (28.0%) |
| $50,000 to $99,999 | 56 (29.3%) | 0 (0.0%) |
| $100,000 to $299,999 | 20 (10.5%) | 18 (72.0%) |
| $300,000 to $499,999 | 0 (0.0%) | 0 (0.0%) |
| $500,000 to $749,999 | 0 (0.0%) | 0 (0.0%) |
| $750,000 to $999,999 | 0 (0.0%) | 0 (0.0%) |
| $1,000,000 or more | 0 (0.0%) | 0 (0.0%) |
| Total | 191 (100.0%) | 25 (100.0%) |
Household Income by Mortgage Status in Ford Heights
| Household Income | Without Mortgage | With Mortgage |
| Less than $10,000 | 0 (0.0%) | 0 (0.0%) |
| $10,000 to $24,999 | 43 (22.5%) | 0 (0.0%) |
| $25,000 to $34,999 | 18 (9.4%) | 0 (0.0%) |
| $35,000 to $49,999 | 46 (24.1%) | 0 (0.0%) |
| $50,000 to $74,999 | 61 (31.9%) | 4 (16.0%) |
| $75,000 to $99,999 | 4 (2.1%) | 8 (32.0%) |
| $100,000 to $149,999 | 19 (10.0%) | 0 (0.0%) |
| $150,000 or more | 0 (0.0%) | 9 (36.0%) |
| Total | 191 (100.0%) | 25 (100.0%) |
Property Value to Household Income Ratio in Ford Heights
| Value-to-Income Ratio | Without Mortgage | With Mortgage |
| Less than 2.0x | 138 (72.3%) | 0 (0.0%) |
| 2.0x to 2.9x | 27 (14.1%) | 20 (80.0%) |
| 3.0x to 3.9x | 5 (2.6%) | 0 (0.0%) |
| 4.0x or more | 21 (11.0%) | 5 (20.0%) |
| Total | 191 (100.0%) | 25 (100.0%) |
Real Estate Taxes by Mortgage Status in Ford Heights
| Property Taxes | Without Mortgage | With Mortgage |
| Less than $800 | 6 (3.1%) | 0 (0.0%) |
| $800 to $1,499 | 20 (10.5%) | 0 (0.0%) |
| $800 to $1,499 | 35 (18.3%) | 0 (0.0%) |
| Total | 191 (100.0%) | 25 (100.0%) |
Health & Disability in Ford Heights
Health Insurance Coverage by Age in Ford Heights
| Age Bracket | With Coverage | Without Coverage |
| Under 6 Years | 84 (88.4%) | 11 (11.6%) |
| 6 to 18 Years | 254 (87.6%) | 36 (12.4%) |
| 19 to 25 Years | 139 (95.9%) | 6 (4.1%) |
| 26 to 34 Years | 227 (89.0%) | 28 (11.0%) |
| 35 to 44 Years | 145 (90.1%) | 16 (9.9%) |
| 45 to 54 Years | 139 (65.6%) | 73 (34.4%) |
| 55 to 64 Years | 185 (97.4%) | 5 (2.6%) |
| 65 to 74 Years | 126 (96.9%) | 4 (3.1%) |
| 75 Years and older | 140 (100.0%) | 0 (0.0%) |
| Total | 1,439 (88.9%) | 179 (11.1%) |
Health Insurance Coverage by Citizenship Status in Ford Heights
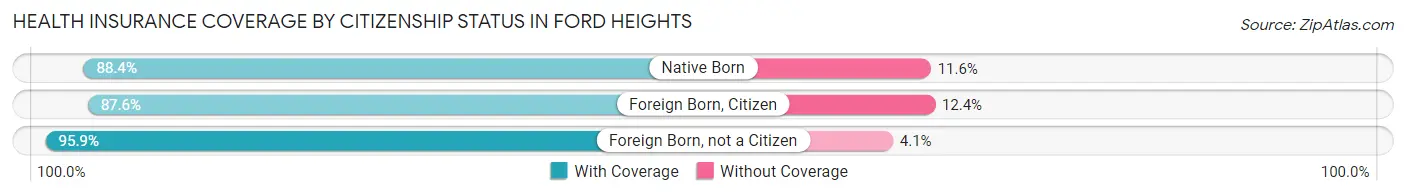
| Citizenship Status | With Coverage | Without Coverage |
| Native Born | 84 (88.4%) | 11 (11.6%) |
| Foreign Born, Citizen | 254 (87.6%) | 36 (12.4%) |
| Foreign Born, not a Citizen | 139 (95.9%) | 6 (4.1%) |
Health Insurance Coverage by Household Income in Ford Heights
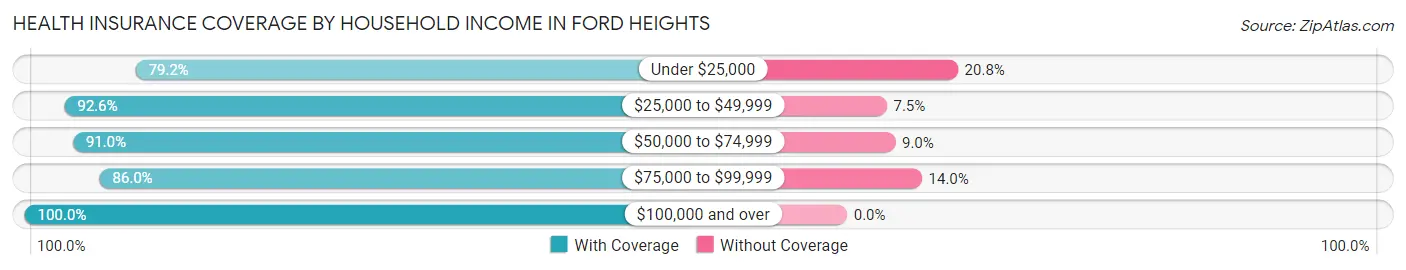
| Household Income | With Coverage | Without Coverage |
| Under $25,000 | 328 (79.2%) | 86 (20.8%) |
| $25,000 to $49,999 | 385 (92.5%) | 31 (7.4%) |
| $50,000 to $74,999 | 473 (91.0%) | 47 (9.0%) |
| $75,000 to $99,999 | 92 (86.0%) | 15 (14.0%) |
| $100,000 and over | 161 (100.0%) | 0 (0.0%) |
Public vs Private Health Insurance Coverage by Age in Ford Heights
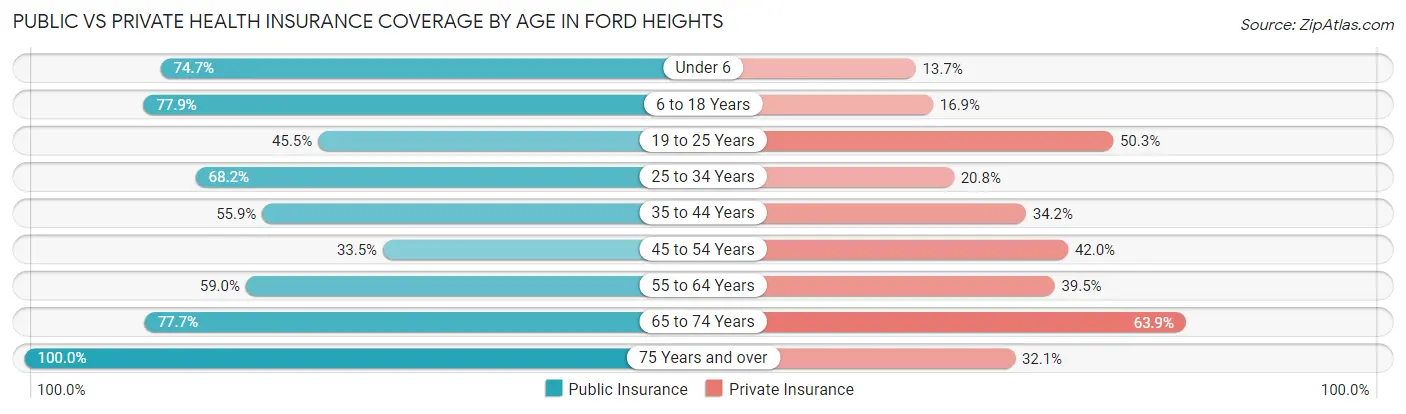
| Age Bracket | Public Insurance | Private Insurance |
| Under 6 | 71 (74.7%) | 13 (13.7%) |
| 6 to 18 Years | 226 (77.9%) | 49 (16.9%) |
| 19 to 25 Years | 66 (45.5%) | 73 (50.3%) |
| 25 to 34 Years | 174 (68.2%) | 53 (20.8%) |
| 35 to 44 Years | 90 (55.9%) | 55 (34.2%) |
| 45 to 54 Years | 71 (33.5%) | 89 (42.0%) |
| 55 to 64 Years | 112 (59.0%) | 75 (39.5%) |
| 65 to 74 Years | 101 (77.7%) | 83 (63.8%) |
| 75 Years and over | 140 (100.0%) | 45 (32.1%) |
| Total | 1,051 (65.0%) | 535 (33.1%) |
Disability Status by Sex by Age in Ford Heights
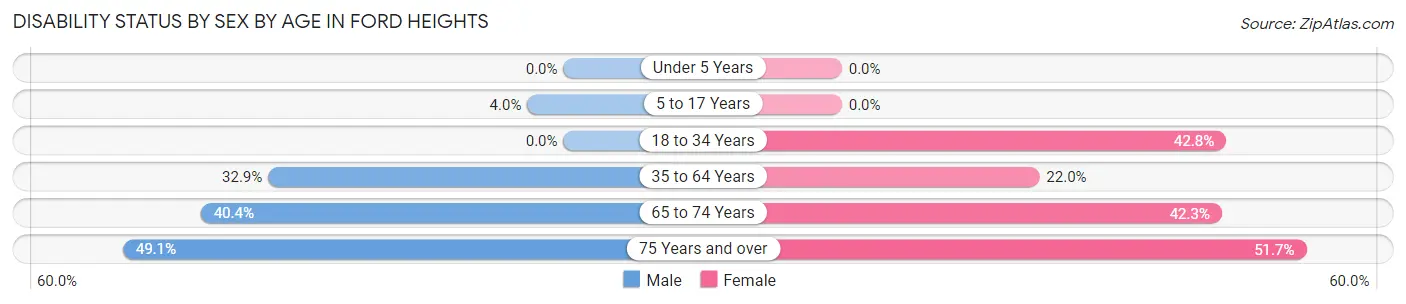
| Age Bracket | Male | Female |
| Under 5 Years | 0 (0.0%) | 0 (0.0%) |
| 5 to 17 Years | 7 (4.0%) | 0 (0.0%) |
| 18 to 34 Years | 0 (0.0%) | 98 (42.8%) |
| 35 to 64 Years | 97 (32.9%) | 59 (22.0%) |
| 65 to 74 Years | 21 (40.4%) | 33 (42.3%) |
| 75 Years and over | 26 (49.1%) | 45 (51.7%) |
Disability Class by Sex by Age in Ford Heights
Disability Class: Hearing Difficulty
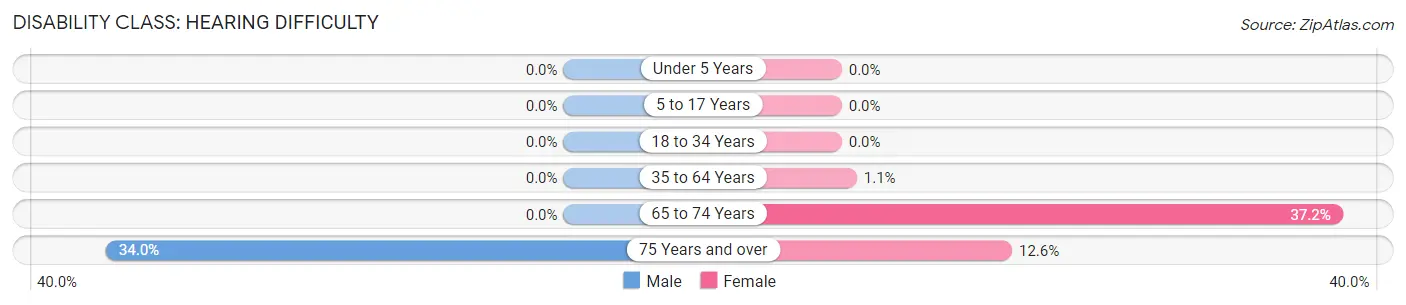
| Age Bracket | Male | Female |
| Under 5 Years | 0 (0.0%) | 0 (0.0%) |
| 5 to 17 Years | 0 (0.0%) | 0 (0.0%) |
| 18 to 34 Years | 0 (0.0%) | 0 (0.0%) |
| 35 to 64 Years | 0 (0.0%) | 3 (1.1%) |
| 65 to 74 Years | 0 (0.0%) | 29 (37.2%) |
| 75 Years and over | 18 (34.0%) | 11 (12.6%) |
Disability Class: Vision Difficulty
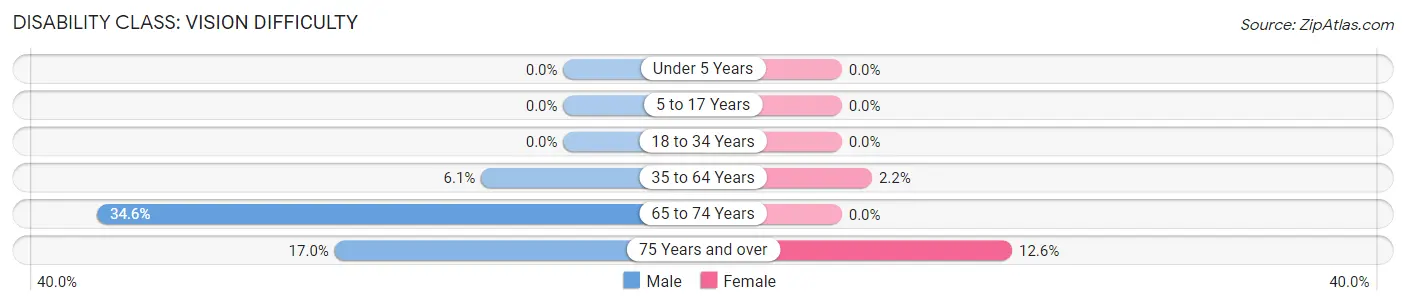
| Age Bracket | Male | Female |
| Under 5 Years | 0 (0.0%) | 0 (0.0%) |
| 5 to 17 Years | 0 (0.0%) | 0 (0.0%) |
| 18 to 34 Years | 0 (0.0%) | 0 (0.0%) |
| 35 to 64 Years | 18 (6.1%) | 6 (2.2%) |
| 65 to 74 Years | 18 (34.6%) | 0 (0.0%) |
| 75 Years and over | 9 (17.0%) | 11 (12.6%) |
Disability Class: Cognitive Difficulty
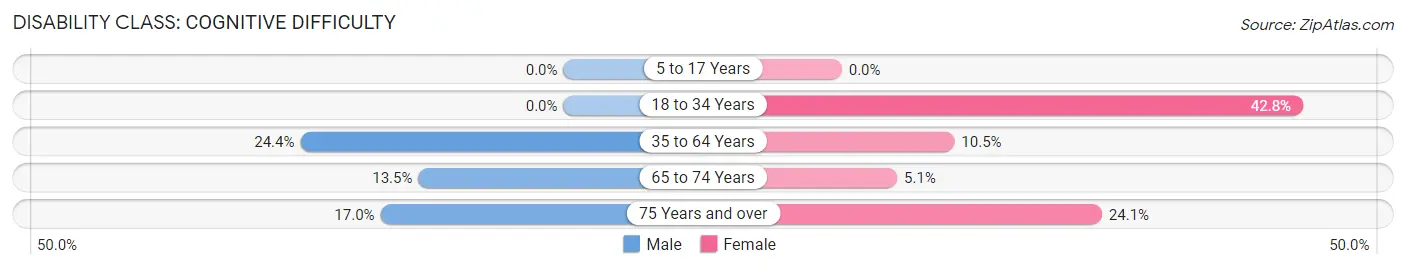
| Age Bracket | Male | Female |
| 5 to 17 Years | 0 (0.0%) | 0 (0.0%) |
| 18 to 34 Years | 0 (0.0%) | 98 (42.8%) |
| 35 to 64 Years | 72 (24.4%) | 28 (10.4%) |
| 65 to 74 Years | 7 (13.5%) | 4 (5.1%) |
| 75 Years and over | 9 (17.0%) | 21 (24.1%) |
Disability Class: Ambulatory Difficulty
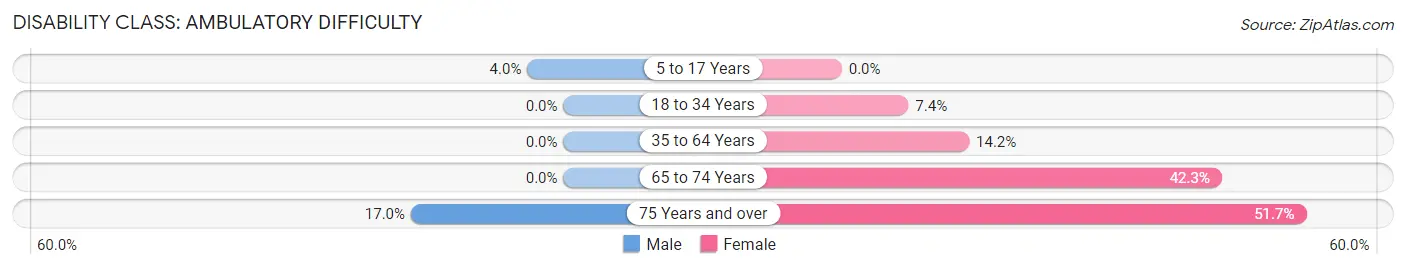
| Age Bracket | Male | Female |
| 5 to 17 Years | 7 (4.0%) | 0 (0.0%) |
| 18 to 34 Years | 0 (0.0%) | 17 (7.4%) |
| 35 to 64 Years | 0 (0.0%) | 38 (14.2%) |
| 65 to 74 Years | 0 (0.0%) | 33 (42.3%) |
| 75 Years and over | 9 (17.0%) | 45 (51.7%) |
Disability Class: Self-Care Difficulty
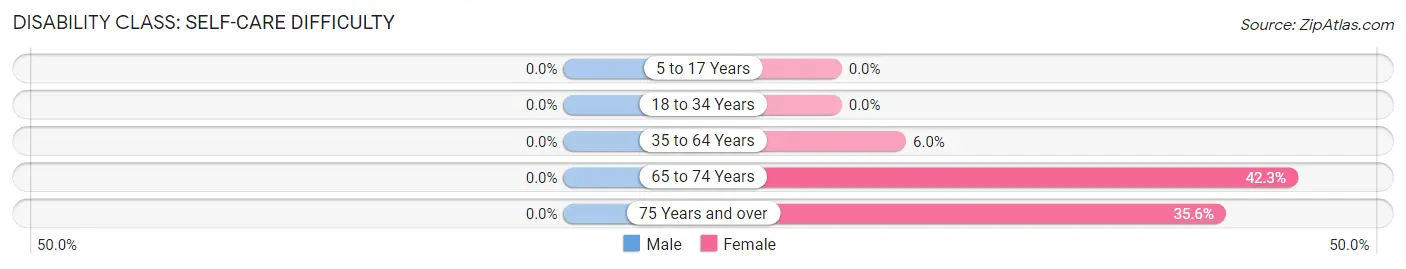
| Age Bracket | Male | Female |
| 5 to 17 Years | 0 (0.0%) | 0 (0.0%) |
| 18 to 34 Years | 0 (0.0%) | 0 (0.0%) |
| 35 to 64 Years | 0 (0.0%) | 16 (6.0%) |
| 65 to 74 Years | 0 (0.0%) | 33 (42.3%) |
| 75 Years and over | 0 (0.0%) | 31 (35.6%) |
Technology Access in Ford Heights
Computing Device Access in Ford Heights
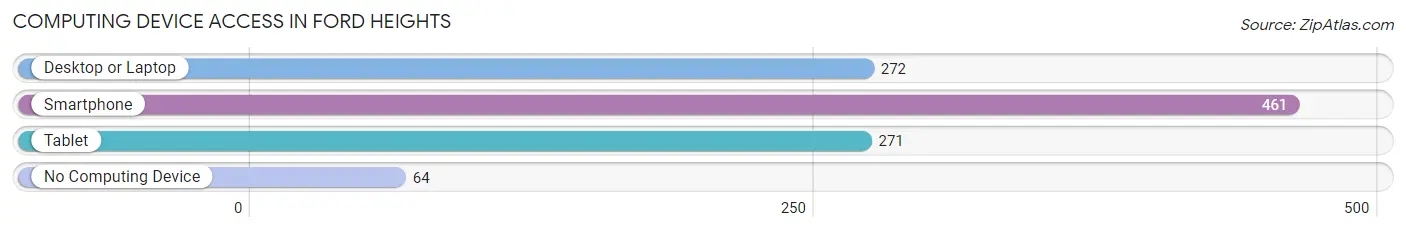
| Device Type | # Households | % Households |
| Desktop or Laptop | 272 | 47.8% |
| Smartphone | 461 | 81.0% |
| Tablet | 271 | 47.6% |
| No Computing Device | 64 | 11.3% |
| Total | 569 | 100.0% |
Internet Access in Ford Heights
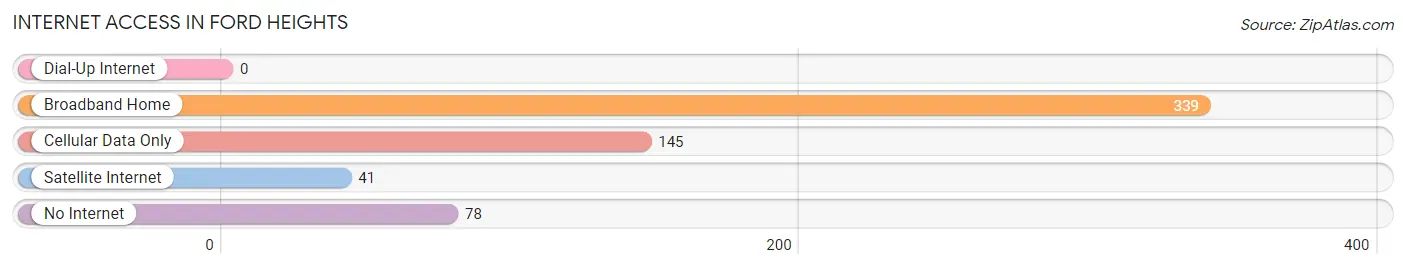
| Internet Type | # Households | % Households |
| Dial-Up Internet | 0 | 0.0% |
| Broadband Home | 339 | 59.6% |
| Cellular Data Only | 145 | 25.5% |
| Satellite Internet | 41 | 7.2% |
| No Internet | 78 | 13.7% |
| Total | 569 | 100.0% |
Ford Heights Summary
History
Ford Heights is a village located in Cook County, Illinois, United States. It is a suburb of Chicago, located approximately 25 miles south of the city. The village was incorporated in 1925 and is named after Henry Ford, the founder of the Ford Motor Company.
The area that is now Ford Heights was originally inhabited by the Potawatomi Native American tribe. The first European settlers arrived in the area in the early 19th century. The village was originally known as East Chicago Heights, and was renamed Ford Heights in 1925.
The village experienced rapid growth in the 1950s and 1960s, as many African-American families moved to the area from the South. The population of Ford Heights peaked in 1970, with a population of over 10,000.
Geography
Ford Heights is located in Cook County, Illinois, approximately 25 miles south of Chicago. The village is situated on the Calumet River, and is bordered by the cities of Chicago Heights to the north, Lynwood to the east, and Sauk Village to the south.
The village has a total area of 1.3 square miles, all of which is land. The terrain is mostly flat, with some rolling hills. The climate is humid continental, with hot summers and cold winters.
Economy
The economy of Ford Heights is largely based on manufacturing and retail. The village is home to several factories, including a steel mill, a paper mill, and a plastics factory. The village also has several retail stores, including a grocery store, a hardware store, and a pharmacy.
The village also has a number of small businesses, including auto repair shops, restaurants, and beauty salons. The village is also home to a number of churches, including the First Baptist Church of Ford Heights.
Demographics
As of the 2010 census, the population of Ford Heights was 4,160. The racial makeup of the village was 97.2% African American, 1.2% White, 0.3% Native American, 0.2% Asian, and 0.9% from other races.
The median household income in Ford Heights was $25,938, and the median family income was $30,938. The per capita income was $13,938. About 28.2% of the population was below the poverty line.
The village is served by the Ford Heights School District, which includes two elementary schools, a middle school, and a high school. The village is also home to a branch of the Cook County Library.
Common Questions
What is Per Capita Income in Ford Heights?
Per Capita income in Ford Heights is $15,803.
What is the Median Family Income in Ford Heights?
Median Family Income in Ford Heights is $46,422.
What is the Median Household income in Ford Heights?
Median Household Income in Ford Heights is $43,086.
What is Inequality or Gini Index in Ford Heights?
Inequality or Gini Index in Ford Heights is 0.39.
What is the Total Population of Ford Heights?
Total Population of Ford Heights is 1,618.
What is the Total Male Population of Ford Heights?
Total Male Population of Ford Heights is 805.
What is the Total Female Population of Ford Heights?
Total Female Population of Ford Heights is 813.
What is the Ratio of Males per 100 Females in Ford Heights?
There are 99.02 Males per 100 Females in Ford Heights.
What is the Ratio of Females per 100 Males in Ford Heights?
There are 100.99 Females per 100 Males in Ford Heights.
What is the Median Population Age in Ford Heights?
Median Population Age in Ford Heights is 37.4 Years.
What is the Average Family Size in Ford Heights
Average Family Size in Ford Heights is 4.0 People.
What is the Average Household Size in Ford Heights
Average Household Size in Ford Heights is 2.8 People.
How Large is the Labor Force in Ford Heights?
There are 599 People in the Labor Forcein in Ford Heights.
What is the Percentage of People in the Labor Force in Ford Heights?
47.2% of People are in the Labor Force in Ford Heights.
What is the Unemployment Rate in Ford Heights?
Unemployment Rate in Ford Heights is 11.2%.