Danville, IL Map & Demographics
Danville Map
Danville Overview
$24,786
PER CAPITA INCOME
$53,493
AVG FAMILY INCOME
$42,424
AVG HOUSEHOLD INCOME
27.6%
WAGE / INCOME GAP [ % ]
72.4¢/ $1
WAGE / INCOME GAP [ $ ]
$11,597
FAMILY INCOME DEFICIT
0.47
INEQUALITY / GINI INDEX
29,100
TOTAL POPULATION
14,666
MALE POPULATION
14,434
FEMALE POPULATION
101.61
MALES / 100 FEMALES
98.42
FEMALES / 100 MALES
38.6
MEDIAN AGE
3.2
AVG FAMILY SIZE
2.3
AVG HOUSEHOLD SIZE
11,472
LABOR FORCE [ PEOPLE ]
50.4%
PERCENT IN LABOR FORCE
9.2%
UNEMPLOYMENT RATE
Danville Area Codes
Income in Danville
Income Overview in Danville
Per Capita Income in Danville is $24,786, while median incomes of families and households are $53,493 and $42,424 respectively.
| Characteristic | Number | Measure |
| Per Capita Income | 29,100 | $24,786 |
| Median Family Income | 6,021 | $53,493 |
| Mean Family Income | 6,021 | $70,823 |
| Median Household Income | 11,536 | $42,424 |
| Mean Household Income | 11,536 | $58,467 |
| Income Deficit | 6,021 | $11,597 |
| Wage / Income Gap (%) | 29,100 | 27.56% |
| Wage / Income Gap ($) | 29,100 | 72.44¢ per $1 |
| Gini / Inequality Index | 29,100 | 0.47 |
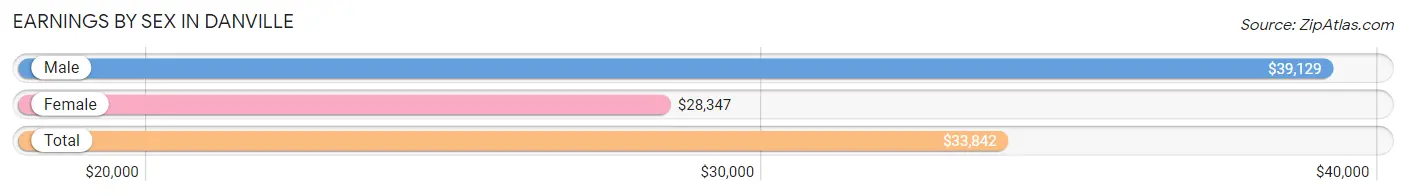
Earnings by Sex in Danville
Average Earnings in Danville are $33,842, $39,129 for men and $28,347 for women, a difference of 27.6%.
| Sex | Number | Average Earnings |
| Male | 5,612 (48.1%) | $39,129 |
| Female | 6,052 (51.9%) | $28,347 |
| Total | 11,664 (100.0%) | $33,842 |
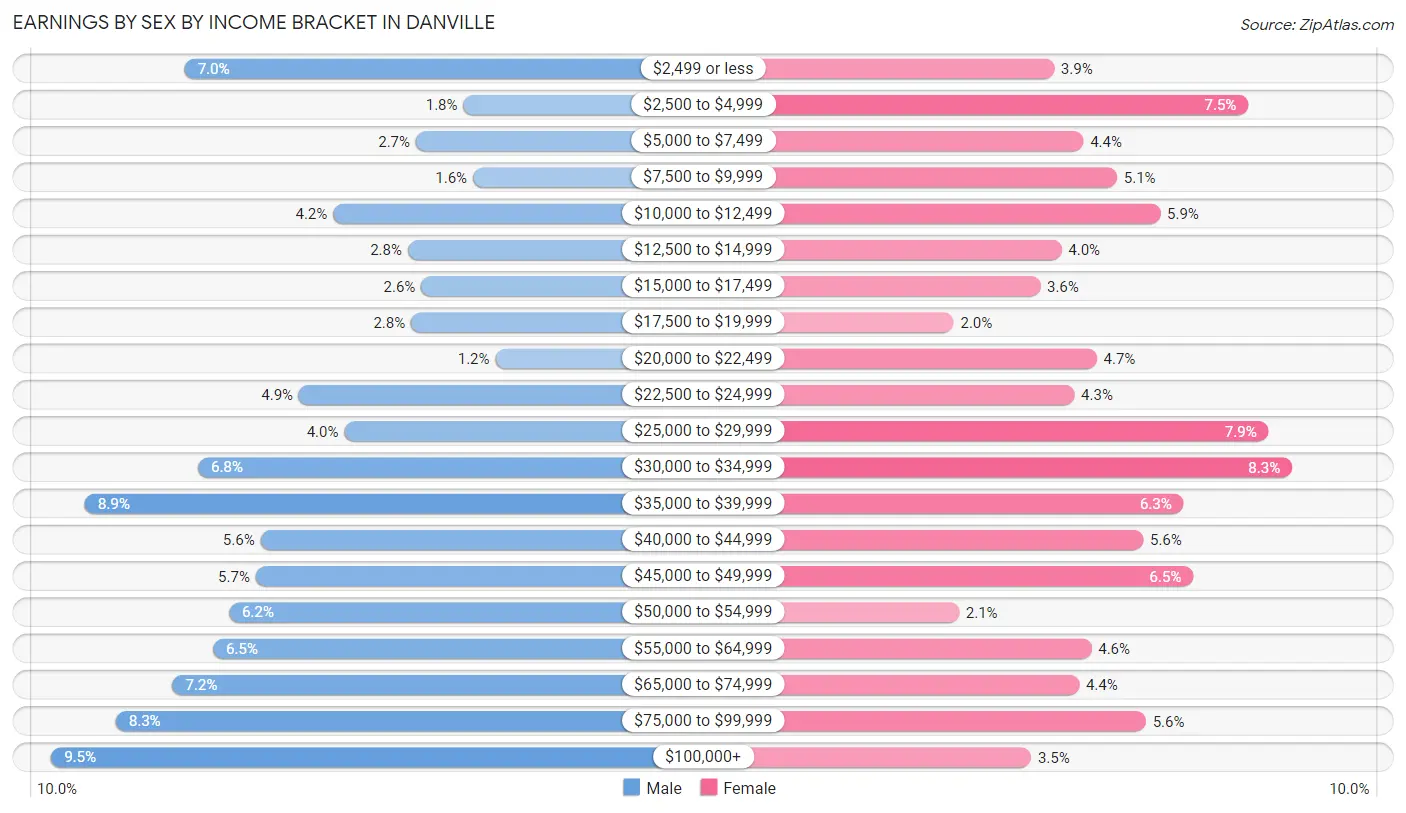
Earnings by Sex by Income Bracket in Danville
The most common earnings brackets in Danville are $100,000+ for men (533 | 9.5%) and $30,000 to $34,999 for women (505 | 8.3%).
| Income | Male | Female |
| $2,499 or less | 393 (7.0%) | 235 (3.9%) |
| $2,500 to $4,999 | 100 (1.8%) | 455 (7.5%) |
| $5,000 to $7,499 | 150 (2.7%) | 268 (4.4%) |
| $7,500 to $9,999 | 90 (1.6%) | 306 (5.1%) |
| $10,000 to $12,499 | 237 (4.2%) | 355 (5.9%) |
| $12,500 to $14,999 | 158 (2.8%) | 243 (4.0%) |
| $15,000 to $17,499 | 144 (2.6%) | 219 (3.6%) |
| $17,500 to $19,999 | 155 (2.8%) | 121 (2.0%) |
| $20,000 to $22,499 | 66 (1.2%) | 283 (4.7%) |
| $22,500 to $24,999 | 273 (4.9%) | 258 (4.3%) |
| $25,000 to $29,999 | 225 (4.0%) | 478 (7.9%) |
| $30,000 to $34,999 | 379 (6.8%) | 505 (8.3%) |
| $35,000 to $39,999 | 498 (8.9%) | 382 (6.3%) |
| $40,000 to $44,999 | 313 (5.6%) | 336 (5.6%) |
| $45,000 to $49,999 | 318 (5.7%) | 393 (6.5%) |
| $50,000 to $54,999 | 346 (6.2%) | 127 (2.1%) |
| $55,000 to $64,999 | 363 (6.5%) | 277 (4.6%) |
| $65,000 to $74,999 | 406 (7.2%) | 263 (4.3%) |
| $75,000 to $99,999 | 465 (8.3%) | 339 (5.6%) |
| $100,000+ | 533 (9.5%) | 209 (3.5%) |
| Total | 5,612 (100.0%) | 6,052 (100.0%) |
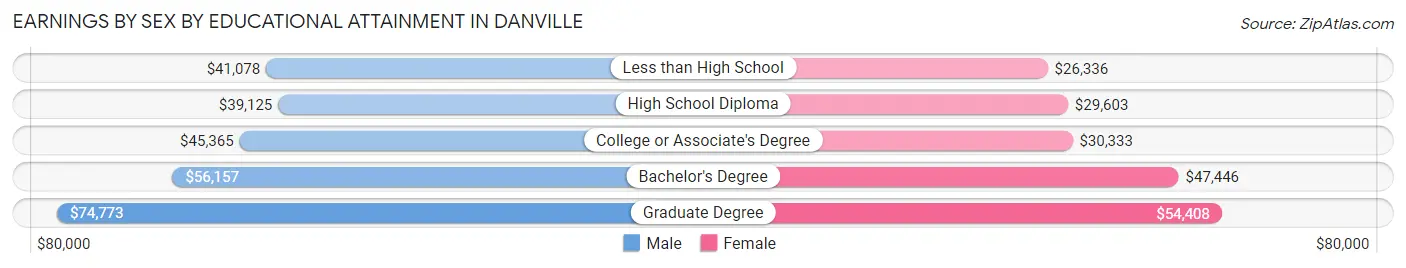
Earnings by Sex by Educational Attainment in Danville
Average earnings in Danville are $44,898 for men and $31,470 for women, a difference of 29.9%. Men with an educational attainment of graduate degree enjoy the highest average annual earnings of $74,773, while those with high school diploma education earn the least with $39,125. Women with an educational attainment of graduate degree earn the most with the average annual earnings of $54,408, while those with less than high school education have the smallest earnings of $26,336.
| Educational Attainment | Male Income | Female Income |
| Less than High School | $41,078 | $26,336 |
| High School Diploma | $39,125 | $29,603 |
| College or Associate's Degree | $45,365 | $30,333 |
| Bachelor's Degree | $56,157 | $47,446 |
| Graduate Degree | $74,773 | $54,408 |
| Total | $44,898 | $31,470 |
Family Income in Danville
Family Income Brackets in Danville
According to the Danville family income data, there are 1,096 families falling into the $50,000 to $74,999 income range, which is the most common income bracket and makes up 18.2% of all families. Conversely, the $200,000+ income bracket is the least frequent group with only 181 families (3.0%) belonging to this category.
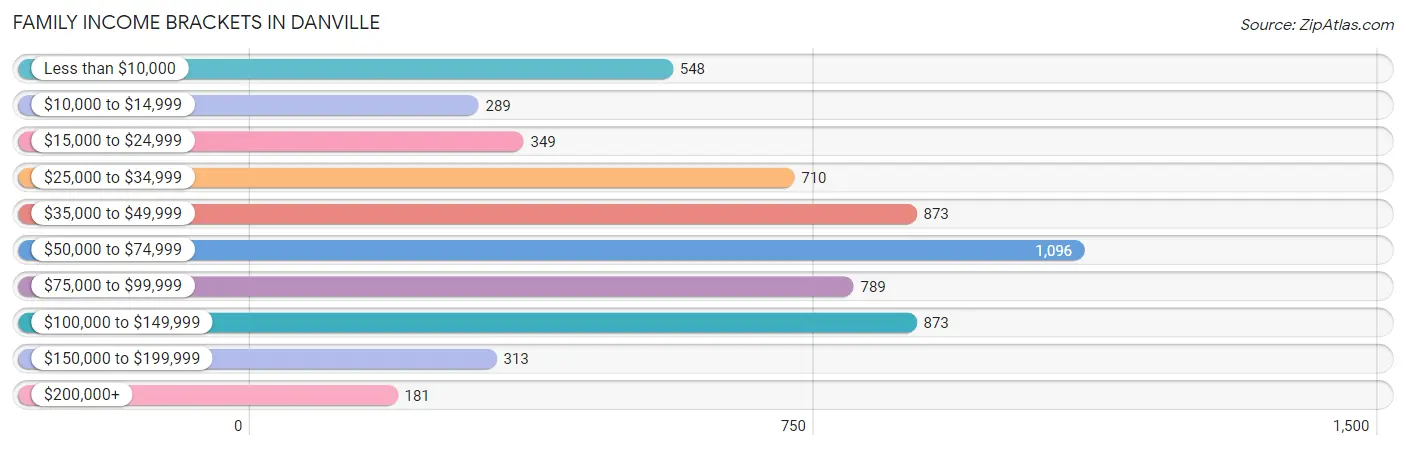
| Income Bracket | # Families | % Families |
| Less than $10,000 | 548 | 9.1% |
| $10,000 to $14,999 | 289 | 4.8% |
| $15,000 to $24,999 | 349 | 5.8% |
| $25,000 to $34,999 | 710 | 11.8% |
| $35,000 to $49,999 | 873 | 14.5% |
| $50,000 to $74,999 | 1,096 | 18.2% |
| $75,000 to $99,999 | 789 | 13.1% |
| $100,000 to $149,999 | 873 | 14.5% |
| $150,000 to $199,999 | 313 | 5.2% |
| $200,000+ | 181 | 3.0% |
Family Income by Famaliy Size in Danville
6-person families (115 | 1.9%) account for the highest median family income in Danville with $81,964 per family, while 2-person families (2,972 | 49.4%) have the highest median income of $27,750 per family member.
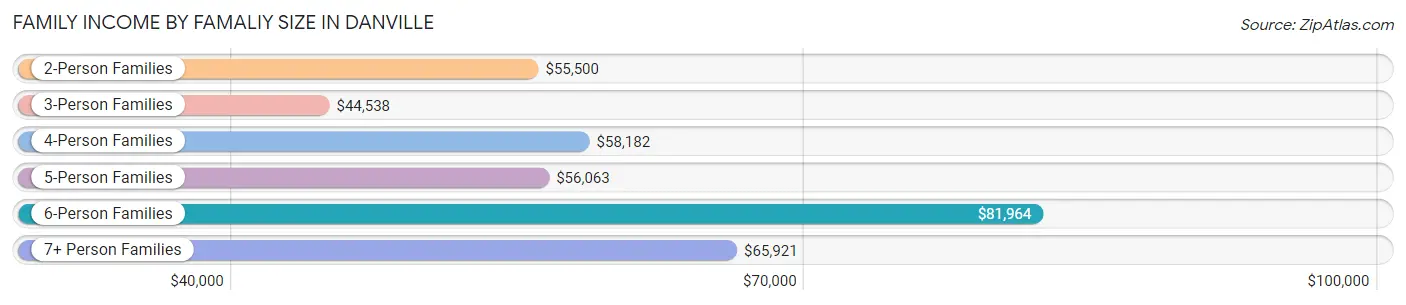
| Income Bracket | # Families | Median Income |
| 2-Person Families | 2,972 (49.4%) | $55,500 |
| 3-Person Families | 1,554 (25.8%) | $44,538 |
| 4-Person Families | 922 (15.3%) | $58,182 |
| 5-Person Families | 358 (5.9%) | $56,063 |
| 6-Person Families | 115 (1.9%) | $81,964 |
| 7+ Person Families | 100 (1.7%) | $65,921 |
| Total | 6,021 (100.0%) | $53,493 |
Family Income by Number of Earners in Danville
The median family income in Danville is $53,493, with families comprising 3+ earners (320) having the highest median family income of $138,864, while families with no earners (1,333) have the lowest median family income of $33,438, accounting for 5.3% and 22.1% of families, respectively.
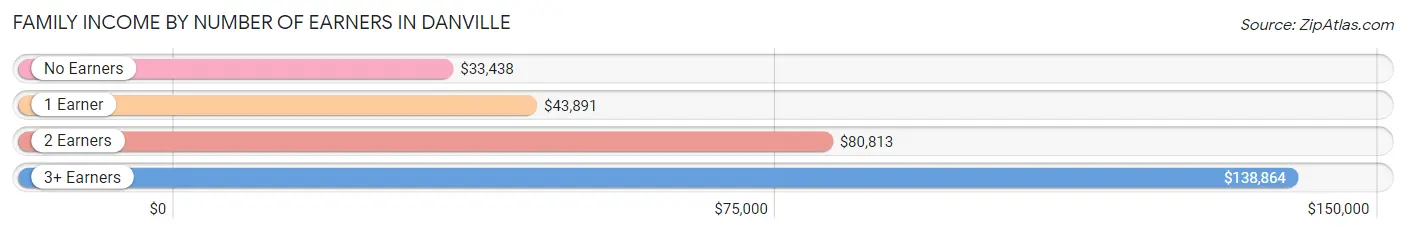
| Number of Earners | # Families | Median Income |
| No Earners | 1,333 (22.1%) | $33,438 |
| 1 Earner | 2,750 (45.7%) | $43,891 |
| 2 Earners | 1,618 (26.9%) | $80,813 |
| 3+ Earners | 320 (5.3%) | $138,864 |
| Total | 6,021 (100.0%) | $53,493 |
Household Income in Danville
Household Income Brackets in Danville
With 1,880 households falling in the category, the $50,000 to $74,999 income range is the most frequent in Danville, accounting for 16.3% of all households. In contrast, only 219 households (1.9%) fall into the $200,000+ income bracket, making it the least populous group.
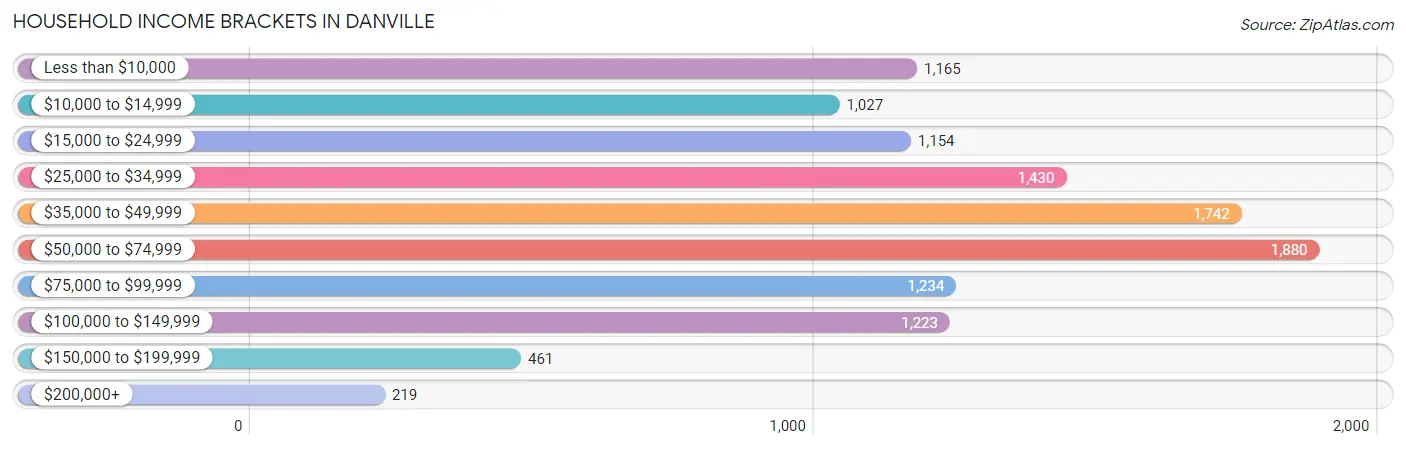
| Income Bracket | # Households | % Households |
| Less than $10,000 | 1,165 | 10.1% |
| $10,000 to $14,999 | 1,027 | 8.9% |
| $15,000 to $24,999 | 1,154 | 10.0% |
| $25,000 to $34,999 | 1,430 | 12.4% |
| $35,000 to $49,999 | 1,742 | 15.1% |
| $50,000 to $74,999 | 1,880 | 16.3% |
| $75,000 to $99,999 | 1,234 | 10.7% |
| $100,000 to $149,999 | 1,223 | 10.6% |
| $150,000 to $199,999 | 461 | 4.0% |
| $200,000+ | 219 | 1.9% |
Household Income by Householder Age in Danville
The median household income in Danville is $42,424, with the highest median household income of $50,327 found in the 45 to 64 years age bracket for the primary householder. A total of 3,974 households (34.4%) fall into this category. Meanwhile, the 15 to 24 years age bracket for the primary householder has the lowest median household income of $27,500, with 728 households (6.3%) in this group.
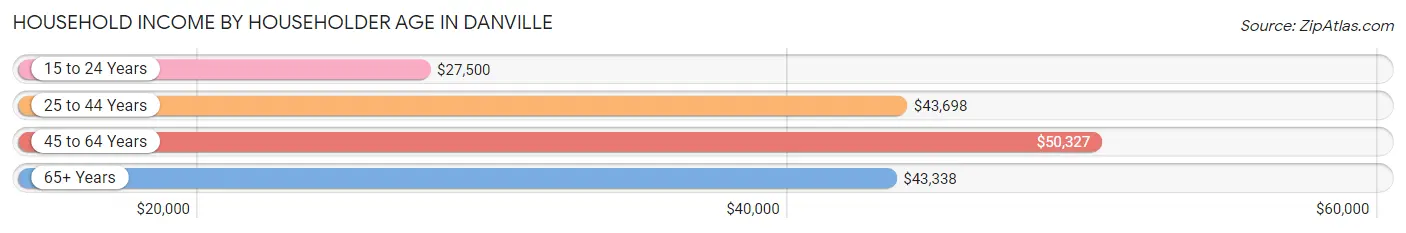
| Income Bracket | # Households | Median Income |
| 15 to 24 Years | 728 (6.3%) | $27,500 |
| 25 to 44 Years | 3,183 (27.6%) | $43,698 |
| 45 to 64 Years | 3,974 (34.4%) | $50,327 |
| 65+ Years | 3,651 (31.7%) | $43,338 |
| Total | 11,536 (100.0%) | $42,424 |
Poverty in Danville
Income Below Poverty by Sex and Age in Danville
With 24.8% poverty level for males and 25.9% for females among the residents of Danville, 6 to 11 year old males and 15 year old females are the most vulnerable to poverty, with 597 males (53.2%) and 132 females (48.5%) in their respective age groups living below the poverty level.
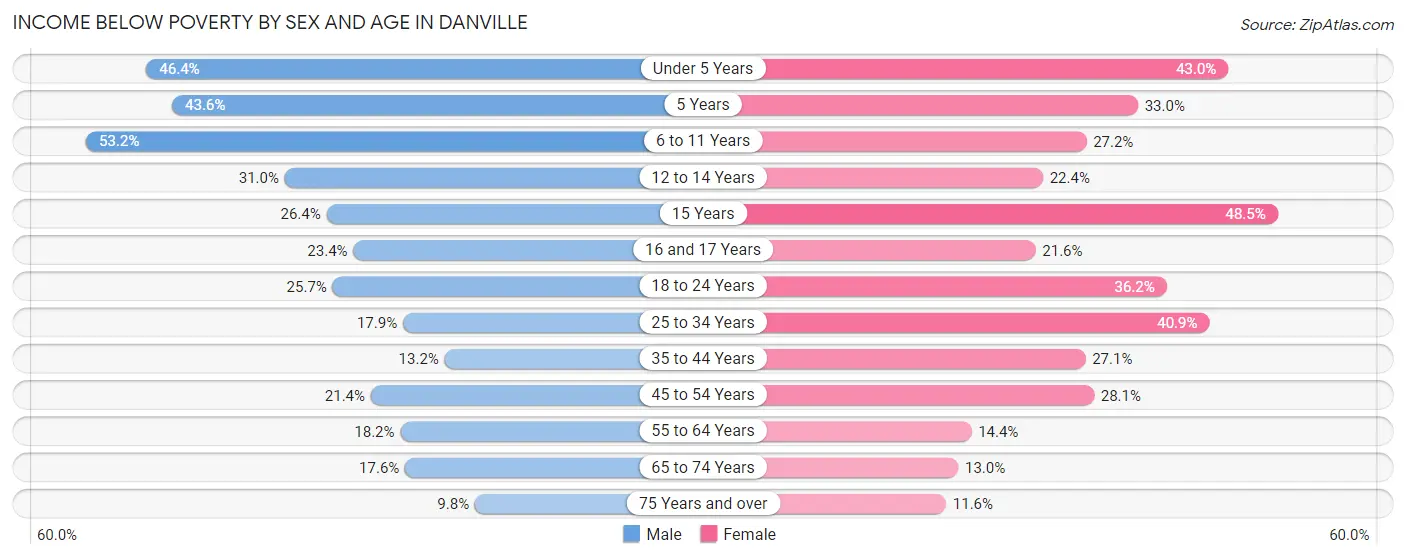
| Age Bracket | Male | Female |
| Under 5 Years | 462 (46.4%) | 327 (43.0%) |
| 5 Years | 105 (43.6%) | 59 (33.0%) |
| 6 to 11 Years | 597 (53.2%) | 267 (27.2%) |
| 12 to 14 Years | 206 (31.0%) | 130 (22.4%) |
| 15 Years | 53 (26.4%) | 132 (48.5%) |
| 16 and 17 Years | 76 (23.4%) | 69 (21.6%) |
| 18 to 24 Years | 290 (25.7%) | 493 (36.2%) |
| 25 to 34 Years | 261 (17.9%) | 676 (40.9%) |
| 35 to 44 Years | 162 (13.2%) | 491 (27.1%) |
| 45 to 54 Years | 283 (21.4%) | 383 (28.1%) |
| 55 to 64 Years | 332 (18.1%) | 257 (14.4%) |
| 65 to 74 Years | 212 (17.6%) | 207 (13.0%) |
| 75 Years and over | 86 (9.8%) | 173 (11.6%) |
| Total | 3,125 (24.8%) | 3,664 (25.9%) |
Income Above Poverty by Sex and Age in Danville
According to the poverty statistics in Danville, males aged 75 years and over and females aged 75 years and over are the age groups that are most secure financially, with 90.2% of males and 88.4% of females in these age groups living above the poverty line.
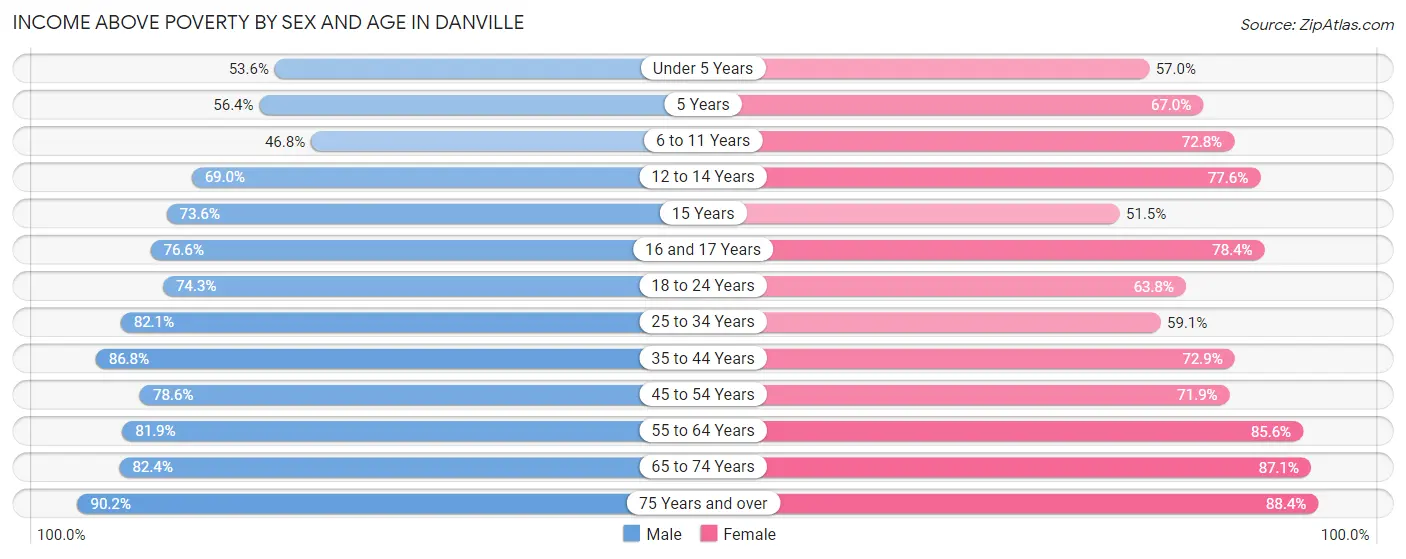
| Age Bracket | Male | Female |
| Under 5 Years | 533 (53.6%) | 433 (57.0%) |
| 5 Years | 136 (56.4%) | 120 (67.0%) |
| 6 to 11 Years | 526 (46.8%) | 714 (72.8%) |
| 12 to 14 Years | 458 (69.0%) | 451 (77.6%) |
| 15 Years | 148 (73.6%) | 140 (51.5%) |
| 16 and 17 Years | 249 (76.6%) | 251 (78.4%) |
| 18 to 24 Years | 839 (74.3%) | 870 (63.8%) |
| 25 to 34 Years | 1,200 (82.1%) | 976 (59.1%) |
| 35 to 44 Years | 1,063 (86.8%) | 1,320 (72.9%) |
| 45 to 54 Years | 1,037 (78.6%) | 982 (71.9%) |
| 55 to 64 Years | 1,497 (81.9%) | 1,526 (85.6%) |
| 65 to 74 Years | 991 (82.4%) | 1,392 (87.1%) |
| 75 Years and over | 788 (90.2%) | 1,320 (88.4%) |
| Total | 9,465 (75.2%) | 10,495 (74.1%) |
Income Below Poverty Among Married-Couple Families in Danville
The poverty statistics for married-couple families in Danville show that 7.6% or 239 of the total 3,151 families live below the poverty line. Families with 5 or more children have the highest poverty rate of 45.0%, comprising of 9 families. On the other hand, families with no children have the lowest poverty rate of 6.2%, which includes 128 families.
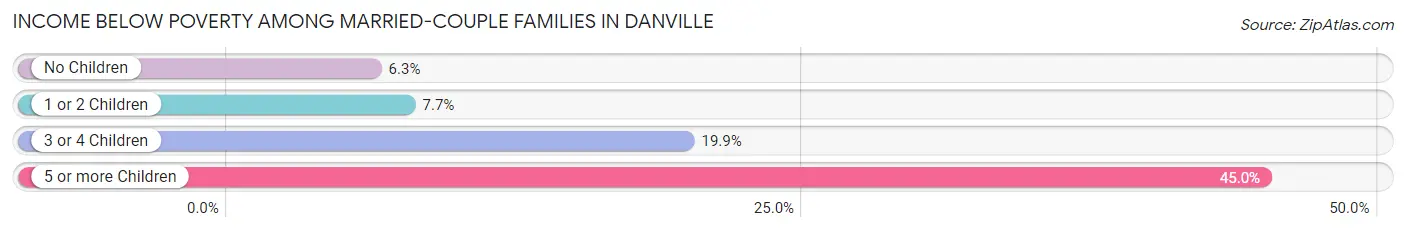
| Children | Above Poverty | Below Poverty |
| No Children | 1,920 (93.8%) | 128 (6.2%) |
| 1 or 2 Children | 860 (92.3%) | 72 (7.7%) |
| 3 or 4 Children | 121 (80.1%) | 30 (19.9%) |
| 5 or more Children | 11 (55.0%) | 9 (45.0%) |
| Total | 2,912 (92.4%) | 239 (7.6%) |
Income Below Poverty Among Single-Parent Households in Danville
According to the poverty data in Danville, 22.1% or 135 single-father households and 37.3% or 842 single-mother households are living below the poverty line. Among single-father households, those with 3 or 4 children have the highest poverty rate, with 33 households (100.0%) experiencing poverty. Likewise, among single-mother households, those with 3 or 4 children have the highest poverty rate, with 280 households (72.9%) falling below the poverty line.
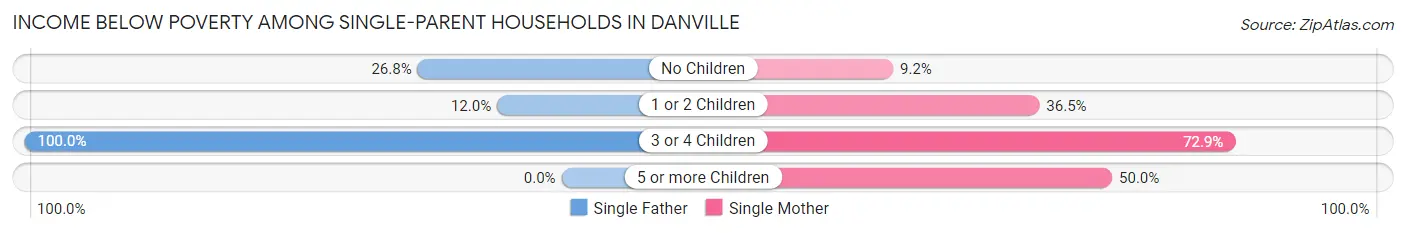
| Children | Single Father | Single Mother |
| No Children | 59 (26.8%) | 43 (9.2%) |
| 1 or 2 Children | 43 (12.0%) | 498 (36.5%) |
| 3 or 4 Children | 33 (100.0%) | 280 (72.9%) |
| 5 or more Children | 0 (0.0%) | 21 (50.0%) |
| Total | 135 (22.1%) | 842 (37.3%) |
Income Below Poverty Among Married-Couple vs Single-Parent Households in Danville
The poverty data for Danville shows that 239 of the married-couple family households (7.6%) and 977 of the single-parent households (34.0%) are living below the poverty level. Within the married-couple family households, those with 5 or more children have the highest poverty rate, with 9 households (45.0%) falling below the poverty line. Among the single-parent households, those with 3 or 4 children have the highest poverty rate, with 313 household (75.1%) living below poverty.
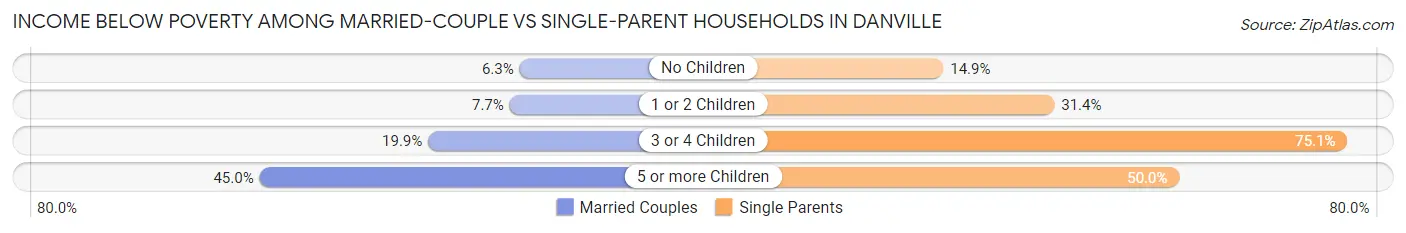
| Children | Married-Couple Families | Single-Parent Households |
| No Children | 128 (6.2%) | 102 (14.8%) |
| 1 or 2 Children | 72 (7.7%) | 541 (31.4%) |
| 3 or 4 Children | 30 (19.9%) | 313 (75.1%) |
| 5 or more Children | 9 (45.0%) | 21 (50.0%) |
| Total | 239 (7.6%) | 977 (34.0%) |
Race in Danville
The most populous races in Danville are White / Caucasian (17,053 | 58.6%), Black / African American (9,627 | 33.1%), and Hispanic or Latino (2,330 | 8.0%).
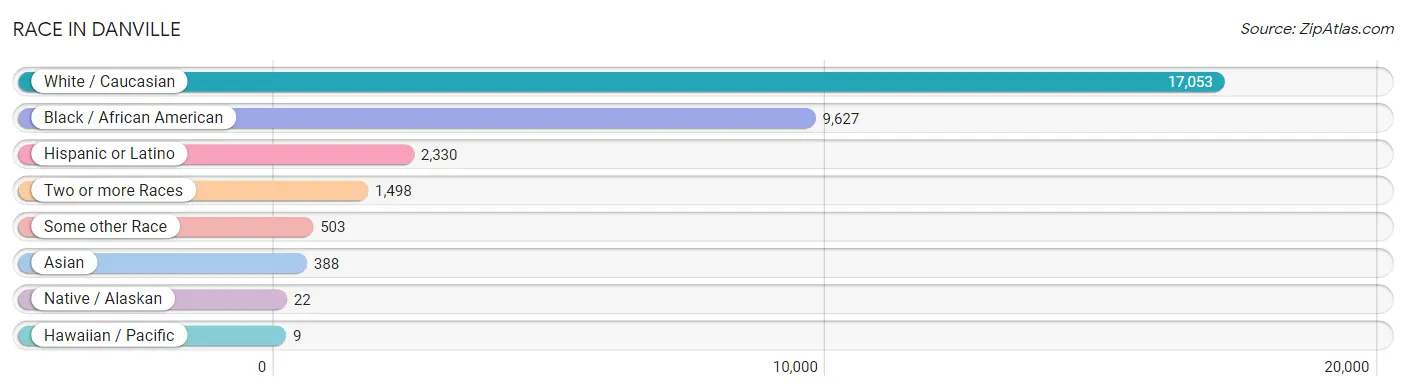
| Race | # Population | % Population |
| Asian | 388 | 1.3% |
| Black / African American | 9,627 | 33.1% |
| Hawaiian / Pacific | 9 | 0.0% |
| Hispanic or Latino | 2,330 | 8.0% |
| Native / Alaskan | 22 | 0.1% |
| White / Caucasian | 17,053 | 58.6% |
| Two or more Races | 1,498 | 5.1% |
| Some other Race | 503 | 1.7% |
| Total | 29,100 | 100.0% |
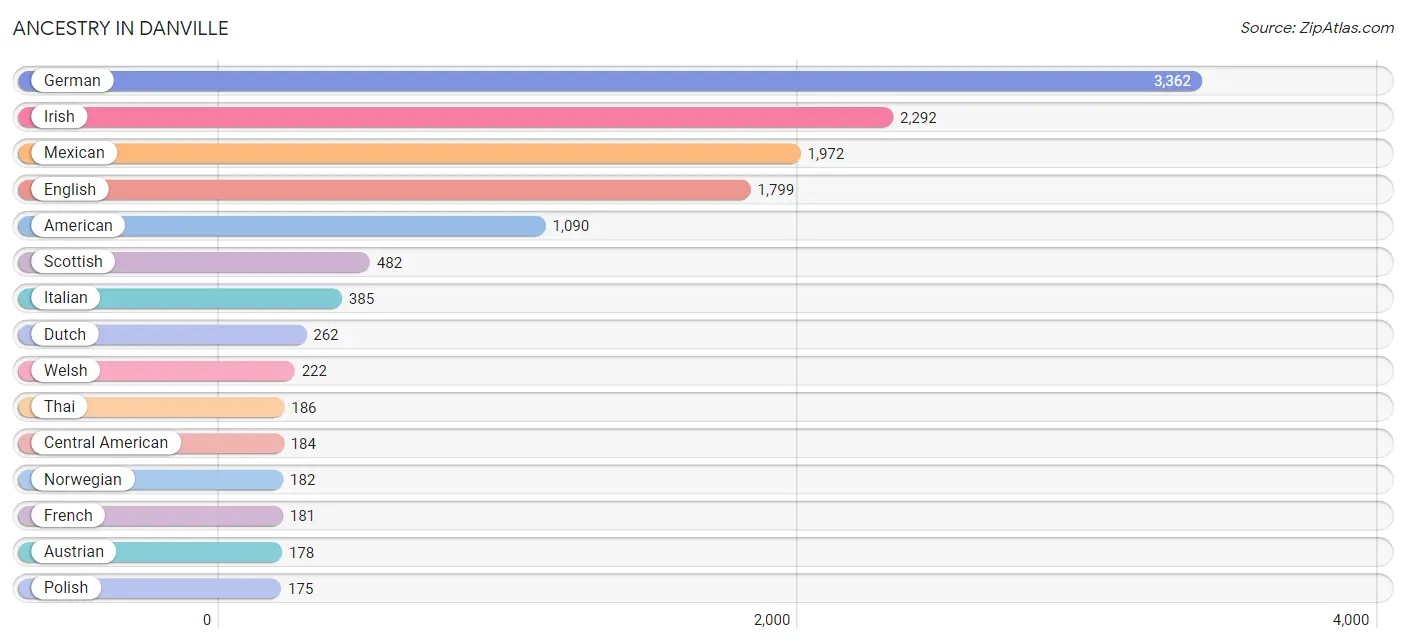
Ancestry in Danville
The most populous ancestries reported in Danville are German (3,362 | 11.6%), Irish (2,292 | 7.9%), Mexican (1,972 | 6.8%), English (1,799 | 6.2%), and American (1,090 | 3.7%), together accounting for 36.1% of all Danville residents.
| Ancestry | # Population | % Population |
| African | 79 | 0.3% |
| American | 1,090 | 3.7% |
| Arab | 84 | 0.3% |
| Australian | 8 | 0.0% |
| Austrian | 178 | 0.6% |
| Belgian | 33 | 0.1% |
| Bhutanese | 17 | 0.1% |
| Blackfeet | 34 | 0.1% |
| British | 47 | 0.2% |
| Burmese | 24 | 0.1% |
| Canadian | 9 | 0.0% |
| Central American | 184 | 0.6% |
| Central American Indian | 15 | 0.1% |
| Cherokee | 39 | 0.1% |
| Colombian | 6 | 0.0% |
| Croatian | 7 | 0.0% |
| Cuban | 20 | 0.1% |
| Czech | 14 | 0.1% |
| Czechoslovakian | 11 | 0.0% |
| Danish | 10 | 0.0% |
| Dutch | 262 | 0.9% |
| Eastern European | 24 | 0.1% |
| English | 1,799 | 6.2% |
| European | 155 | 0.5% |
| French | 181 | 0.6% |
| French Canadian | 11 | 0.0% |
| German | 3,362 | 11.6% |
| Guatemalan | 158 | 0.5% |
| Hungarian | 29 | 0.1% |
| Indian (Asian) | 26 | 0.1% |
| Irish | 2,292 | 7.9% |
| Italian | 385 | 1.3% |
| Korean | 50 | 0.2% |
| Lithuanian | 28 | 0.1% |
| Mexican | 1,972 | 6.8% |
| Native Hawaiian | 22 | 0.1% |
| Nigerian | 8 | 0.0% |
| Northern European | 29 | 0.1% |
| Norwegian | 182 | 0.6% |
| Palestinian | 20 | 0.1% |
| Panamanian | 26 | 0.1% |
| Pennsylvania German | 7 | 0.0% |
| Peruvian | 6 | 0.0% |
| Polish | 175 | 0.6% |
| Puerto Rican | 115 | 0.4% |
| Russian | 9 | 0.0% |
| Samoan | 18 | 0.1% |
| Scandinavian | 168 | 0.6% |
| Scotch-Irish | 173 | 0.6% |
| Scottish | 482 | 1.7% |
| Sioux | 34 | 0.1% |
| Slavic | 8 | 0.0% |
| Slovak | 17 | 0.1% |
| South American | 19 | 0.1% |
| Spanish | 5 | 0.0% |
| Sri Lankan | 100 | 0.3% |
| Subsaharan African | 87 | 0.3% |
| Swedish | 173 | 0.6% |
| Syrian | 44 | 0.2% |
| Thai | 186 | 0.6% |
| Ukrainian | 48 | 0.2% |
| Venezuelan | 7 | 0.0% |
| Welsh | 222 | 0.8% | View All 63 Rows |
Immigrants in Danville
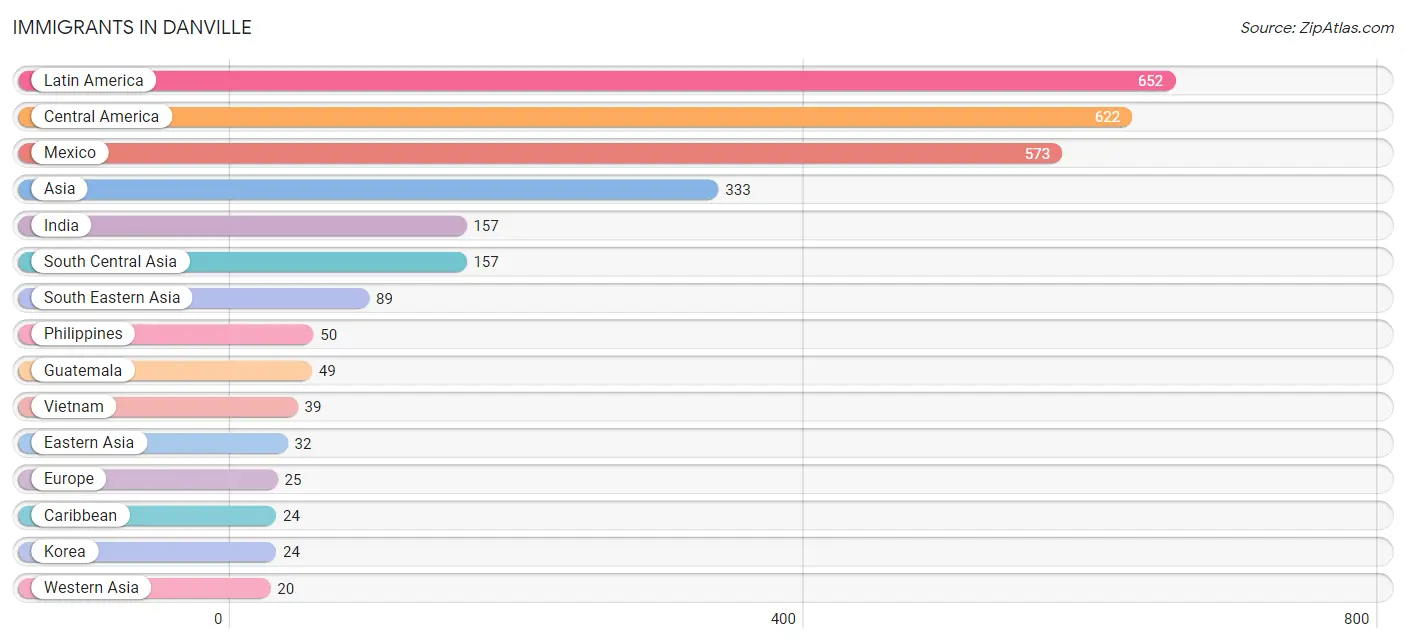
The most numerous immigrant groups reported in Danville came from Latin America (652 | 2.2%), Central America (622 | 2.1%), Mexico (573 | 2.0%), Asia (333 | 1.1%), and India (157 | 0.5%), together accounting for 8.0% of all Danville residents.
| Immigration Origin | # Population | % Population |
| Africa | 15 | 0.1% |
| Asia | 333 | 1.1% |
| Canada | 9 | 0.0% |
| Caribbean | 24 | 0.1% |
| Central America | 622 | 2.1% |
| Cuba | 13 | 0.0% |
| Czechoslovakia | 10 | 0.0% |
| Eastern Asia | 32 | 0.1% |
| Eastern Europe | 10 | 0.0% |
| Europe | 25 | 0.1% |
| Guatemala | 49 | 0.2% |
| India | 157 | 0.5% |
| Ireland | 9 | 0.0% |
| Japan | 8 | 0.0% |
| Korea | 24 | 0.1% |
| Latin America | 652 | 2.2% |
| Mexico | 573 | 2.0% |
| Middle Africa | 7 | 0.0% |
| Nigeria | 8 | 0.0% |
| Northern Europe | 15 | 0.1% |
| Peru | 6 | 0.0% |
| Philippines | 50 | 0.2% |
| South America | 6 | 0.0% |
| South Central Asia | 157 | 0.5% |
| South Eastern Asia | 89 | 0.3% |
| Vietnam | 39 | 0.1% |
| Western Africa | 8 | 0.0% |
| Western Asia | 20 | 0.1% |
| Yemen | 20 | 0.1% |
| Zaire | 7 | 0.0% | View All 30 Rows |
Sex and Age in Danville
Sex and Age in Danville
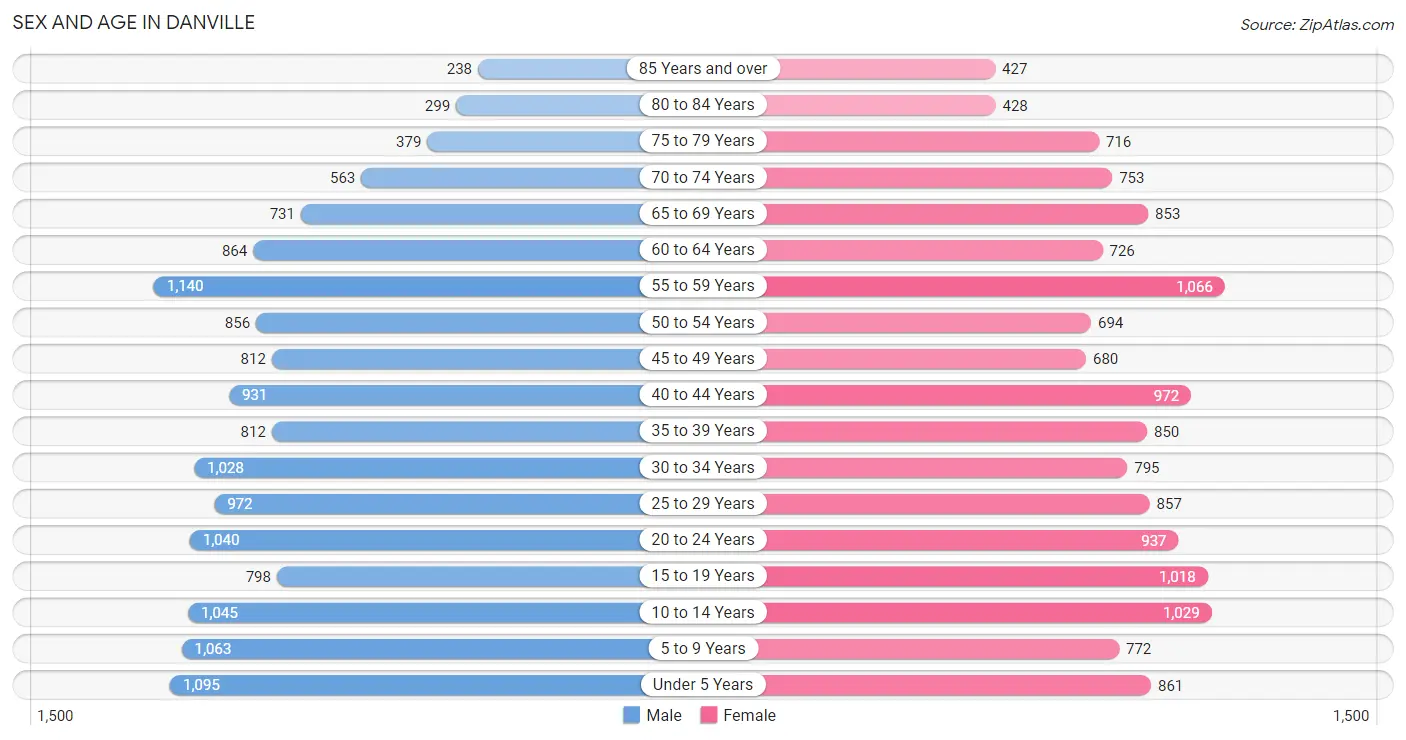
The most populous age groups in Danville are 55 to 59 Years (1,140 | 7.8%) for men and 55 to 59 Years (1,066 | 7.4%) for women.
| Age Bracket | Male | Female |
| Under 5 Years | 1,095 (7.5%) | 861 (6.0%) |
| 5 to 9 Years | 1,063 (7.2%) | 772 (5.3%) |
| 10 to 14 Years | 1,045 (7.1%) | 1,029 (7.1%) |
| 15 to 19 Years | 798 (5.4%) | 1,018 (7.0%) |
| 20 to 24 Years | 1,040 (7.1%) | 937 (6.5%) |
| 25 to 29 Years | 972 (6.6%) | 857 (5.9%) |
| 30 to 34 Years | 1,028 (7.0%) | 795 (5.5%) |
| 35 to 39 Years | 812 (5.5%) | 850 (5.9%) |
| 40 to 44 Years | 931 (6.4%) | 972 (6.7%) |
| 45 to 49 Years | 812 (5.5%) | 680 (4.7%) |
| 50 to 54 Years | 856 (5.8%) | 694 (4.8%) |
| 55 to 59 Years | 1,140 (7.8%) | 1,066 (7.4%) |
| 60 to 64 Years | 864 (5.9%) | 726 (5.0%) |
| 65 to 69 Years | 731 (5.0%) | 853 (5.9%) |
| 70 to 74 Years | 563 (3.8%) | 753 (5.2%) |
| 75 to 79 Years | 379 (2.6%) | 716 (5.0%) |
| 80 to 84 Years | 299 (2.0%) | 428 (3.0%) |
| 85 Years and over | 238 (1.6%) | 427 (3.0%) |
| Total | 14,666 (100.0%) | 14,434 (100.0%) |
Families and Households in Danville
Median Family Size in Danville
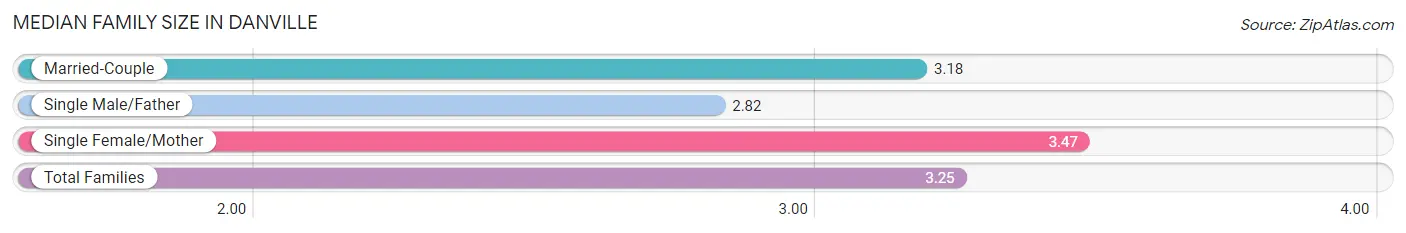
The median family size in Danville is 3.25 persons per family, with single female/mother families (2,259 | 37.5%) accounting for the largest median family size of 3.47 persons per family. On the other hand, single male/father families (611 | 10.2%) represent the smallest median family size with 2.82 persons per family.
| Family Type | # Families | Family Size |
| Married-Couple | 3,151 (52.3%) | 3.18 |
| Single Male/Father | 611 (10.2%) | 2.82 |
| Single Female/Mother | 2,259 (37.5%) | 3.47 |
| Total Families | 6,021 (100.0%) | 3.25 |
Median Household Size in Danville
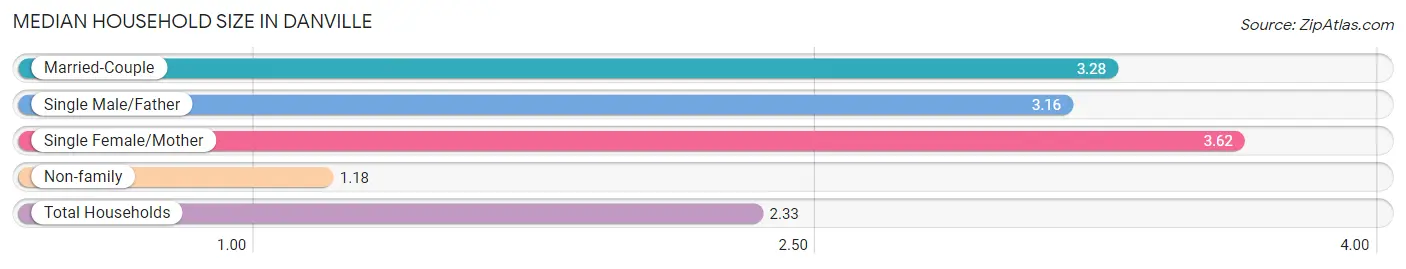
The median household size in Danville is 2.33 persons per household, with single female/mother households (2,259 | 19.6%) accounting for the largest median household size of 3.62 persons per household. non-family households (5,515 | 47.8%) represent the smallest median household size with 1.18 persons per household.
| Household Type | # Households | Household Size |
| Married-Couple | 3,151 (27.3%) | 3.28 |
| Single Male/Father | 611 (5.3%) | 3.16 |
| Single Female/Mother | 2,259 (19.6%) | 3.62 |
| Non-family | 5,515 (47.8%) | 1.18 |
| Total Households | 11,536 (100.0%) | 2.33 |
Household Size by Marriage Status in Danville
Out of a total of 11,536 households in Danville, 6,021 (52.2%) are family households, while 5,515 (47.8%) are nonfamily households. The most numerous type of family households are 2-person households, comprising 2,744, and the most common type of nonfamily households are 1-person households, comprising 4,955.
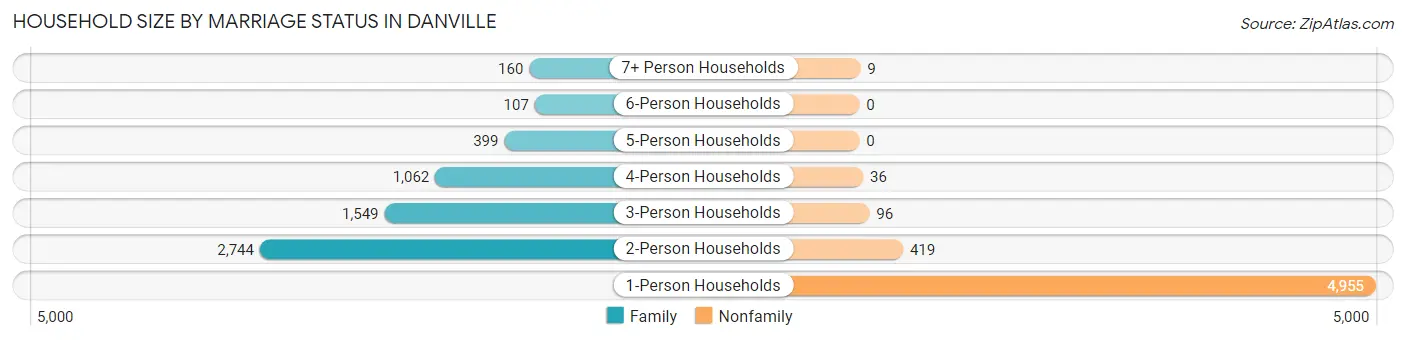
| Household Size | Family Households | Nonfamily Households |
| 1-Person Households | - | 4,955 (42.9%) |
| 2-Person Households | 2,744 (23.8%) | 419 (3.6%) |
| 3-Person Households | 1,549 (13.4%) | 96 (0.8%) |
| 4-Person Households | 1,062 (9.2%) | 36 (0.3%) |
| 5-Person Households | 399 (3.5%) | 0 (0.0%) |
| 6-Person Households | 107 (0.9%) | 0 (0.0%) |
| 7+ Person Households | 160 (1.4%) | 9 (0.1%) |
| Total | 6,021 (52.2%) | 5,515 (47.8%) |
Female Fertility in Danville
Fertility by Age in Danville
Average fertility rate in Danville is 37.0 births per 1,000 women. Women in the age bracket of 20 to 34 years have the highest fertility rate with 65.0 births per 1,000 women. Women in the age bracket of 20 to 34 years acount for 72.0% of all women with births.
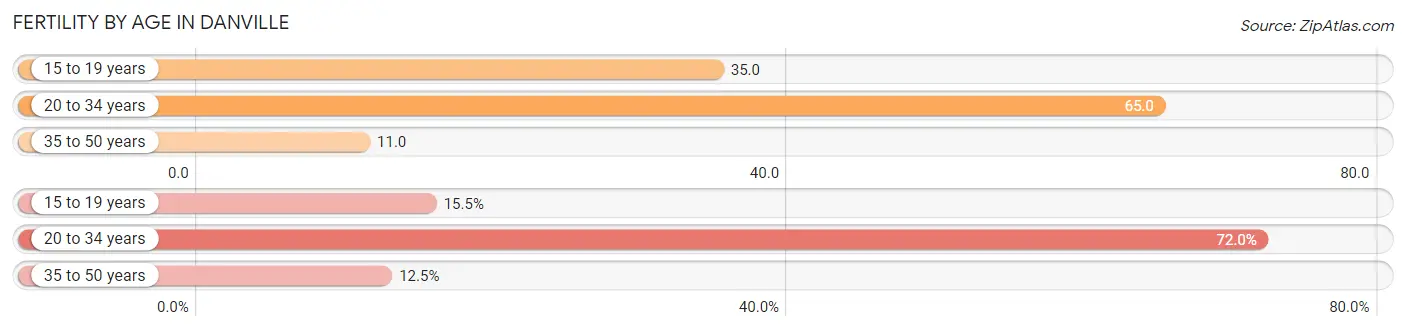
| Age Bracket | Women with Births | Births / 1,000 Women |
| 15 to 19 years | 36 (15.5%) | 35.0 |
| 20 to 34 years | 167 (72.0%) | 65.0 |
| 35 to 50 years | 29 (12.5%) | 11.0 |
| Total | 232 (100.0%) | 37.0 |
Fertility by Age by Marriage Status in Danville
17.7% of women with births (232) in Danville are married. The highest percentage of unmarried women with births falls into 15 to 19 years age bracket with 100.0% of them unmarried at the time of birth, while the lowest percentage of unmarried women with births belong to 20 to 34 years age bracket with 75.4% of them unmarried.
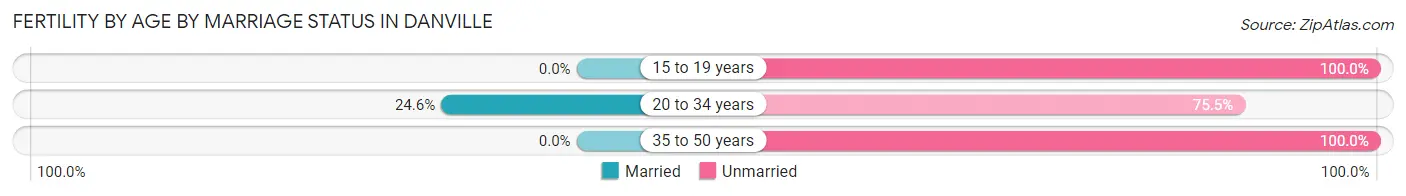
| Age Bracket | Married | Unmarried |
| 15 to 19 years | 0 (0.0%) | 36 (100.0%) |
| 20 to 34 years | 41 (24.5%) | 126 (75.4%) |
| 35 to 50 years | 0 (0.0%) | 29 (100.0%) |
| Total | 41 (17.7%) | 191 (82.3%) |
Fertility by Education in Danville
Average fertility rate in Danville is 37.0 births per 1,000 women. Women with the education attainment of graduate degree have the highest fertility rate of 50.0 births per 1,000 women, while women with the education attainment of less than high school have the lowest fertility at 10.0 births per 1,000 women. Women with the education attainment of high school diploma represent 45.3% of all women with births.
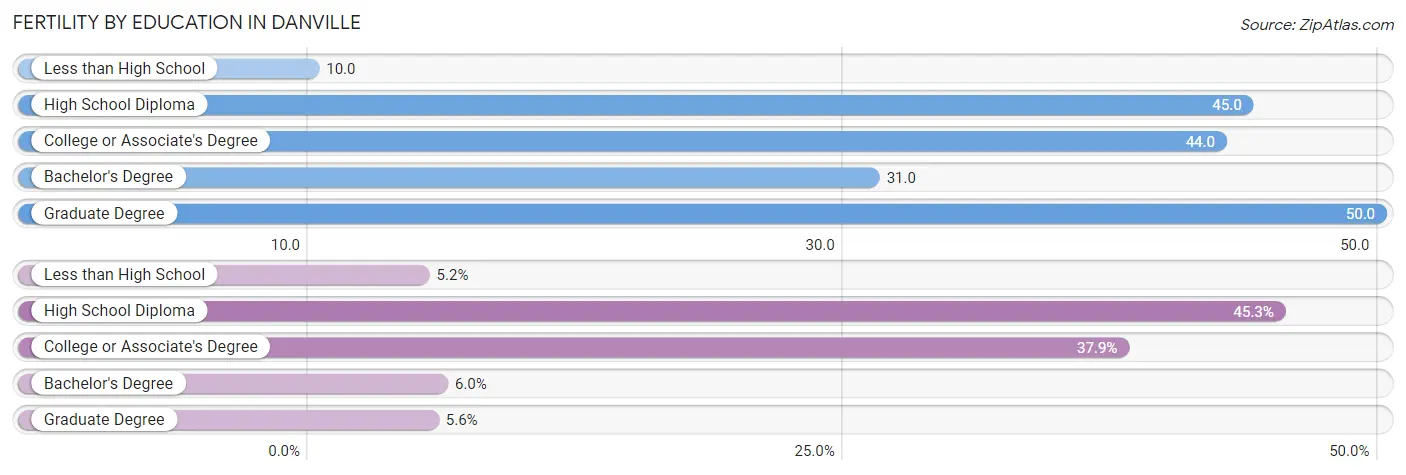
| Educational Attainment | Women with Births | Births / 1,000 Women |
| Less than High School | 12 (5.2%) | 10.0 |
| High School Diploma | 105 (45.3%) | 45.0 |
| College or Associate's Degree | 88 (37.9%) | 44.0 |
| Bachelor's Degree | 14 (6.0%) | 31.0 |
| Graduate Degree | 13 (5.6%) | 50.0 |
| Total | 232 (100.0%) | 37.0 |
Fertility by Education by Marriage Status in Danville
82.3% of women with births in Danville are unmarried. Women with the educational attainment of bachelor's degree are most likely to be married with 100.0% of them married at childbirth, while women with the educational attainment of less than high school are least likely to be married with 100.0% of them unmarried at childbirth.
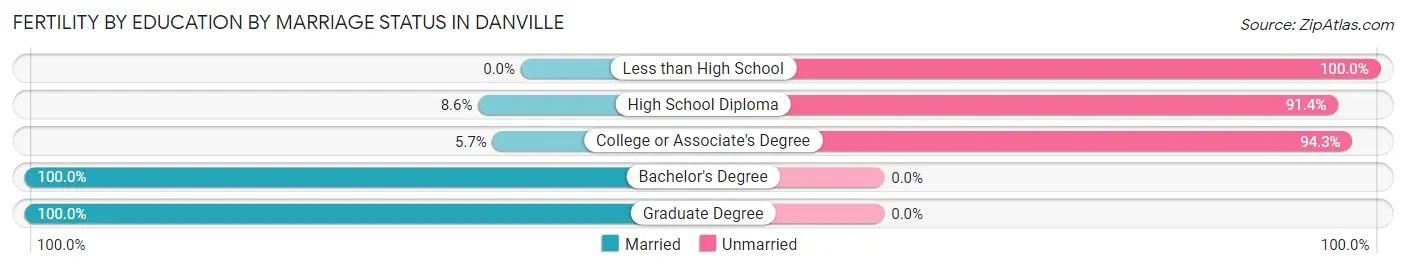
| Educational Attainment | Married | Unmarried |
| Less than High School | 0 (0.0%) | 12 (100.0%) |
| High School Diploma | 9 (8.6%) | 96 (91.4%) |
| College or Associate's Degree | 5 (5.7%) | 83 (94.3%) |
| Bachelor's Degree | 14 (100.0%) | 0 (0.0%) |
| Graduate Degree | 13 (100.0%) | 0 (0.0%) |
| Total | 41 (17.7%) | 191 (82.3%) |
Employment Characteristics in Danville
Employment by Class of Employer in Danville
Among the 10,199 employed individuals in Danville, private company employees (6,865 | 67.3%), not-for-profit organizations (849 | 8.3%), and self-employed (not incorporated) (802 | 7.9%) make up the most common classes of employment.
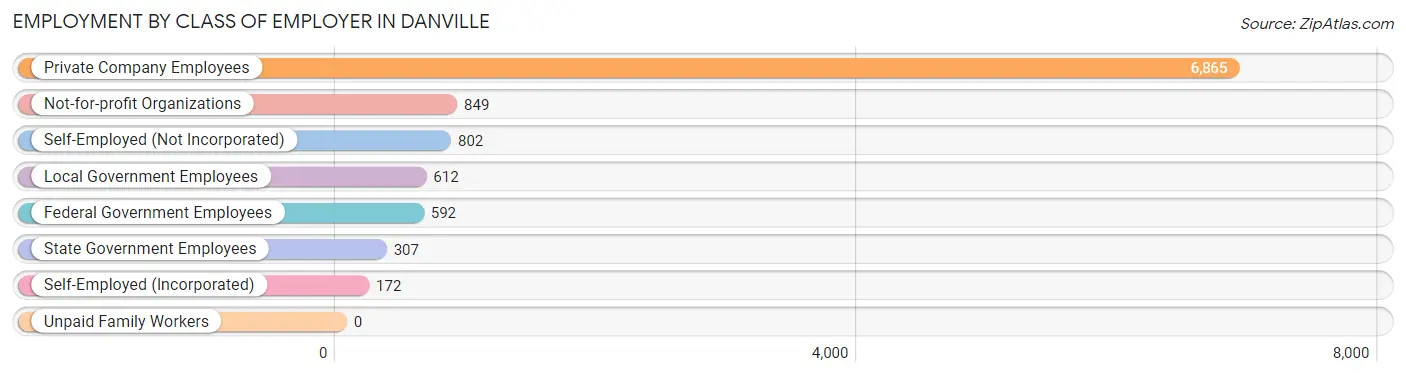
| Employer Class | # Employees | % Employees |
| Private Company Employees | 6,865 | 67.3% |
| Self-Employed (Incorporated) | 172 | 1.7% |
| Self-Employed (Not Incorporated) | 802 | 7.9% |
| Not-for-profit Organizations | 849 | 8.3% |
| Local Government Employees | 612 | 6.0% |
| State Government Employees | 307 | 3.0% |
| Federal Government Employees | 592 | 5.8% |
| Unpaid Family Workers | 0 | 0.0% |
| Total | 10,199 | 100.0% |
Employment Status by Age in Danville
According to the labor force statistics for Danville, out of the total population over 16 years of age (22,762), 50.4% or 11,472 individuals are in the labor force, with 9.2% or 1,055 of them unemployed. The age group with the highest labor force participation rate is 30 to 34 years, with 71.3% or 1,300 individuals in the labor force. Within the labor force, the 20 to 24 years age range has the highest percentage of unemployed individuals, with 27.2% or 352 of them being unemployed.
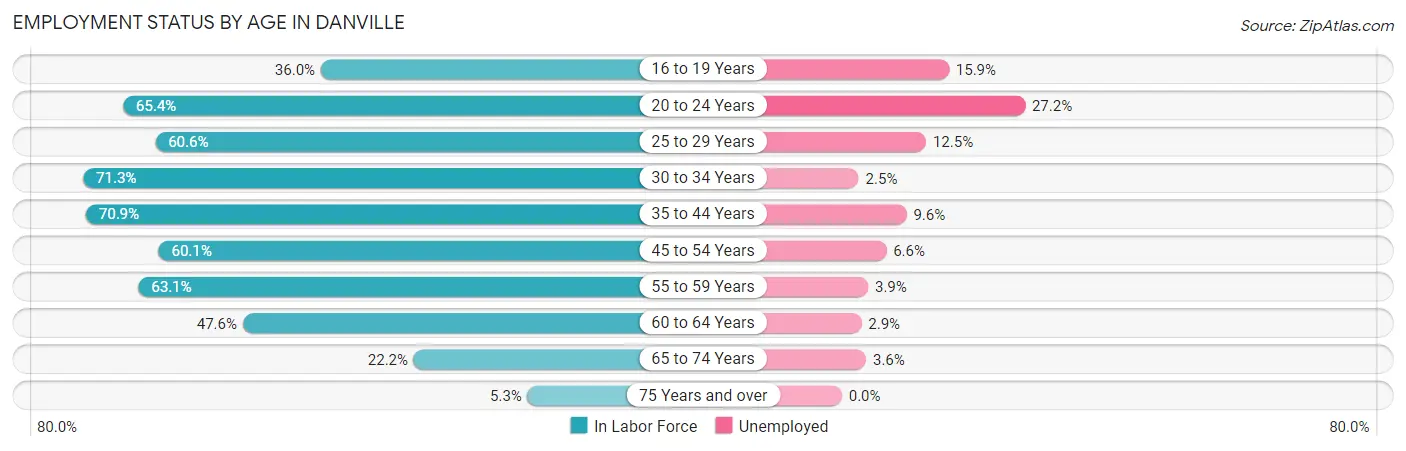
| Age Bracket | In Labor Force | Unemployed |
| 16 to 19 Years | 483 (36.0%) | 77 (15.9%) |
| 20 to 24 Years | 1,293 (65.4%) | 352 (27.2%) |
| 25 to 29 Years | 1,108 (60.6%) | 138 (12.5%) |
| 30 to 34 Years | 1,300 (71.3%) | 32 (2.5%) |
| 35 to 44 Years | 2,528 (70.9%) | 243 (9.6%) |
| 45 to 54 Years | 1,828 (60.1%) | 121 (6.6%) |
| 55 to 59 Years | 1,392 (63.1%) | 54 (3.9%) |
| 60 to 64 Years | 757 (47.6%) | 22 (2.9%) |
| 65 to 74 Years | 644 (22.2%) | 23 (3.6%) |
| 75 Years and over | 132 (5.3%) | 0 (0.0%) |
| Total | 11,472 (50.4%) | 1,055 (9.2%) |
Employment Status by Educational Attainment in Danville
According to labor force statistics for Danville, 63.4% of individuals (8,911) out of the total population between 25 and 64 years of age (14,055) are in the labor force, with 6.8% or 606 of them being unemployed. The group with the highest labor force participation rate are those with the educational attainment of bachelor's degree or higher, with 80.9% or 1,633 individuals in the labor force. Within the labor force, individuals with less than high school education have the highest percentage of unemployment, with 11.7% or 60 of them being unemployed.
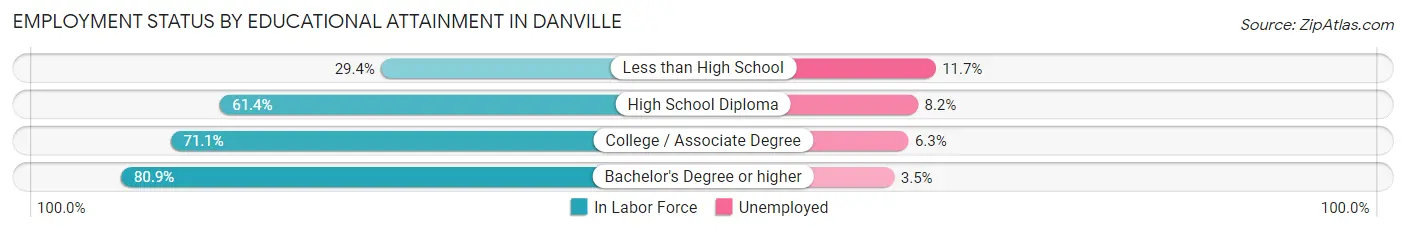
| Educational Attainment | In Labor Force | Unemployed |
| Less than High School | 511 (29.4%) | 203 (11.7%) |
| High School Diploma | 3,497 (61.4%) | 467 (8.2%) |
| College / Associate Degree | 3,274 (71.1%) | 290 (6.3%) |
| Bachelor's Degree or higher | 1,633 (80.9%) | 71 (3.5%) |
| Total | 8,911 (63.4%) | 956 (6.8%) |
Employment Occupations by Sex in Danville
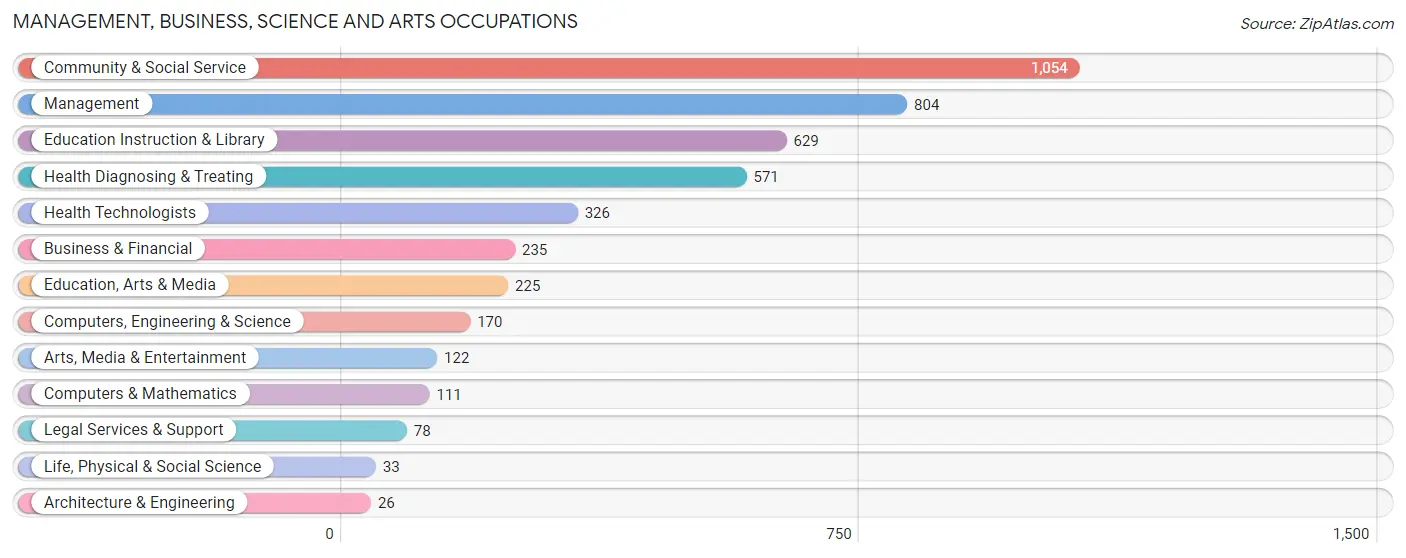
Management, Business, Science and Arts Occupations
The most common Management, Business, Science and Arts occupations in Danville are Community & Social Service (1,054 | 10.2%), Management (804 | 7.7%), Education Instruction & Library (629 | 6.1%), Health Diagnosing & Treating (571 | 5.5%), and Health Technologists (326 | 3.1%).
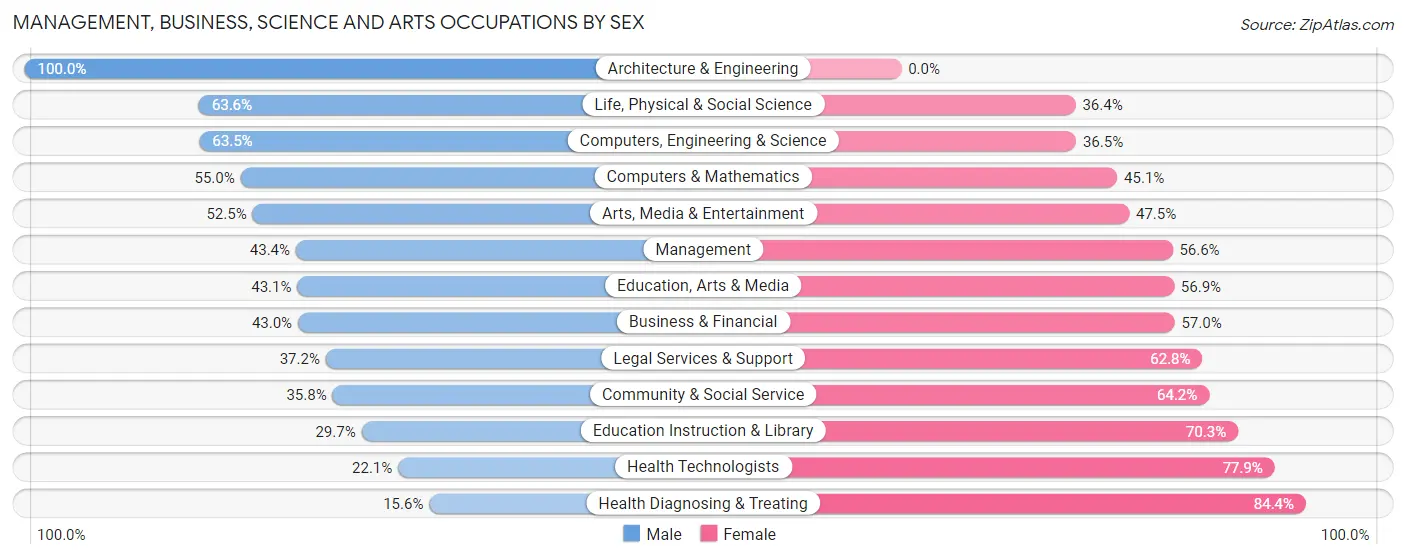
Management, Business, Science and Arts Occupations by Sex
Within the Management, Business, Science and Arts occupations in Danville, the most male-oriented occupations are Architecture & Engineering (100.0%), Life, Physical & Social Science (63.6%), and Computers, Engineering & Science (63.5%), while the most female-oriented occupations are Health Diagnosing & Treating (84.4%), Health Technologists (77.9%), and Education Instruction & Library (70.3%).
| Occupation | Male | Female |
| Management | 349 (43.4%) | 455 (56.6%) |
| Business & Financial | 101 (43.0%) | 134 (57.0%) |
| Computers, Engineering & Science | 108 (63.5%) | 62 (36.5%) |
| Computers & Mathematics | 61 (54.9%) | 50 (45.1%) |
| Architecture & Engineering | 26 (100.0%) | 0 (0.0%) |
| Life, Physical & Social Science | 21 (63.6%) | 12 (36.4%) |
| Community & Social Service | 377 (35.8%) | 677 (64.2%) |
| Education, Arts & Media | 97 (43.1%) | 128 (56.9%) |
| Legal Services & Support | 29 (37.2%) | 49 (62.8%) |
| Education Instruction & Library | 187 (29.7%) | 442 (70.3%) |
| Arts, Media & Entertainment | 64 (52.5%) | 58 (47.5%) |
| Health Diagnosing & Treating | 89 (15.6%) | 482 (84.4%) |
| Health Technologists | 72 (22.1%) | 254 (77.9%) |
| Total (Category) | 1,024 (36.1%) | 1,810 (63.9%) |
| Total (Overall) | 5,132 (49.4%) | 5,256 (50.6%) |
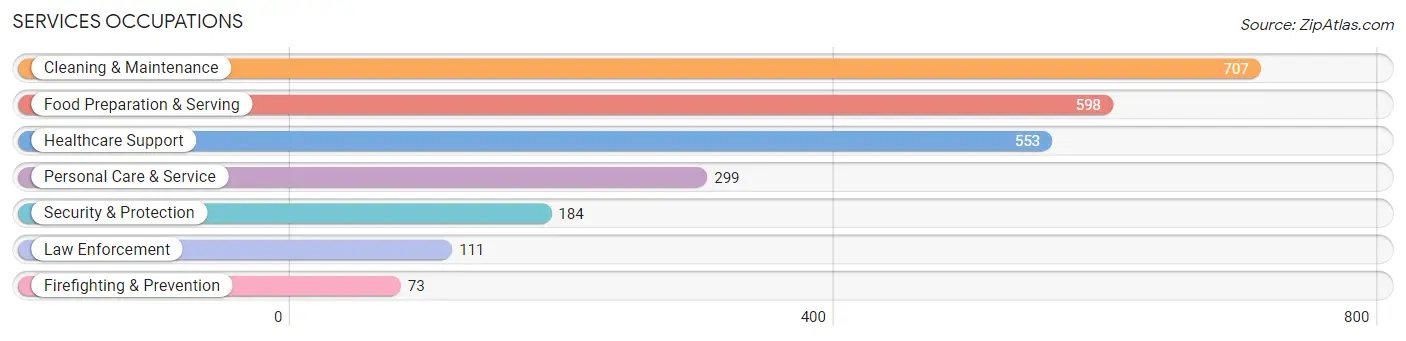
Services Occupations
The most common Services occupations in Danville are Cleaning & Maintenance (707 | 6.8%), Food Preparation & Serving (598 | 5.8%), Healthcare Support (553 | 5.3%), Personal Care & Service (299 | 2.9%), and Security & Protection (184 | 1.8%).
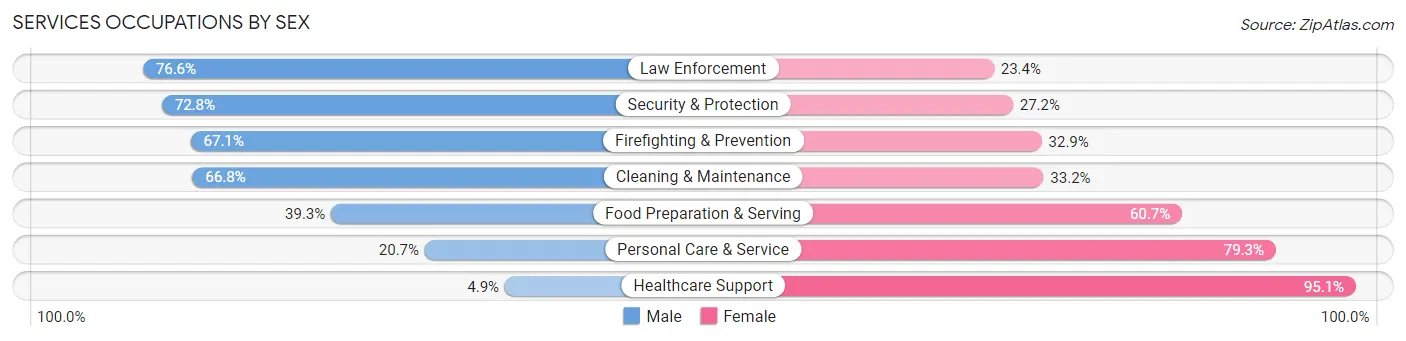
Services Occupations by Sex
Within the Services occupations in Danville, the most male-oriented occupations are Law Enforcement (76.6%), Security & Protection (72.8%), and Firefighting & Prevention (67.1%), while the most female-oriented occupations are Healthcare Support (95.1%), Personal Care & Service (79.3%), and Food Preparation & Serving (60.7%).
| Occupation | Male | Female |
| Healthcare Support | 27 (4.9%) | 526 (95.1%) |
| Security & Protection | 134 (72.8%) | 50 (27.2%) |
| Firefighting & Prevention | 49 (67.1%) | 24 (32.9%) |
| Law Enforcement | 85 (76.6%) | 26 (23.4%) |
| Food Preparation & Serving | 235 (39.3%) | 363 (60.7%) |
| Cleaning & Maintenance | 472 (66.8%) | 235 (33.2%) |
| Personal Care & Service | 62 (20.7%) | 237 (79.3%) |
| Total (Category) | 930 (39.7%) | 1,411 (60.3%) |
| Total (Overall) | 5,132 (49.4%) | 5,256 (50.6%) |
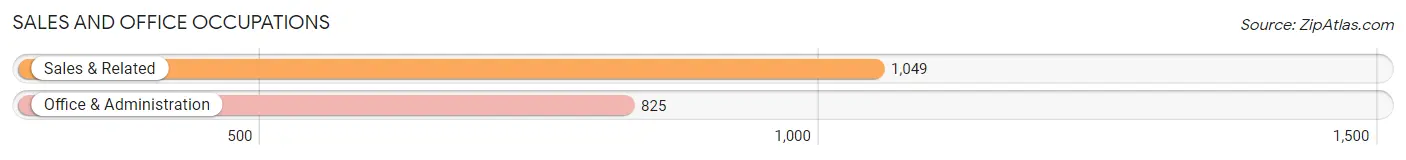
Sales and Office Occupations
The most common Sales and Office occupations in Danville are Sales & Related (1,049 | 10.1%), and Office & Administration (825 | 7.9%).
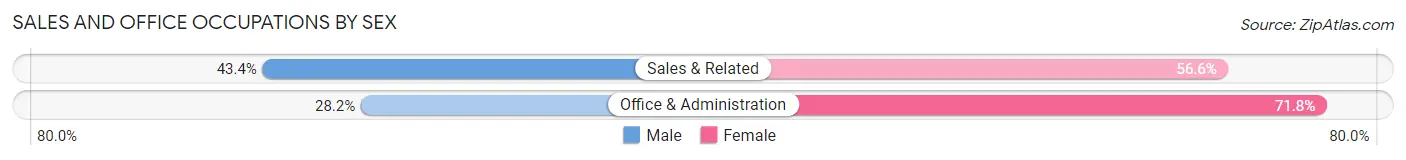
Sales and Office Occupations by Sex
| Occupation | Male | Female |
| Sales & Related | 455 (43.4%) | 594 (56.6%) |
| Office & Administration | 233 (28.2%) | 592 (71.8%) |
| Total (Category) | 688 (36.7%) | 1,186 (63.3%) |
| Total (Overall) | 5,132 (49.4%) | 5,256 (50.6%) |
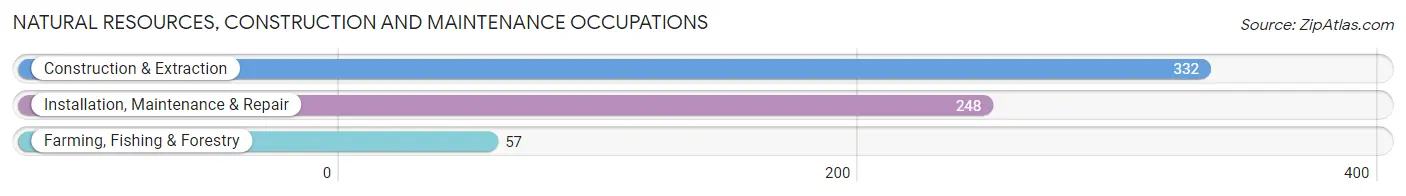
Natural Resources, Construction and Maintenance Occupations
The most common Natural Resources, Construction and Maintenance occupations in Danville are Construction & Extraction (332 | 3.2%), Installation, Maintenance & Repair (248 | 2.4%), and Farming, Fishing & Forestry (57 | 0.5%).
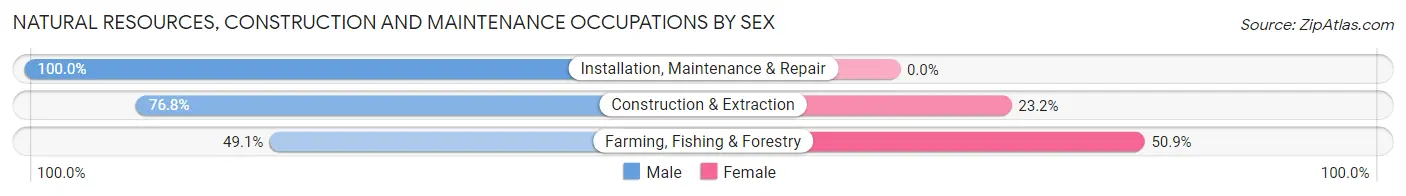
Natural Resources, Construction and Maintenance Occupations by Sex
| Occupation | Male | Female |
| Farming, Fishing & Forestry | 28 (49.1%) | 29 (50.9%) |
| Construction & Extraction | 255 (76.8%) | 77 (23.2%) |
| Installation, Maintenance & Repair | 248 (100.0%) | 0 (0.0%) |
| Total (Category) | 531 (83.4%) | 106 (16.6%) |
| Total (Overall) | 5,132 (49.4%) | 5,256 (50.6%) |
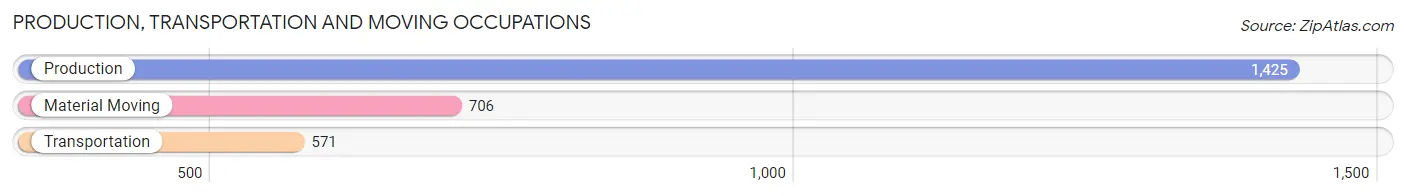
Production, Transportation and Moving Occupations
The most common Production, Transportation and Moving occupations in Danville are Production (1,425 | 13.7%), Material Moving (706 | 6.8%), and Transportation (571 | 5.5%).
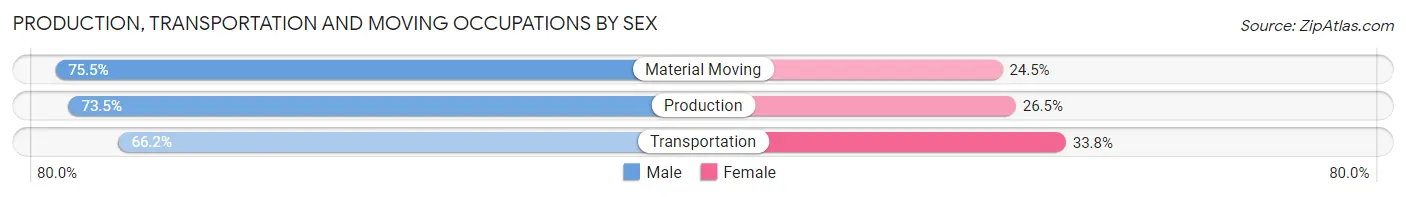
Production, Transportation and Moving Occupations by Sex
| Occupation | Male | Female |
| Production | 1,048 (73.5%) | 377 (26.5%) |
| Transportation | 378 (66.2%) | 193 (33.8%) |
| Material Moving | 533 (75.5%) | 173 (24.5%) |
| Total (Category) | 1,959 (72.5%) | 743 (27.5%) |
| Total (Overall) | 5,132 (49.4%) | 5,256 (50.6%) |
Employment Industries by Sex in Danville
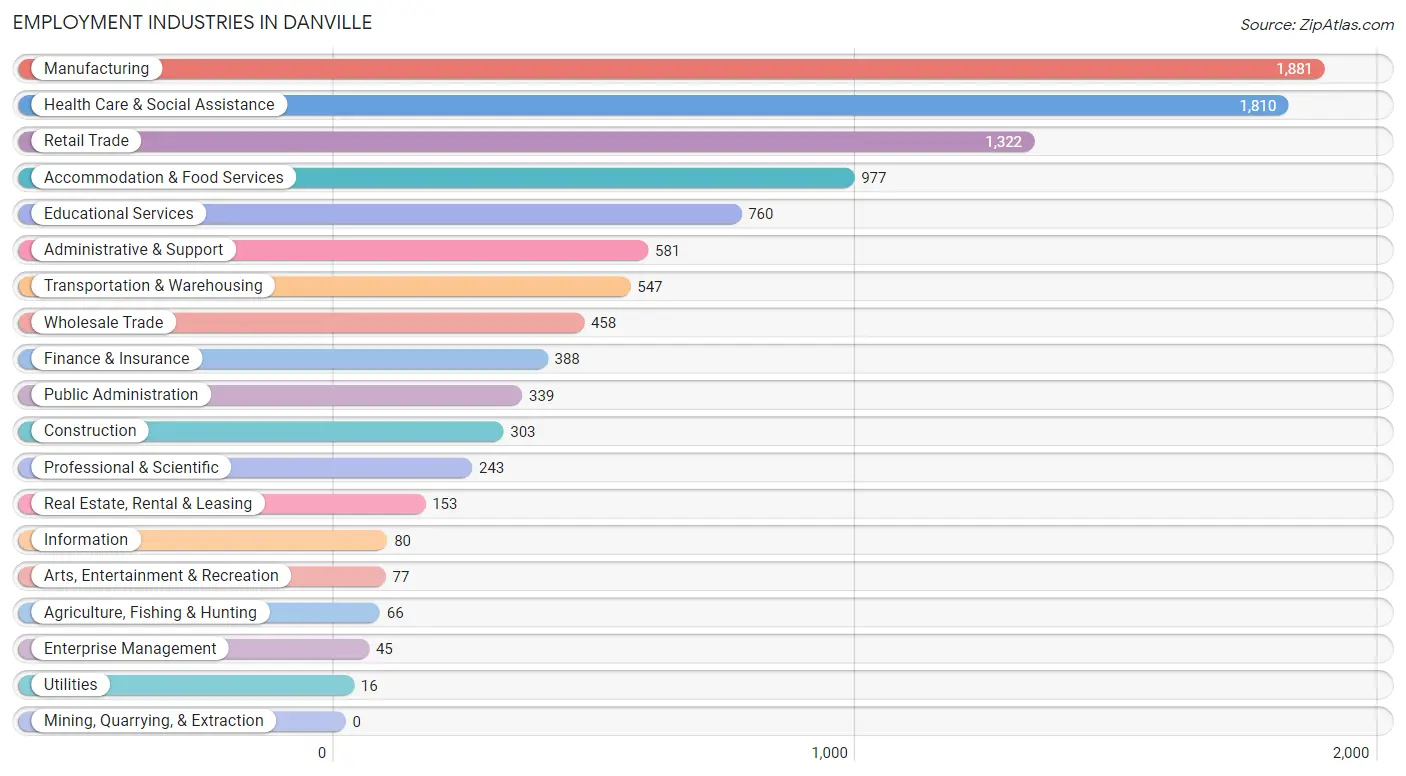
Employment Industries in Danville
The major employment industries in Danville include Manufacturing (1,881 | 18.1%), Health Care & Social Assistance (1,810 | 17.4%), Retail Trade (1,322 | 12.7%), Accommodation & Food Services (977 | 9.4%), and Educational Services (760 | 7.3%).
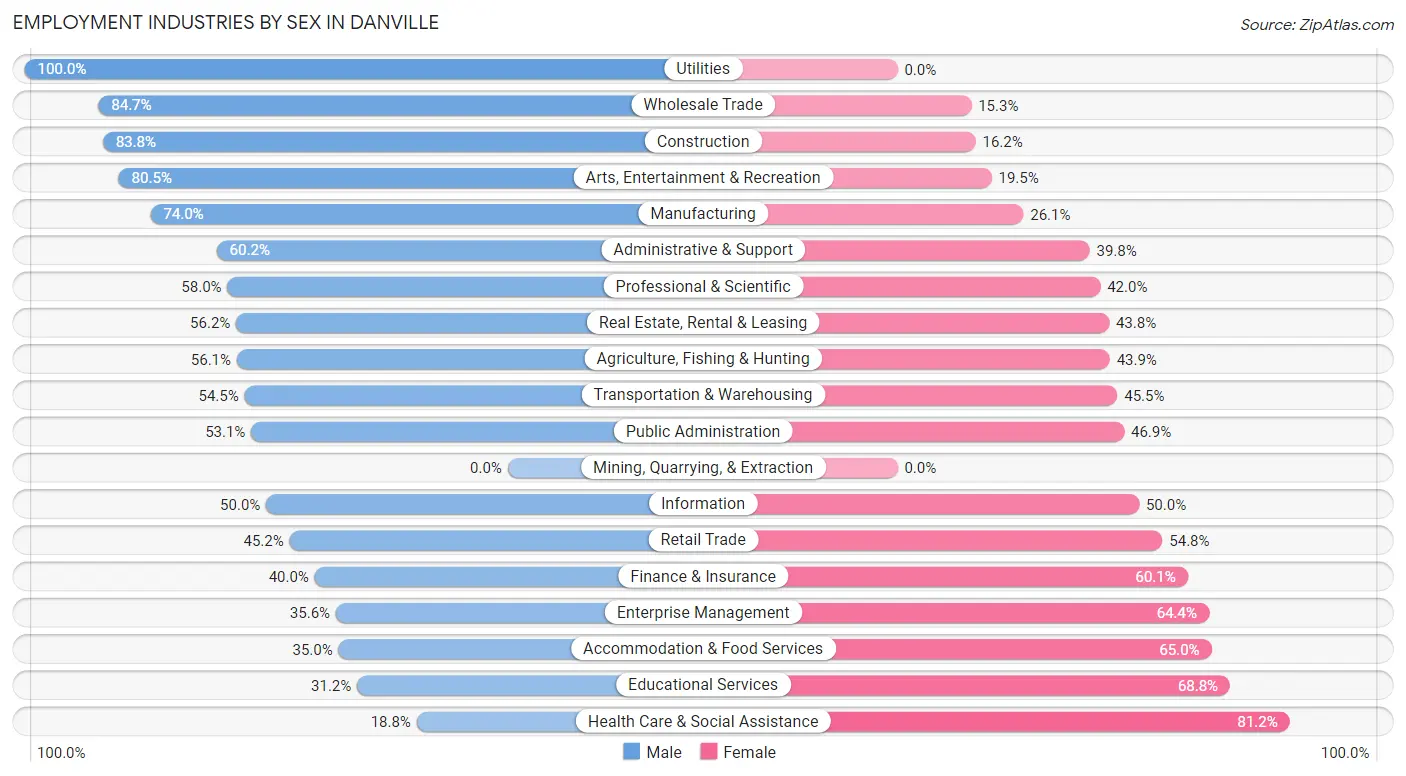
Employment Industries by Sex in Danville
The Danville industries that see more men than women are Utilities (100.0%), Wholesale Trade (84.7%), and Construction (83.8%), whereas the industries that tend to have a higher number of women are Health Care & Social Assistance (81.2%), Educational Services (68.8%), and Accommodation & Food Services (65.0%).
| Industry | Male | Female |
| Agriculture, Fishing & Hunting | 37 (56.1%) | 29 (43.9%) |
| Mining, Quarrying, & Extraction | 0 (0.0%) | 0 (0.0%) |
| Construction | 254 (83.8%) | 49 (16.2%) |
| Manufacturing | 1,391 (74.0%) | 490 (26.1%) |
| Wholesale Trade | 388 (84.7%) | 70 (15.3%) |
| Retail Trade | 597 (45.2%) | 725 (54.8%) |
| Transportation & Warehousing | 298 (54.5%) | 249 (45.5%) |
| Utilities | 16 (100.0%) | 0 (0.0%) |
| Information | 40 (50.0%) | 40 (50.0%) |
| Finance & Insurance | 155 (40.0%) | 233 (60.1%) |
| Real Estate, Rental & Leasing | 86 (56.2%) | 67 (43.8%) |
| Professional & Scientific | 141 (58.0%) | 102 (42.0%) |
| Enterprise Management | 16 (35.6%) | 29 (64.4%) |
| Administrative & Support | 350 (60.2%) | 231 (39.8%) |
| Educational Services | 237 (31.2%) | 523 (68.8%) |
| Health Care & Social Assistance | 341 (18.8%) | 1,469 (81.2%) |
| Arts, Entertainment & Recreation | 62 (80.5%) | 15 (19.5%) |
| Accommodation & Food Services | 342 (35.0%) | 635 (65.0%) |
| Public Administration | 180 (53.1%) | 159 (46.9%) |
| Total | 5,132 (49.4%) | 5,256 (50.6%) |
Education in Danville
School Enrollment in Danville
The most common levels of schooling among the 6,766 students in Danville are high school (1,541 | 22.8%), elementary school (1,531 | 22.6%), and middle school (1,528 | 22.6%).
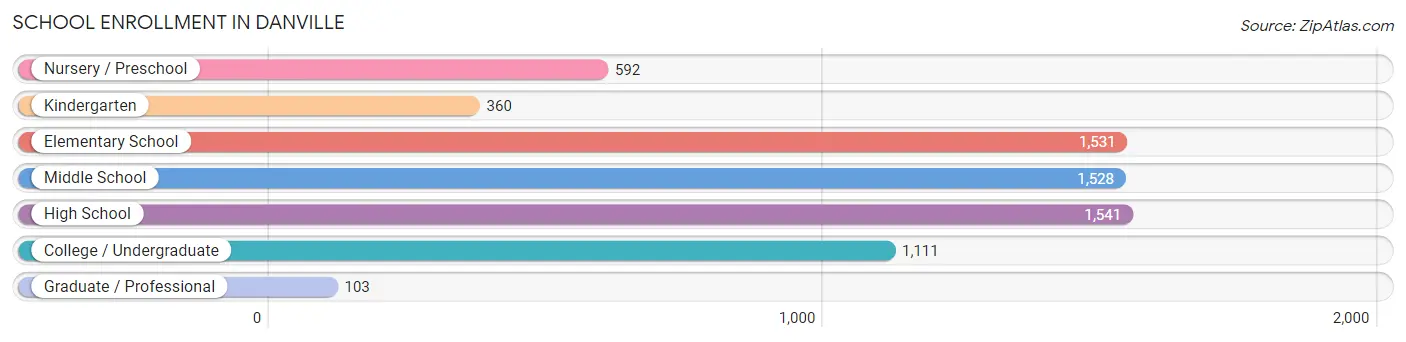
| School Level | # Students | % Students |
| Nursery / Preschool | 592 | 8.7% |
| Kindergarten | 360 | 5.3% |
| Elementary School | 1,531 | 22.6% |
| Middle School | 1,528 | 22.6% |
| High School | 1,541 | 22.8% |
| College / Undergraduate | 1,111 | 16.4% |
| Graduate / Professional | 103 | 1.5% |
| Total | 6,766 | 100.0% |
School Enrollment by Age by Funding Source in Danville
Out of a total of 6,766 students who are enrolled in schools in Danville, 447 (6.6%) attend a private institution, while the remaining 6,319 (93.4%) are enrolled in public schools. The age group of 25 to 34 year olds has the highest likelihood of being enrolled in private schools, with 61 (22.0% in the age bracket) enrolled. Conversely, the age group of 15 to 17 year olds has the lowest likelihood of being enrolled in a private school, with 1,085 (99.0% in the age bracket) attending a public institution.
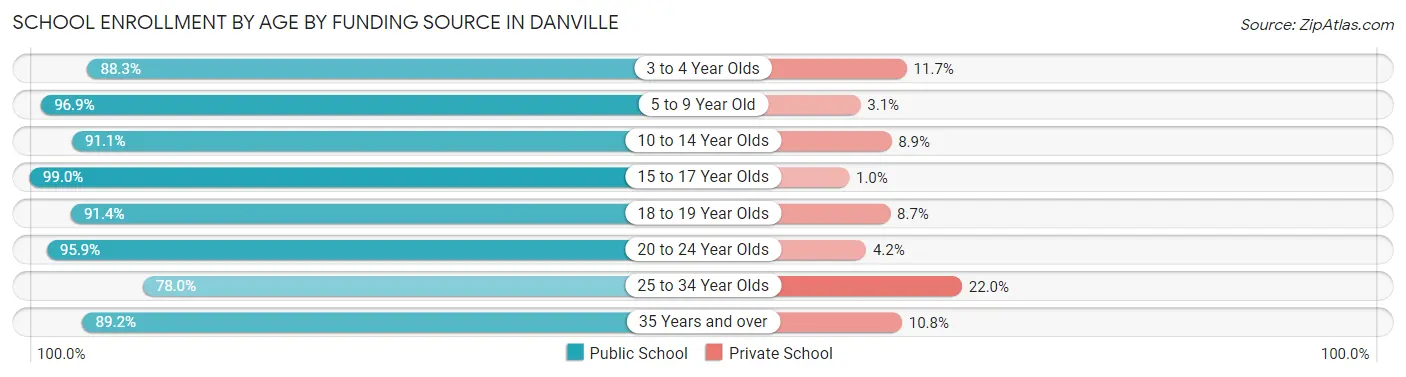
| Age Bracket | Public School | Private School |
| 3 to 4 Year Olds | 331 (88.3%) | 44 (11.7%) |
| 5 to 9 Year Old | 1,712 (96.9%) | 55 (3.1%) |
| 10 to 14 Year Olds | 1,831 (91.1%) | 178 (8.9%) |
| 15 to 17 Year Olds | 1,085 (99.0%) | 11 (1.0%) |
| 18 to 19 Year Olds | 380 (91.3%) | 36 (8.6%) |
| 20 to 24 Year Olds | 393 (95.9%) | 17 (4.2%) |
| 25 to 34 Year Olds | 216 (78.0%) | 61 (22.0%) |
| 35 Years and over | 371 (89.2%) | 45 (10.8%) |
| Total | 6,319 (93.4%) | 447 (6.6%) |
Educational Attainment by Field of Study in Danville
Education (742 | 20.4%), business (575 | 15.8%), science & technology (362 | 10.0%), arts & humanities (318 | 8.7%), and social sciences (279 | 7.7%) are the most common fields of study among 3,636 individuals in Danville who have obtained a bachelor's degree or higher.
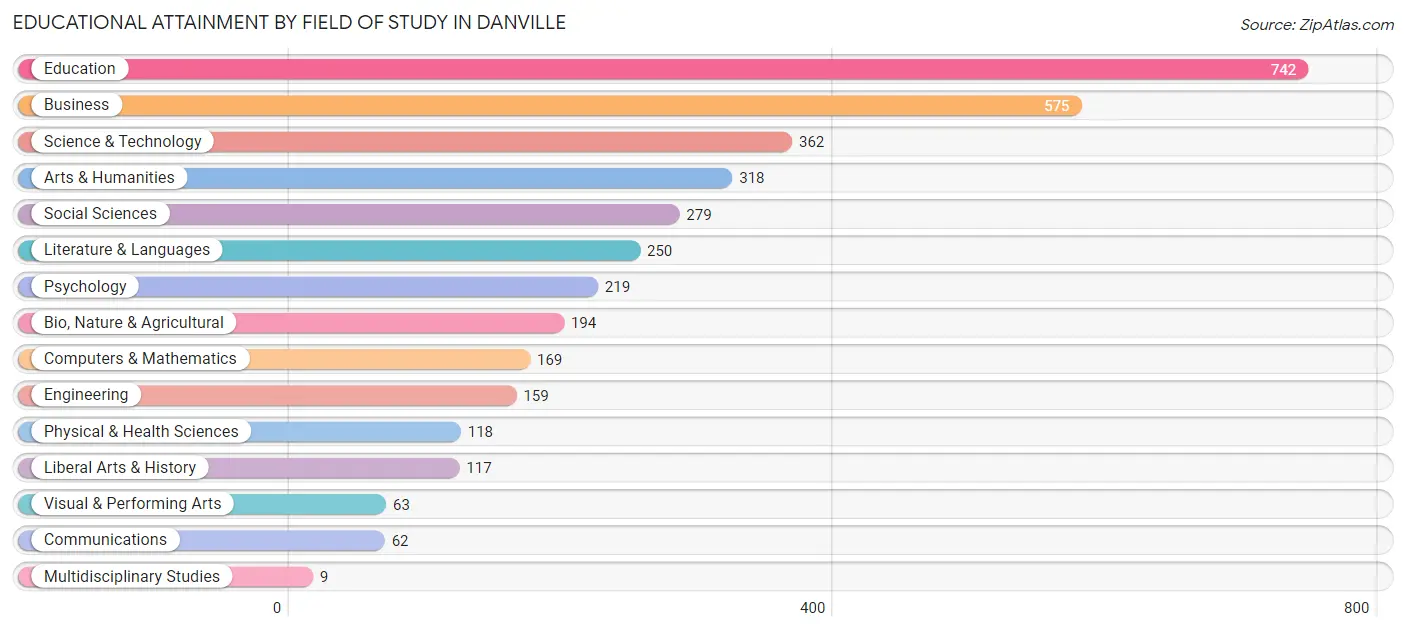
| Field of Study | # Graduates | % Graduates |
| Computers & Mathematics | 169 | 4.6% |
| Bio, Nature & Agricultural | 194 | 5.3% |
| Physical & Health Sciences | 118 | 3.3% |
| Psychology | 219 | 6.0% |
| Social Sciences | 279 | 7.7% |
| Engineering | 159 | 4.4% |
| Multidisciplinary Studies | 9 | 0.3% |
| Science & Technology | 362 | 10.0% |
| Business | 575 | 15.8% |
| Education | 742 | 20.4% |
| Literature & Languages | 250 | 6.9% |
| Liberal Arts & History | 117 | 3.2% |
| Visual & Performing Arts | 63 | 1.7% |
| Communications | 62 | 1.7% |
| Arts & Humanities | 318 | 8.7% |
| Total | 3,636 | 100.0% |
Transportation & Commute in Danville
Vehicle Availability by Sex in Danville
The most prevalent vehicle ownership categories in Danville are males with 2 vehicles (2,106, accounting for 41.5%) and females with 2 vehicles (2,045, making up 41.2%).
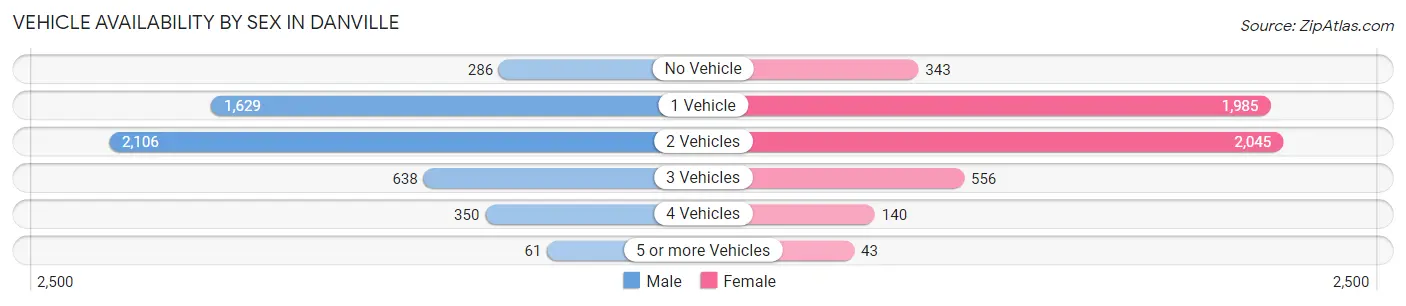
| Vehicles Available | Male | Female |
| No Vehicle | 286 (5.6%) | 343 (6.7%) |
| 1 Vehicle | 1,629 (32.1%) | 1,985 (38.8%) |
| 2 Vehicles | 2,106 (41.5%) | 2,045 (40.0%) |
| 3 Vehicles | 638 (12.6%) | 556 (10.9%) |
| 4 Vehicles | 350 (6.9%) | 140 (2.7%) |
| 5 or more Vehicles | 61 (1.2%) | 43 (0.8%) |
| Total | 5,070 (100.0%) | 5,112 (100.0%) |
Commute Time in Danville
The most frequently occuring commute durations in Danville are 10 to 14 minutes (3,699 commuters, 39.3%), 15 to 19 minutes (1,989 commuters, 21.1%), and 5 to 9 minutes (1,526 commuters, 16.2%).
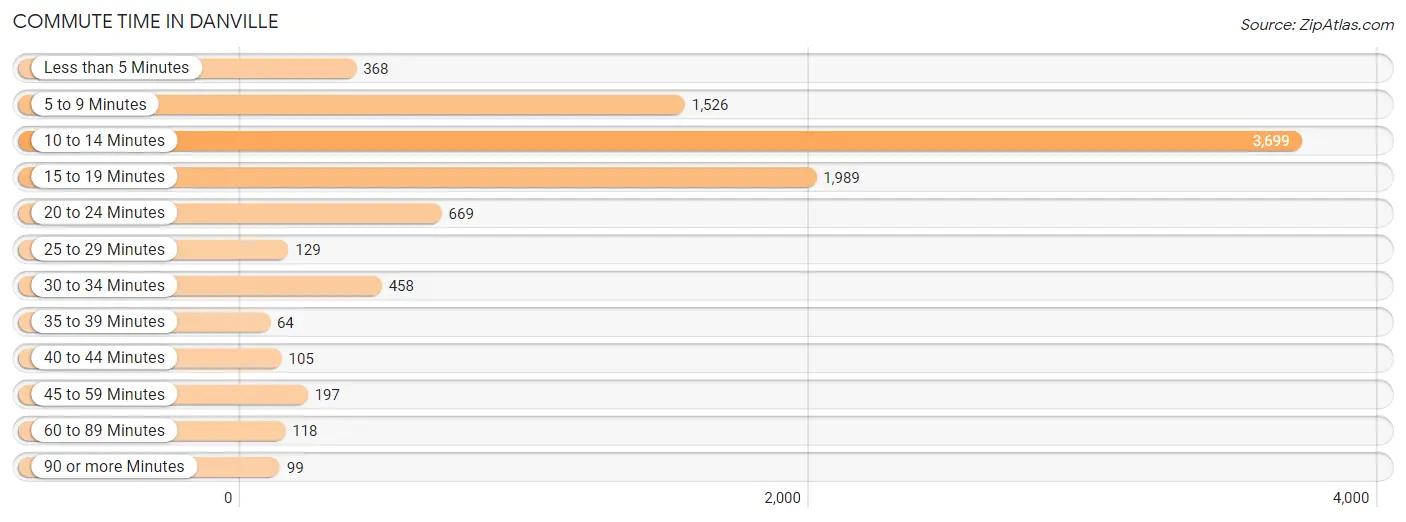
| Commute Time | # Commuters | % Commuters |
| Less than 5 Minutes | 368 | 3.9% |
| 5 to 9 Minutes | 1,526 | 16.2% |
| 10 to 14 Minutes | 3,699 | 39.3% |
| 15 to 19 Minutes | 1,989 | 21.1% |
| 20 to 24 Minutes | 669 | 7.1% |
| 25 to 29 Minutes | 129 | 1.4% |
| 30 to 34 Minutes | 458 | 4.9% |
| 35 to 39 Minutes | 64 | 0.7% |
| 40 to 44 Minutes | 105 | 1.1% |
| 45 to 59 Minutes | 197 | 2.1% |
| 60 to 89 Minutes | 118 | 1.3% |
| 90 or more Minutes | 99 | 1.1% |
Commute Time by Sex in Danville
The most common commute times in Danville are 10 to 14 minutes (1,767 commuters, 37.0%) for males and 10 to 14 minutes (1,932 commuters, 41.6%) for females.
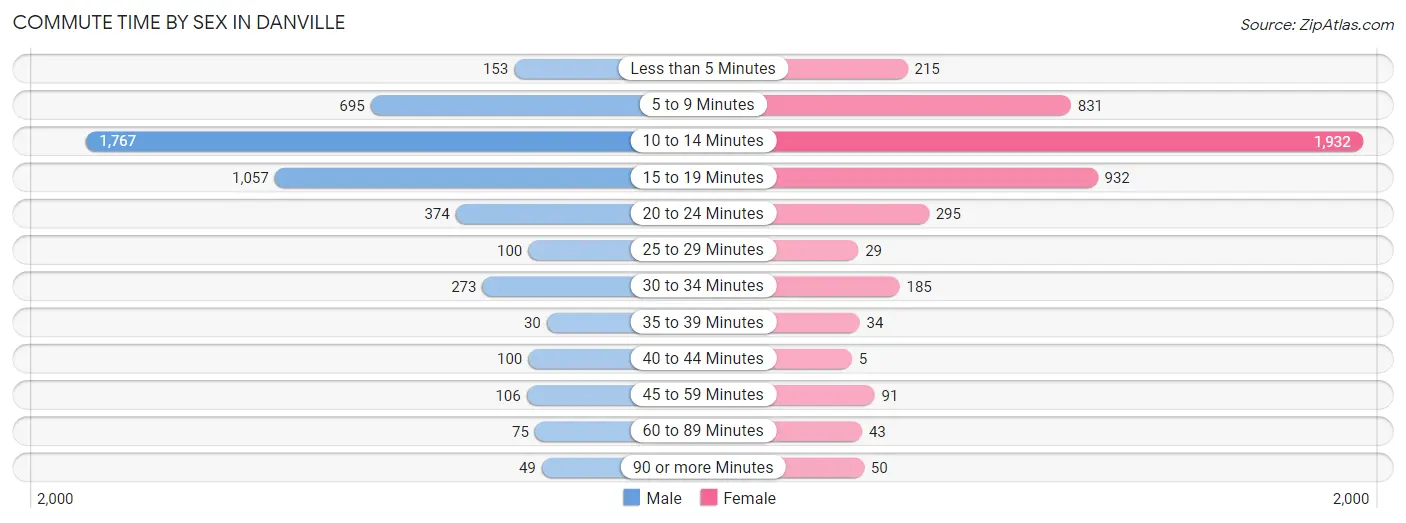
| Commute Time | Male | Female |
| Less than 5 Minutes | 153 (3.2%) | 215 (4.6%) |
| 5 to 9 Minutes | 695 (14.5%) | 831 (17.9%) |
| 10 to 14 Minutes | 1,767 (37.0%) | 1,932 (41.6%) |
| 15 to 19 Minutes | 1,057 (22.1%) | 932 (20.1%) |
| 20 to 24 Minutes | 374 (7.8%) | 295 (6.4%) |
| 25 to 29 Minutes | 100 (2.1%) | 29 (0.6%) |
| 30 to 34 Minutes | 273 (5.7%) | 185 (4.0%) |
| 35 to 39 Minutes | 30 (0.6%) | 34 (0.7%) |
| 40 to 44 Minutes | 100 (2.1%) | 5 (0.1%) |
| 45 to 59 Minutes | 106 (2.2%) | 91 (2.0%) |
| 60 to 89 Minutes | 75 (1.6%) | 43 (0.9%) |
| 90 or more Minutes | 49 (1.0%) | 50 (1.1%) |
Time of Departure to Work by Sex in Danville
The most frequent times of departure to work in Danville are 6:30 AM to 6:59 AM (709, 14.8%) for males and 7:00 AM to 7:29 AM (672, 14.5%) for females.
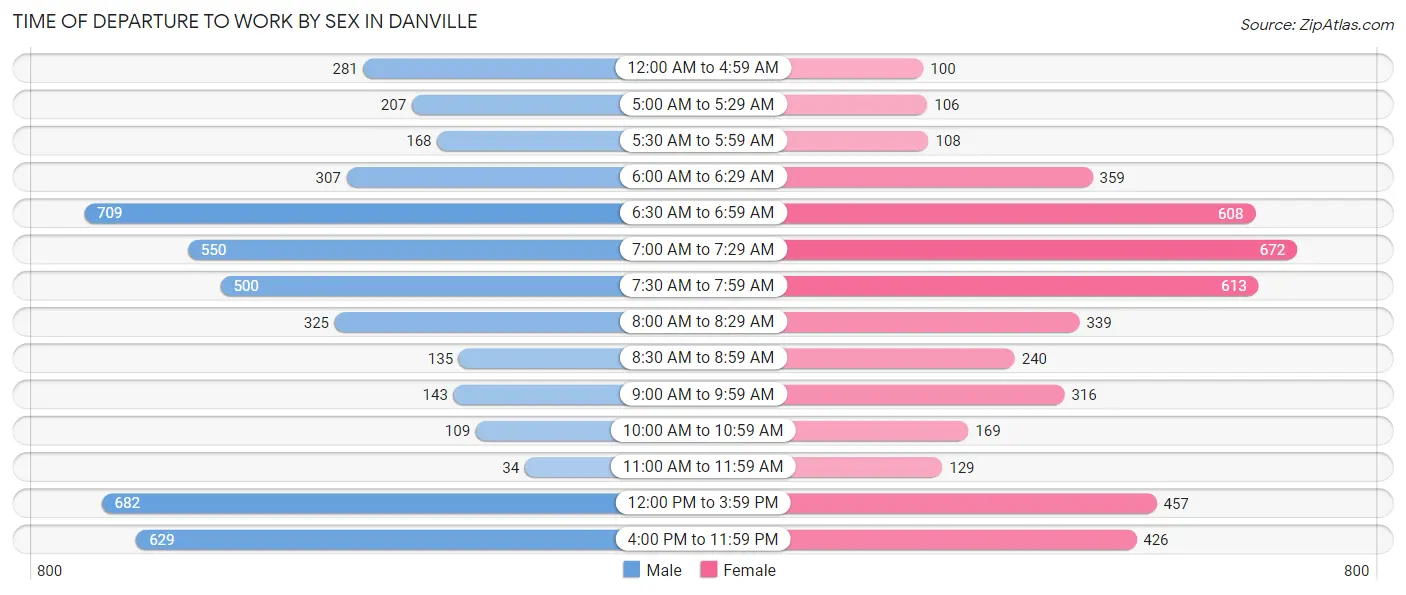
| Time of Departure | Male | Female |
| 12:00 AM to 4:59 AM | 281 (5.9%) | 100 (2.1%) |
| 5:00 AM to 5:29 AM | 207 (4.3%) | 106 (2.3%) |
| 5:30 AM to 5:59 AM | 168 (3.5%) | 108 (2.3%) |
| 6:00 AM to 6:29 AM | 307 (6.4%) | 359 (7.7%) |
| 6:30 AM to 6:59 AM | 709 (14.8%) | 608 (13.1%) |
| 7:00 AM to 7:29 AM | 550 (11.5%) | 672 (14.5%) |
| 7:30 AM to 7:59 AM | 500 (10.5%) | 613 (13.2%) |
| 8:00 AM to 8:29 AM | 325 (6.8%) | 339 (7.3%) |
| 8:30 AM to 8:59 AM | 135 (2.8%) | 240 (5.2%) |
| 9:00 AM to 9:59 AM | 143 (3.0%) | 316 (6.8%) |
| 10:00 AM to 10:59 AM | 109 (2.3%) | 169 (3.6%) |
| 11:00 AM to 11:59 AM | 34 (0.7%) | 129 (2.8%) |
| 12:00 PM to 3:59 PM | 682 (14.3%) | 457 (9.8%) |
| 4:00 PM to 11:59 PM | 629 (13.2%) | 426 (9.2%) |
| Total | 4,779 (100.0%) | 4,642 (100.0%) |
Housing Occupancy in Danville
Occupancy by Ownership in Danville
Of the total 11,536 dwellings in Danville, owner-occupied units account for 6,462 (56.0%), while renter-occupied units make up 5,074 (44.0%).
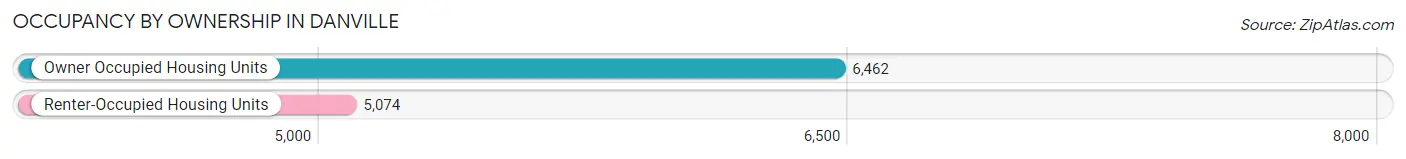
| Occupancy | # Housing Units | % Housing Units |
| Owner Occupied Housing Units | 6,462 | 56.0% |
| Renter-Occupied Housing Units | 5,074 | 44.0% |
| Total Occupied Housing Units | 11,536 | 100.0% |
Occupancy by Household Size in Danville
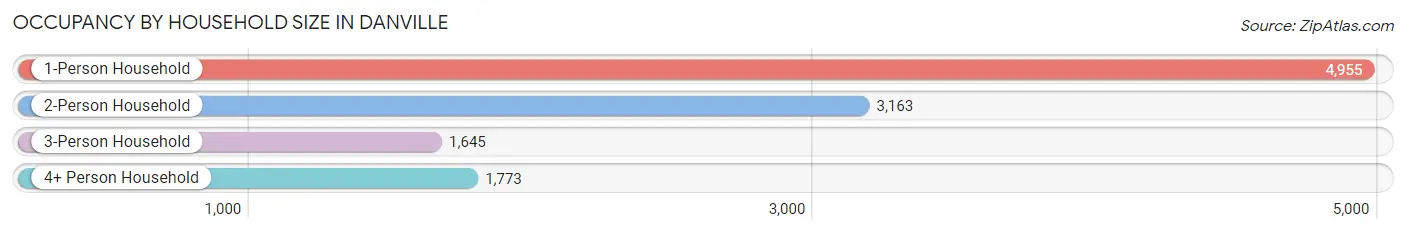
| Household Size | # Housing Units | % Housing Units |
| 1-Person Household | 4,955 | 42.9% |
| 2-Person Household | 3,163 | 27.4% |
| 3-Person Household | 1,645 | 14.3% |
| 4+ Person Household | 1,773 | 15.4% |
| Total Housing Units | 11,536 | 100.0% |
Occupancy by Ownership by Household Size in Danville
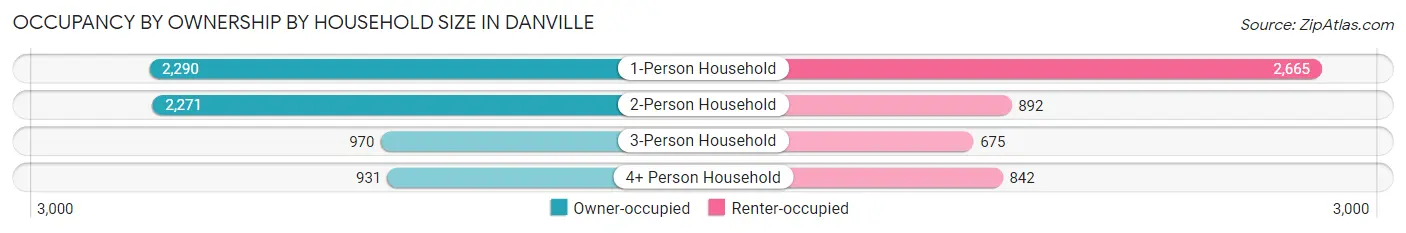
| Household Size | Owner-occupied | Renter-occupied |
| 1-Person Household | 2,290 (46.2%) | 2,665 (53.8%) |
| 2-Person Household | 2,271 (71.8%) | 892 (28.2%) |
| 3-Person Household | 970 (59.0%) | 675 (41.0%) |
| 4+ Person Household | 931 (52.5%) | 842 (47.5%) |
| Total Housing Units | 6,462 (56.0%) | 5,074 (44.0%) |
Occupancy by Educational Attainment in Danville
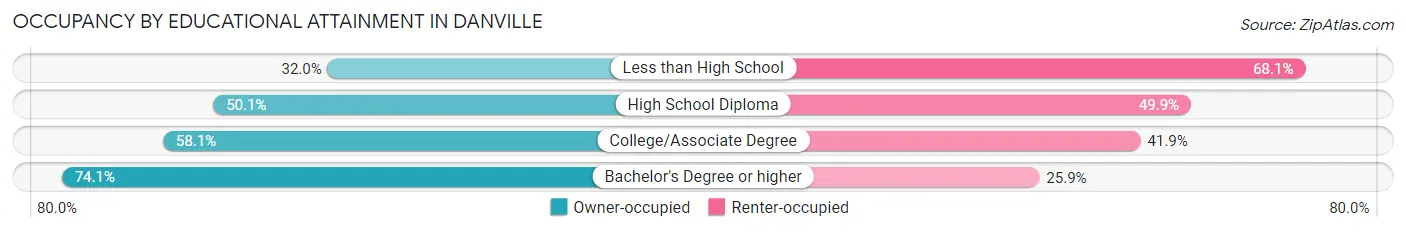
| Household Size | Owner-occupied | Renter-occupied |
| Less than High School | 308 (32.0%) | 656 (68.0%) |
| High School Diploma | 2,102 (50.1%) | 2,095 (49.9%) |
| College/Associate Degree | 2,432 (58.1%) | 1,757 (41.9%) |
| Bachelor's Degree or higher | 1,620 (74.1%) | 566 (25.9%) |
Occupancy by Age of Householder in Danville
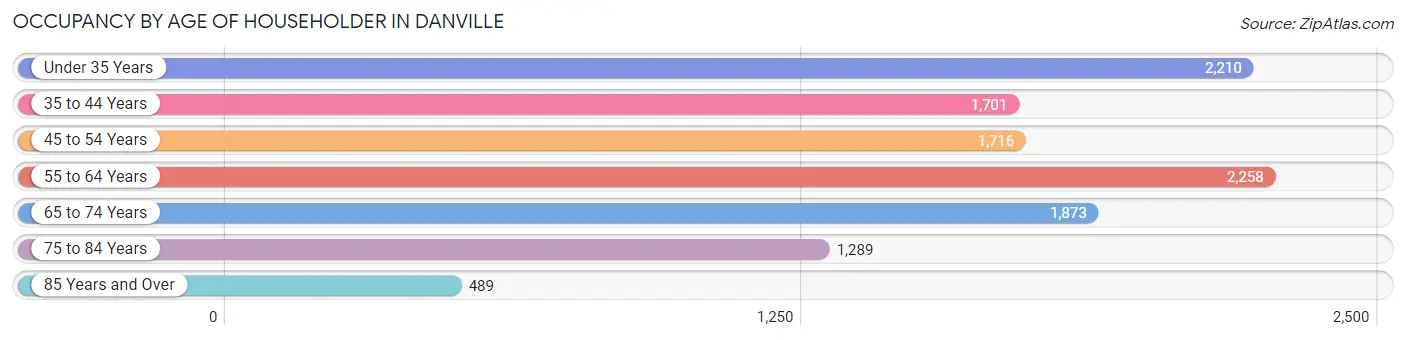
| Age Bracket | # Households | % Households |
| Under 35 Years | 2,210 | 19.2% |
| 35 to 44 Years | 1,701 | 14.7% |
| 45 to 54 Years | 1,716 | 14.9% |
| 55 to 64 Years | 2,258 | 19.6% |
| 65 to 74 Years | 1,873 | 16.2% |
| 75 to 84 Years | 1,289 | 11.2% |
| 85 Years and Over | 489 | 4.2% |
| Total | 11,536 | 100.0% |
Housing Finances in Danville
Median Income by Occupancy in Danville
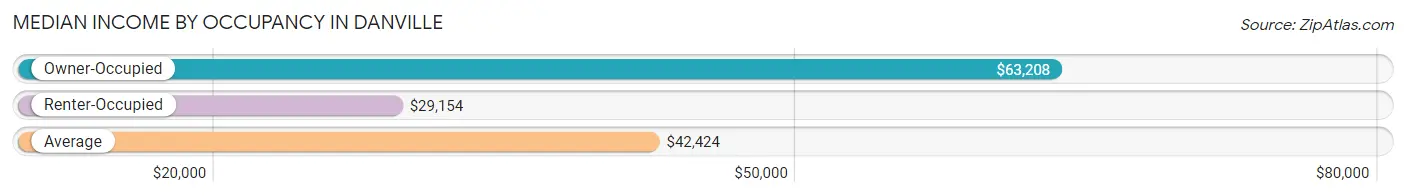
| Occupancy Type | # Households | Median Income |
| Owner-Occupied | 6,462 (56.0%) | $63,208 |
| Renter-Occupied | 5,074 (44.0%) | $29,154 |
| Average | 11,536 (100.0%) | $42,424 |
Occupancy by Householder Income Bracket in Danville
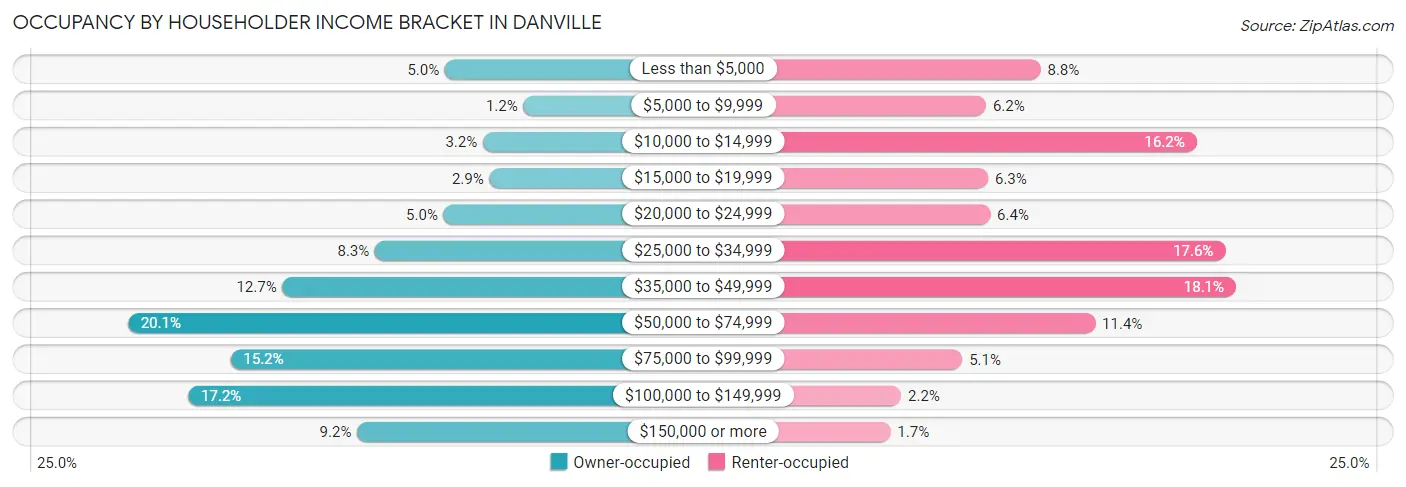
| Income Bracket | Owner-occupied | Renter-occupied |
| Less than $5,000 | 322 (5.0%) | 447 (8.8%) |
| $5,000 to $9,999 | 80 (1.2%) | 315 (6.2%) |
| $10,000 to $14,999 | 205 (3.2%) | 824 (16.2%) |
| $15,000 to $19,999 | 185 (2.9%) | 320 (6.3%) |
| $20,000 to $24,999 | 326 (5.0%) | 325 (6.4%) |
| $25,000 to $34,999 | 537 (8.3%) | 893 (17.6%) |
| $35,000 to $49,999 | 822 (12.7%) | 919 (18.1%) |
| $50,000 to $74,999 | 1,298 (20.1%) | 579 (11.4%) |
| $75,000 to $99,999 | 982 (15.2%) | 258 (5.1%) |
| $100,000 to $149,999 | 1,113 (17.2%) | 110 (2.2%) |
| $150,000 or more | 592 (9.2%) | 84 (1.7%) |
| Total | 6,462 (100.0%) | 5,074 (100.0%) |
Monthly Housing Cost Tiers in Danville
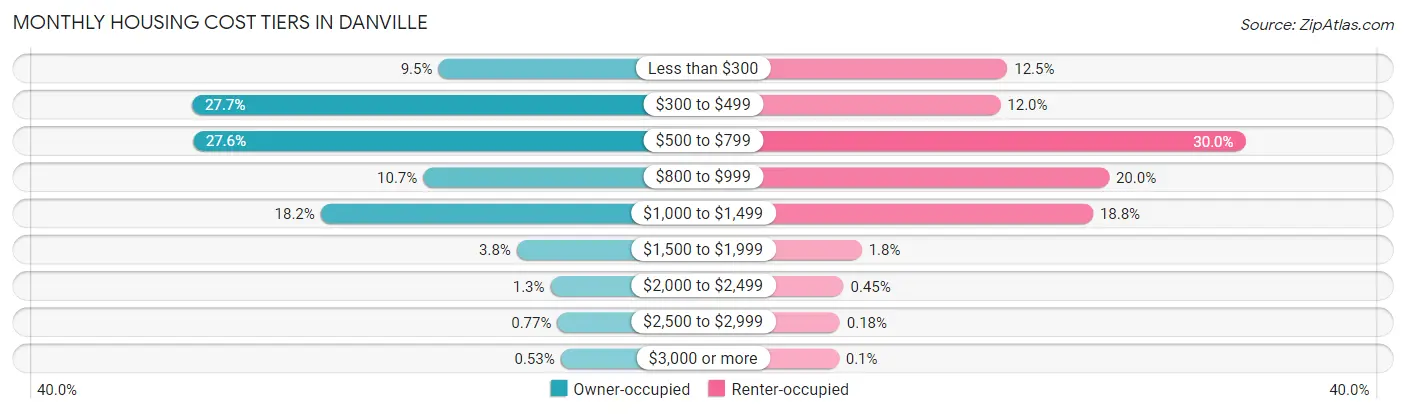
| Monthly Cost | Owner-occupied | Renter-occupied |
| Less than $300 | 616 (9.5%) | 635 (12.5%) |
| $300 to $499 | 1,788 (27.7%) | 609 (12.0%) |
| $500 to $799 | 1,784 (27.6%) | 1,524 (30.0%) |
| $800 to $999 | 688 (10.6%) | 1,015 (20.0%) |
| $1,000 to $1,499 | 1,176 (18.2%) | 955 (18.8%) |
| $1,500 to $1,999 | 243 (3.8%) | 91 (1.8%) |
| $2,000 to $2,499 | 83 (1.3%) | 23 (0.4%) |
| $2,500 to $2,999 | 50 (0.8%) | 9 (0.2%) |
| $3,000 or more | 34 (0.5%) | 5 (0.1%) |
| Total | 6,462 (100.0%) | 5,074 (100.0%) |
Physical Housing Characteristics in Danville
Housing Structures in Danville
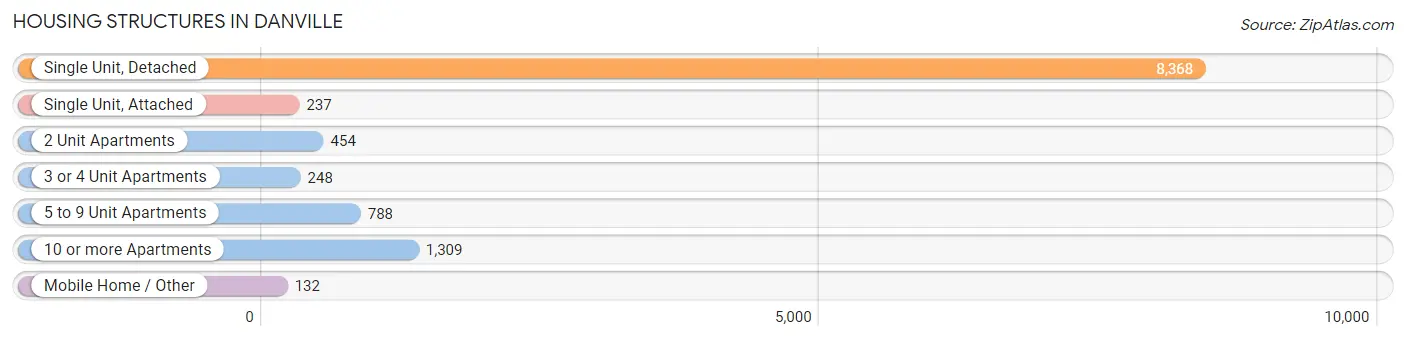
| Structure Type | # Housing Units | % Housing Units |
| Single Unit, Detached | 8,368 | 72.5% |
| Single Unit, Attached | 237 | 2.1% |
| 2 Unit Apartments | 454 | 3.9% |
| 3 or 4 Unit Apartments | 248 | 2.1% |
| 5 to 9 Unit Apartments | 788 | 6.8% |
| 10 or more Apartments | 1,309 | 11.4% |
| Mobile Home / Other | 132 | 1.1% |
| Total | 11,536 | 100.0% |
Housing Structures by Occupancy in Danville
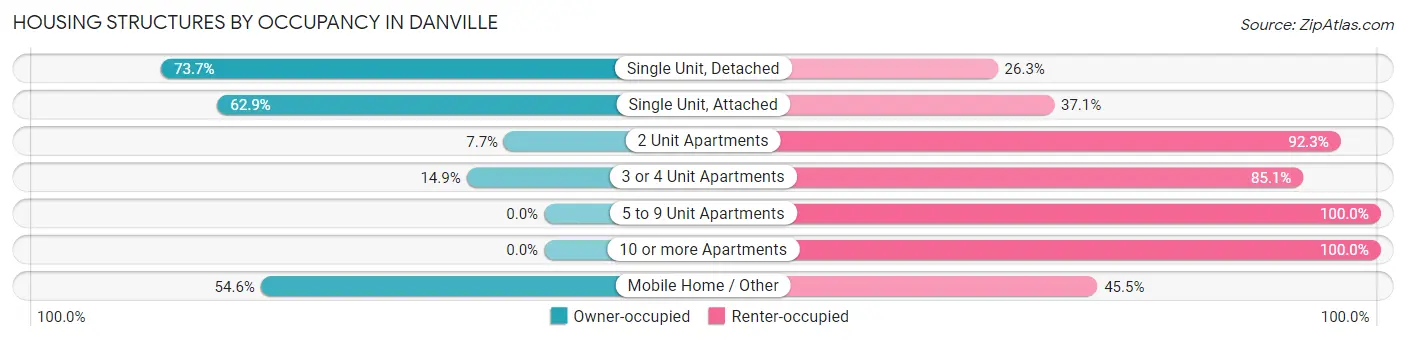
| Structure Type | Owner-occupied | Renter-occupied |
| Single Unit, Detached | 6,169 (73.7%) | 2,199 (26.3%) |
| Single Unit, Attached | 149 (62.9%) | 88 (37.1%) |
| 2 Unit Apartments | 35 (7.7%) | 419 (92.3%) |
| 3 or 4 Unit Apartments | 37 (14.9%) | 211 (85.1%) |
| 5 to 9 Unit Apartments | 0 (0.0%) | 788 (100.0%) |
| 10 or more Apartments | 0 (0.0%) | 1,309 (100.0%) |
| Mobile Home / Other | 72 (54.5%) | 60 (45.5%) |
| Total | 6,462 (56.0%) | 5,074 (44.0%) |
Housing Structures by Number of Rooms in Danville
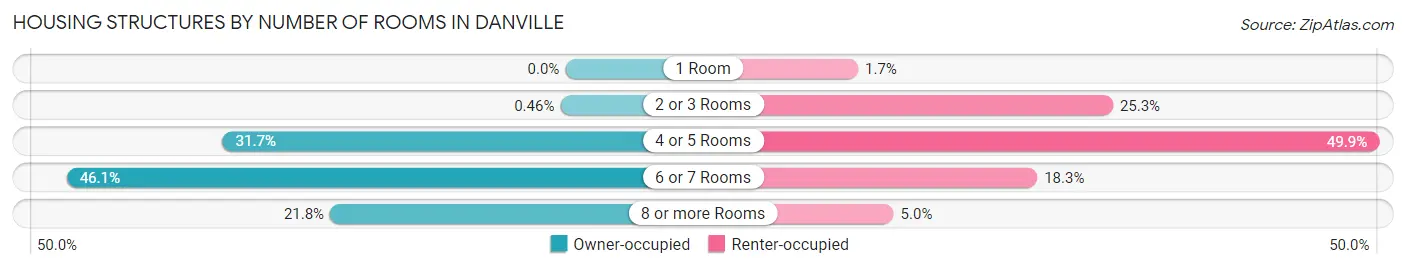
| Number of Rooms | Owner-occupied | Renter-occupied |
| 1 Room | 0 (0.0%) | 85 (1.7%) |
| 2 or 3 Rooms | 30 (0.5%) | 1,281 (25.3%) |
| 4 or 5 Rooms | 2,047 (31.7%) | 2,530 (49.9%) |
| 6 or 7 Rooms | 2,979 (46.1%) | 926 (18.2%) |
| 8 or more Rooms | 1,406 (21.8%) | 252 (5.0%) |
| Total | 6,462 (100.0%) | 5,074 (100.0%) |
Housing Structure by Heating Type in Danville
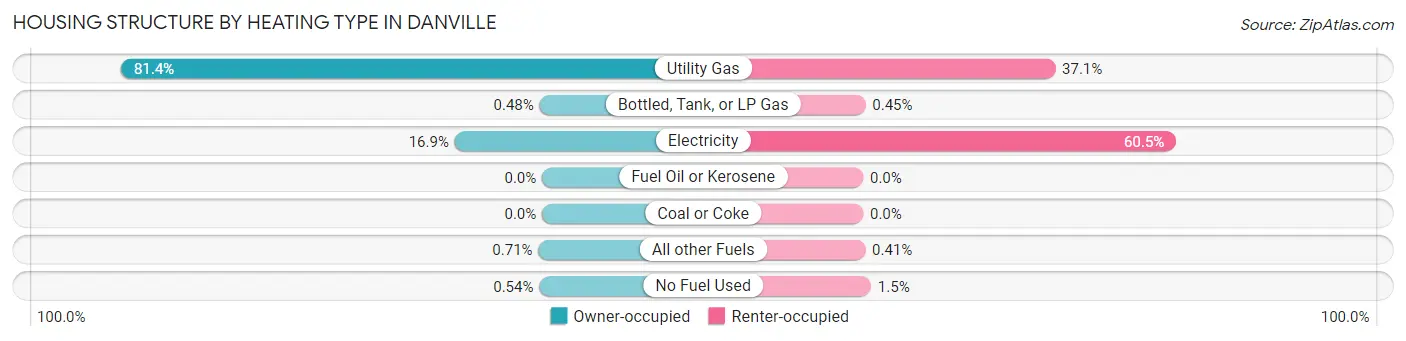
| Heating Type | Owner-occupied | Renter-occupied |
| Utility Gas | 5,259 (81.4%) | 1,883 (37.1%) |
| Bottled, Tank, or LP Gas | 31 (0.5%) | 23 (0.4%) |
| Electricity | 1,091 (16.9%) | 3,070 (60.5%) |
| Fuel Oil or Kerosene | 0 (0.0%) | 0 (0.0%) |
| Coal or Coke | 0 (0.0%) | 0 (0.0%) |
| All other Fuels | 46 (0.7%) | 21 (0.4%) |
| No Fuel Used | 35 (0.5%) | 77 (1.5%) |
| Total | 6,462 (100.0%) | 5,074 (100.0%) |
Household Vehicle Usage in Danville
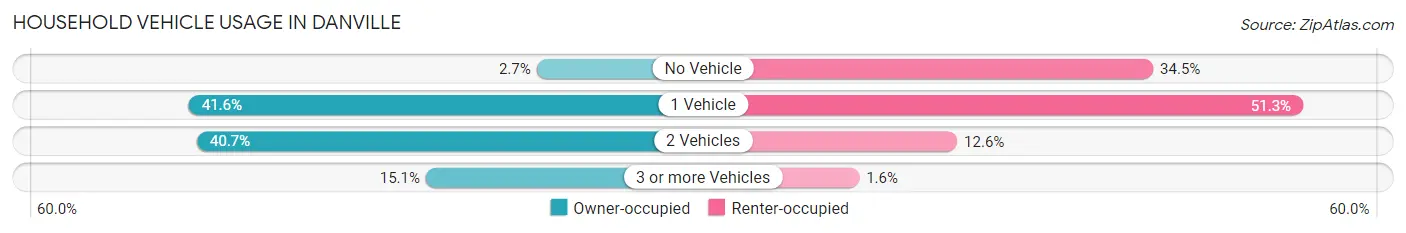
| Vehicles per Household | Owner-occupied | Renter-occupied |
| No Vehicle | 171 (2.6%) | 1,752 (34.5%) |
| 1 Vehicle | 2,688 (41.6%) | 2,603 (51.3%) |
| 2 Vehicles | 2,630 (40.7%) | 638 (12.6%) |
| 3 or more Vehicles | 973 (15.1%) | 81 (1.6%) |
| Total | 6,462 (100.0%) | 5,074 (100.0%) |
Real Estate & Mortgages in Danville
Real Estate and Mortgage Overview in Danville
| Characteristic | Without Mortgage | With Mortgage |
| Housing Units | 3,951 | 2,511 |
| Median Property Value | $72,300 | $89,800 |
| Median Household Income | $55,804 | $331 |
| Monthly Housing Costs | $458 | $23 |
| Real Estate Taxes | $1,316 | $89 |
Property Value by Mortgage Status in Danville
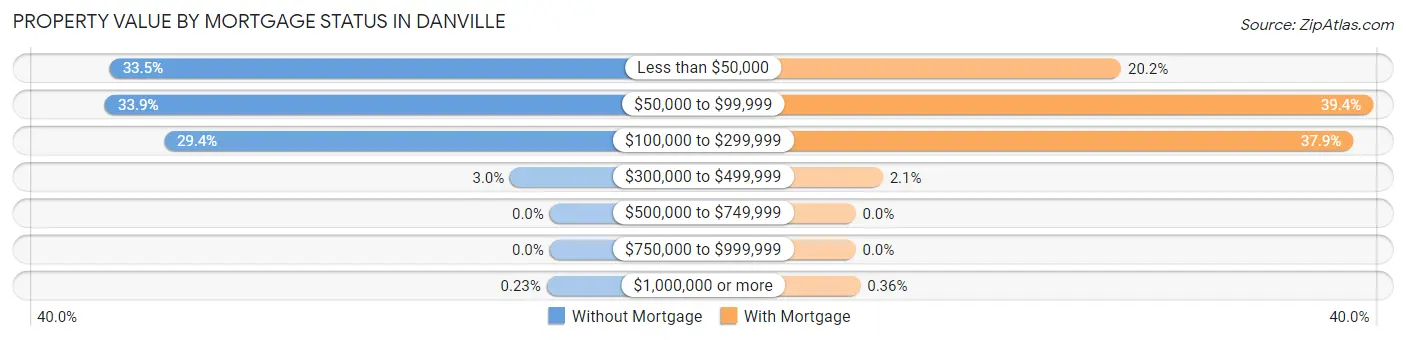
| Property Value | Without Mortgage | With Mortgage |
| Less than $50,000 | 1,324 (33.5%) | 508 (20.2%) |
| $50,000 to $99,999 | 1,338 (33.9%) | 990 (39.4%) |
| $100,000 to $299,999 | 1,161 (29.4%) | 952 (37.9%) |
| $300,000 to $499,999 | 119 (3.0%) | 52 (2.1%) |
| $500,000 to $749,999 | 0 (0.0%) | 0 (0.0%) |
| $750,000 to $999,999 | 0 (0.0%) | 0 (0.0%) |
| $1,000,000 or more | 9 (0.2%) | 9 (0.4%) |
| Total | 3,951 (100.0%) | 2,511 (100.0%) |
Household Income by Mortgage Status in Danville
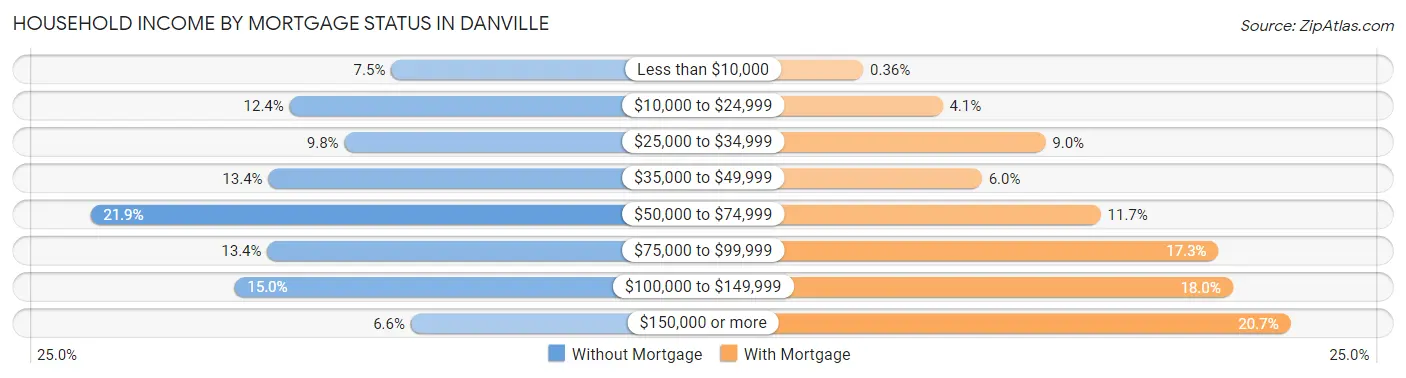
| Household Income | Without Mortgage | With Mortgage |
| Less than $10,000 | 298 (7.5%) | 9 (0.4%) |
| $10,000 to $24,999 | 489 (12.4%) | 104 (4.1%) |
| $25,000 to $34,999 | 386 (9.8%) | 227 (9.0%) |
| $35,000 to $49,999 | 529 (13.4%) | 151 (6.0%) |
| $50,000 to $74,999 | 864 (21.9%) | 293 (11.7%) |
| $75,000 to $99,999 | 531 (13.4%) | 434 (17.3%) |
| $100,000 to $149,999 | 593 (15.0%) | 451 (18.0%) |
| $150,000 or more | 261 (6.6%) | 520 (20.7%) |
| Total | 3,951 (100.0%) | 2,511 (100.0%) |
Property Value to Household Income Ratio in Danville
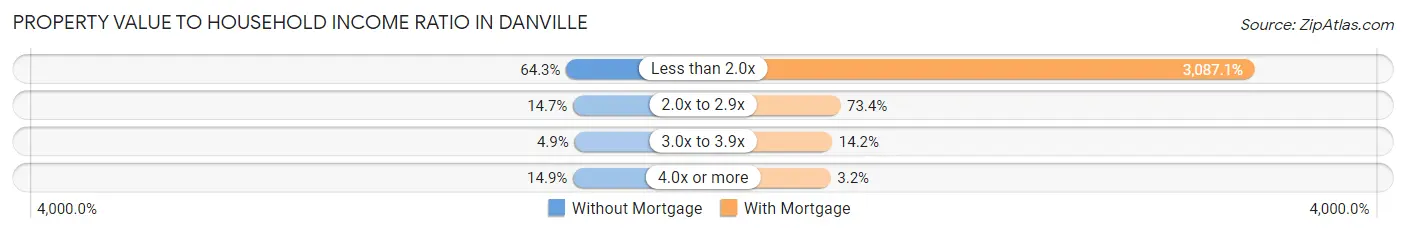
| Value-to-Income Ratio | Without Mortgage | With Mortgage |
| Less than 2.0x | 2,540 (64.3%) | 77,516 (3,087.1%) |
| 2.0x to 2.9x | 580 (14.7%) | 1,842 (73.4%) |
| 3.0x to 3.9x | 194 (4.9%) | 357 (14.2%) |
| 4.0x or more | 590 (14.9%) | 79 (3.2%) |
| Total | 3,951 (100.0%) | 2,511 (100.0%) |
Real Estate Taxes by Mortgage Status in Danville
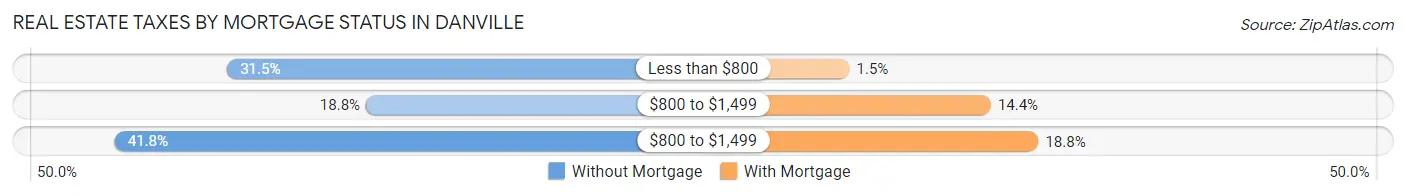
| Property Taxes | Without Mortgage | With Mortgage |
| Less than $800 | 1,244 (31.5%) | 38 (1.5%) |
| $800 to $1,499 | 744 (18.8%) | 362 (14.4%) |
| $800 to $1,499 | 1,650 (41.8%) | 471 (18.8%) |
| Total | 3,951 (100.0%) | 2,511 (100.0%) |
Health & Disability in Danville
Health Insurance Coverage by Age in Danville
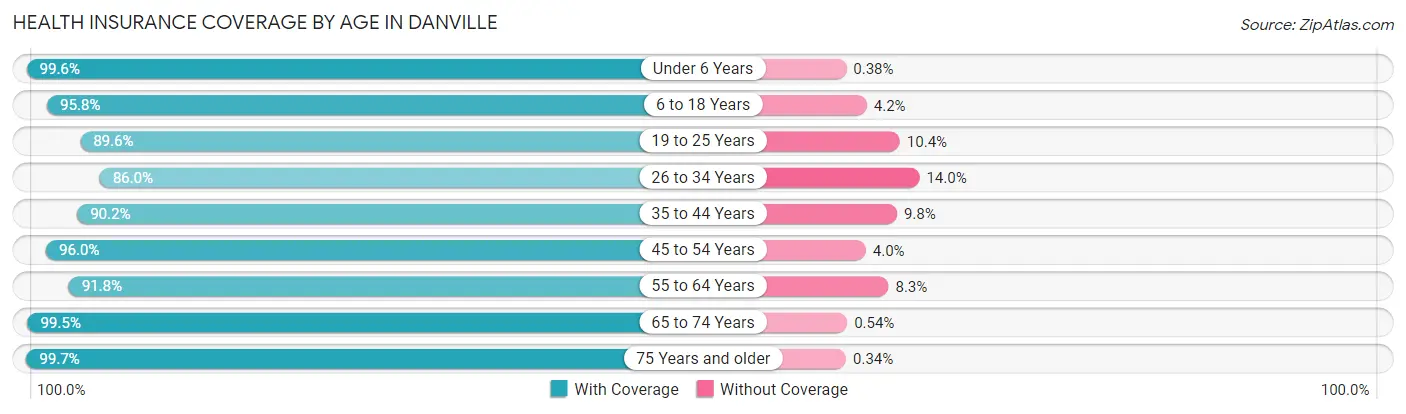
| Age Bracket | With Coverage | Without Coverage |
| Under 6 Years | 2,376 (99.6%) | 9 (0.4%) |
| 6 to 18 Years | 4,686 (95.8%) | 206 (4.2%) |
| 19 to 25 Years | 2,074 (89.6%) | 240 (10.4%) |
| 26 to 34 Years | 2,557 (86.0%) | 417 (14.0%) |
| 35 to 44 Years | 2,738 (90.2%) | 298 (9.8%) |
| 45 to 54 Years | 2,577 (96.0%) | 108 (4.0%) |
| 55 to 64 Years | 3,314 (91.7%) | 298 (8.3%) |
| 65 to 74 Years | 2,787 (99.5%) | 15 (0.5%) |
| 75 Years and older | 2,359 (99.7%) | 8 (0.3%) |
| Total | 25,468 (94.1%) | 1,599 (5.9%) |
Health Insurance Coverage by Citizenship Status in Danville
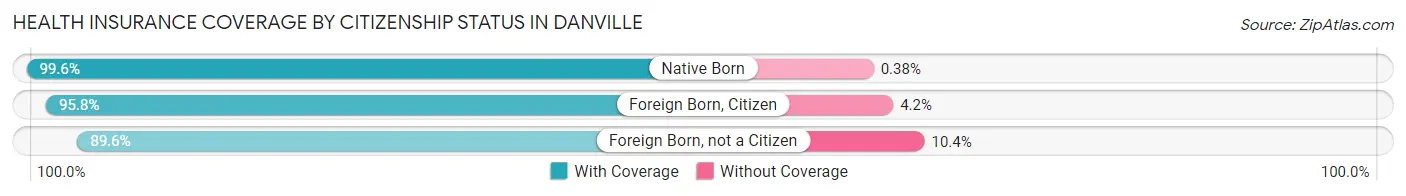
| Citizenship Status | With Coverage | Without Coverage |
| Native Born | 2,376 (99.6%) | 9 (0.4%) |
| Foreign Born, Citizen | 4,686 (95.8%) | 206 (4.2%) |
| Foreign Born, not a Citizen | 2,074 (89.6%) | 240 (10.4%) |
Health Insurance Coverage by Household Income in Danville
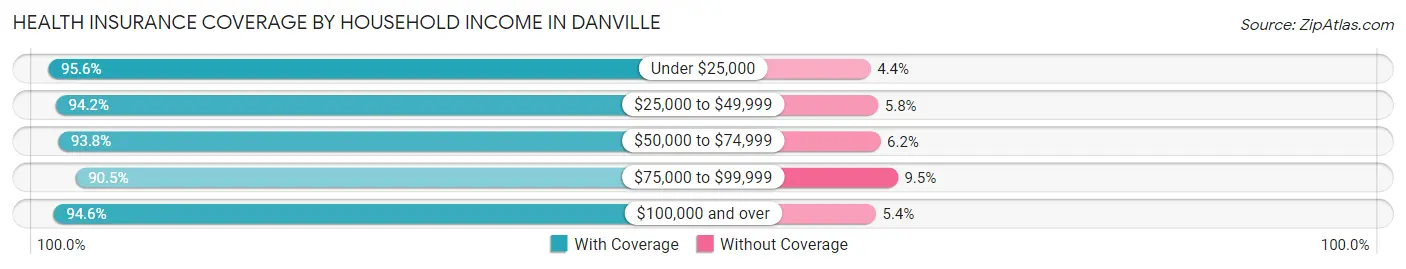
| Household Income | With Coverage | Without Coverage |
| Under $25,000 | 5,758 (95.6%) | 265 (4.4%) |
| $25,000 to $49,999 | 6,700 (94.2%) | 414 (5.8%) |
| $50,000 to $74,999 | 4,235 (93.8%) | 282 (6.2%) |
| $75,000 to $99,999 | 3,070 (90.5%) | 322 (9.5%) |
| $100,000 and over | 5,538 (94.6%) | 315 (5.4%) |
Public vs Private Health Insurance Coverage by Age in Danville
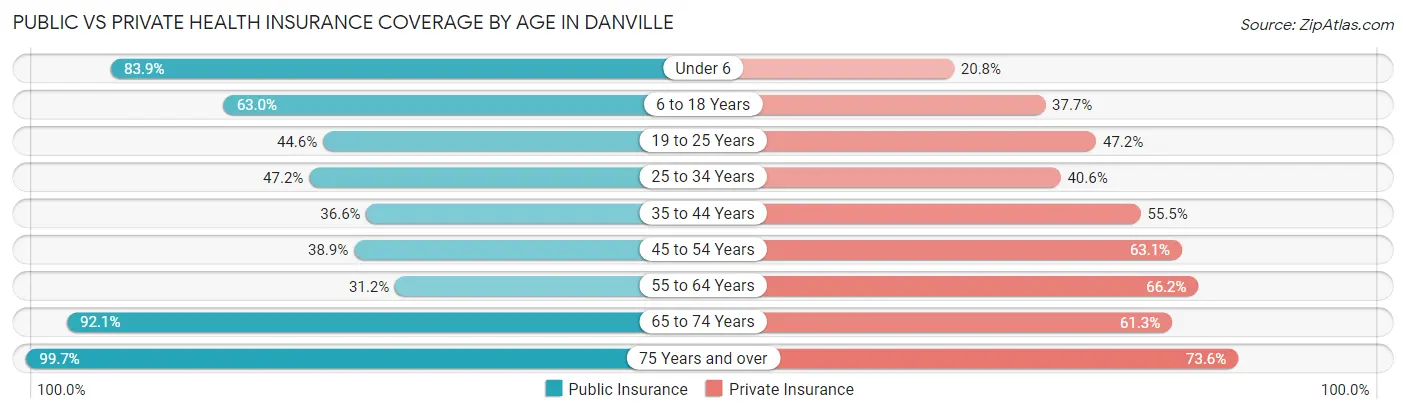
| Age Bracket | Public Insurance | Private Insurance |
| Under 6 | 2,002 (83.9%) | 496 (20.8%) |
| 6 to 18 Years | 3,084 (63.0%) | 1,846 (37.7%) |
| 19 to 25 Years | 1,032 (44.6%) | 1,092 (47.2%) |
| 25 to 34 Years | 1,403 (47.2%) | 1,207 (40.6%) |
| 35 to 44 Years | 1,110 (36.6%) | 1,684 (55.5%) |
| 45 to 54 Years | 1,043 (38.9%) | 1,695 (63.1%) |
| 55 to 64 Years | 1,128 (31.2%) | 2,390 (66.2%) |
| 65 to 74 Years | 2,581 (92.1%) | 1,718 (61.3%) |
| 75 Years and over | 2,359 (99.7%) | 1,741 (73.6%) |
| Total | 15,742 (58.2%) | 13,869 (51.2%) |
Disability Status by Sex by Age in Danville
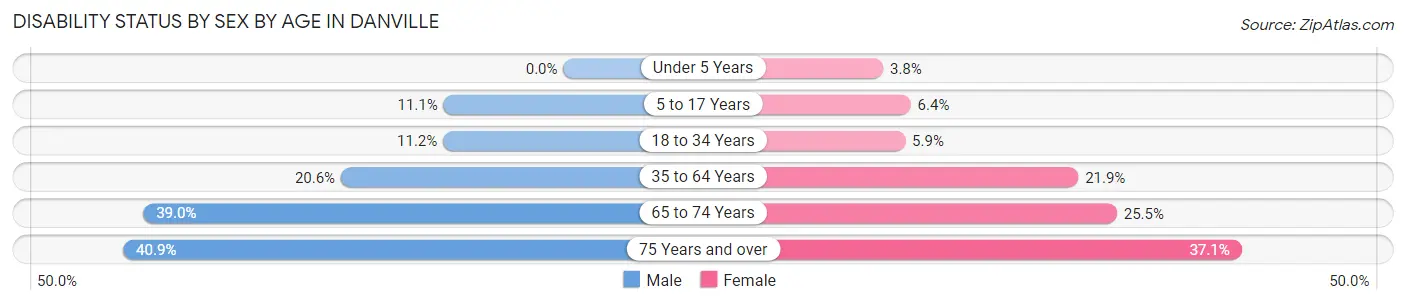
| Age Bracket | Male | Female |
| Under 5 Years | 0 (0.0%) | 33 (3.8%) |
| 5 to 17 Years | 293 (11.1%) | 153 (6.4%) |
| 18 to 34 Years | 289 (11.2%) | 176 (5.9%) |
| 35 to 64 Years | 903 (20.6%) | 1,088 (21.9%) |
| 65 to 74 Years | 469 (39.0%) | 408 (25.5%) |
| 75 Years and over | 357 (40.8%) | 554 (37.1%) |
Disability Class by Sex by Age in Danville
Disability Class: Hearing Difficulty
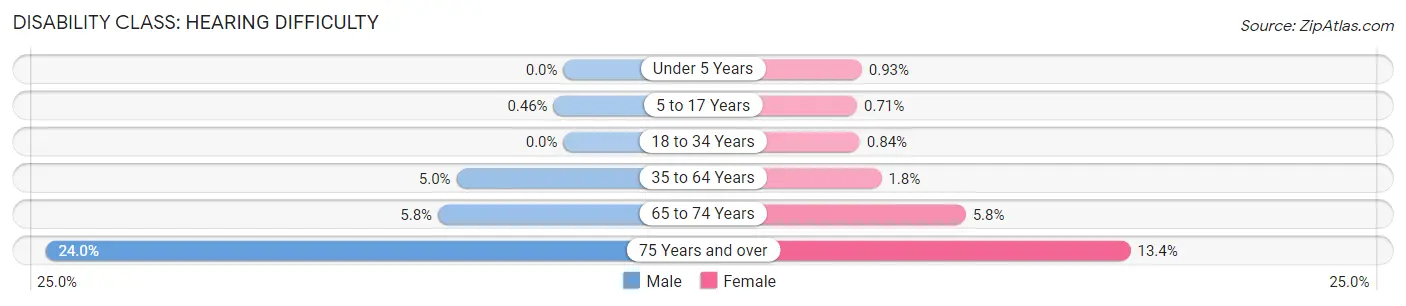
| Age Bracket | Male | Female |
| Under 5 Years | 0 (0.0%) | 8 (0.9%) |
| 5 to 17 Years | 12 (0.5%) | 17 (0.7%) |
| 18 to 34 Years | 0 (0.0%) | 25 (0.8%) |
| 35 to 64 Years | 217 (5.0%) | 91 (1.8%) |
| 65 to 74 Years | 70 (5.8%) | 92 (5.8%) |
| 75 Years and over | 210 (24.0%) | 200 (13.4%) |
Disability Class: Vision Difficulty
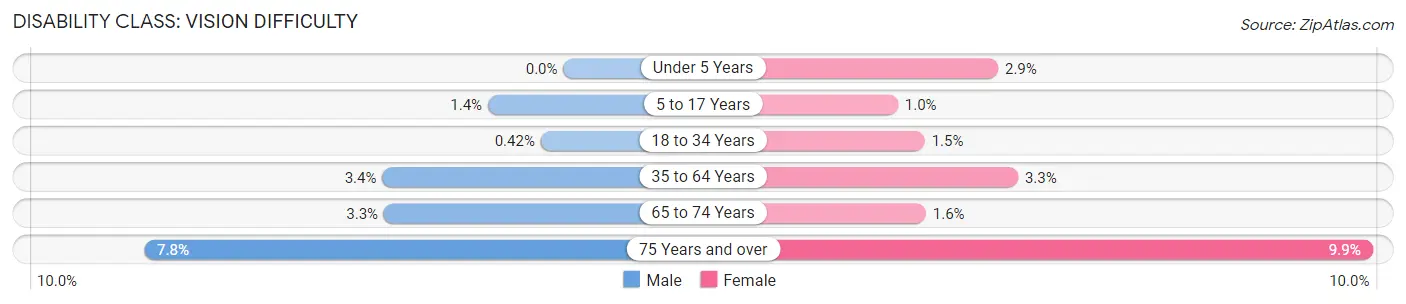
| Age Bracket | Male | Female |
| Under 5 Years | 0 (0.0%) | 25 (2.9%) |
| 5 to 17 Years | 37 (1.4%) | 25 (1.0%) |
| 18 to 34 Years | 11 (0.4%) | 46 (1.5%) |
| 35 to 64 Years | 147 (3.4%) | 162 (3.3%) |
| 65 to 74 Years | 40 (3.3%) | 25 (1.6%) |
| 75 Years and over | 68 (7.8%) | 147 (9.9%) |
Disability Class: Cognitive Difficulty
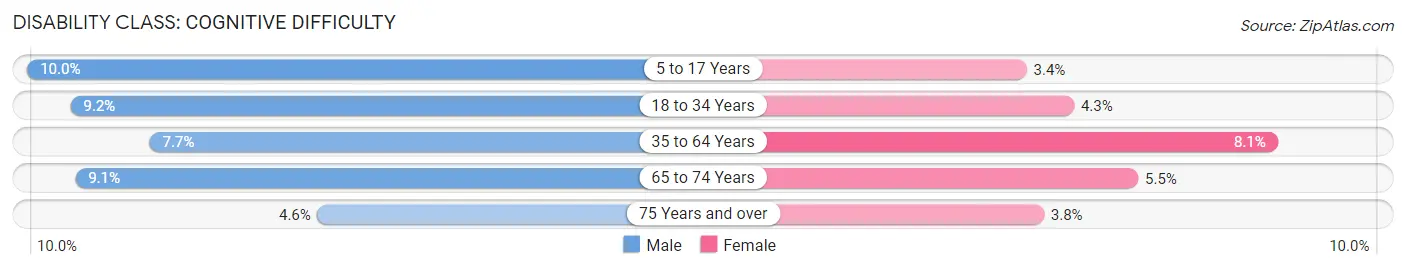
| Age Bracket | Male | Female |
| 5 to 17 Years | 262 (10.0%) | 82 (3.4%) |
| 18 to 34 Years | 237 (9.1%) | 129 (4.3%) |
| 35 to 64 Years | 336 (7.7%) | 401 (8.1%) |
| 65 to 74 Years | 109 (9.1%) | 88 (5.5%) |
| 75 Years and over | 40 (4.6%) | 56 (3.7%) |
Disability Class: Ambulatory Difficulty
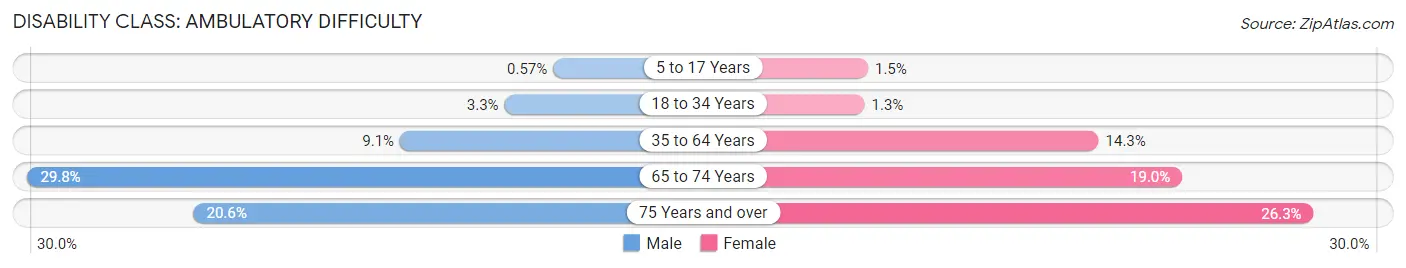
| Age Bracket | Male | Female |
| 5 to 17 Years | 15 (0.6%) | 35 (1.5%) |
| 18 to 34 Years | 85 (3.3%) | 38 (1.3%) |
| 35 to 64 Years | 398 (9.1%) | 709 (14.3%) |
| 65 to 74 Years | 359 (29.8%) | 303 (19.0%) |
| 75 Years and over | 180 (20.6%) | 392 (26.3%) |
Disability Class: Self-Care Difficulty
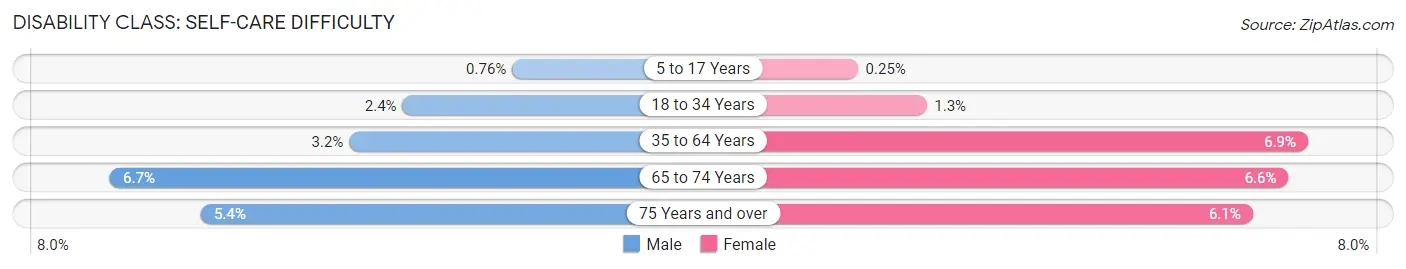
| Age Bracket | Male | Female |
| 5 to 17 Years | 20 (0.8%) | 6 (0.3%) |
| 18 to 34 Years | 62 (2.4%) | 38 (1.3%) |
| 35 to 64 Years | 139 (3.2%) | 343 (6.9%) |
| 65 to 74 Years | 81 (6.7%) | 106 (6.6%) |
| 75 Years and over | 47 (5.4%) | 91 (6.1%) |
Technology Access in Danville
Computing Device Access in Danville
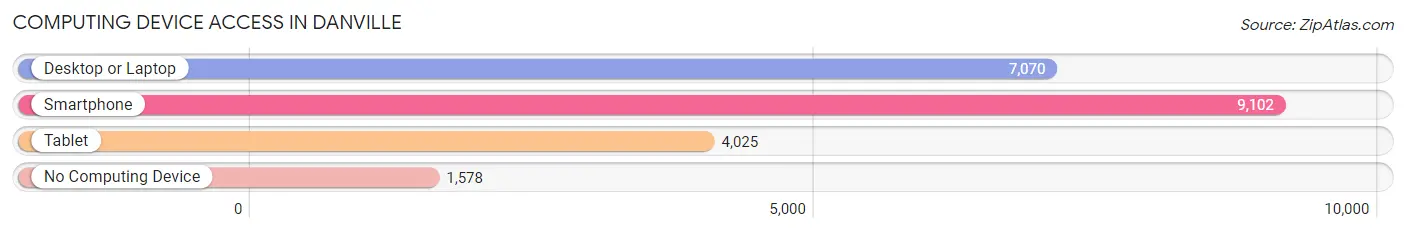
| Device Type | # Households | % Households |
| Desktop or Laptop | 7,070 | 61.3% |
| Smartphone | 9,102 | 78.9% |
| Tablet | 4,025 | 34.9% |
| No Computing Device | 1,578 | 13.7% |
| Total | 11,536 | 100.0% |
Internet Access in Danville
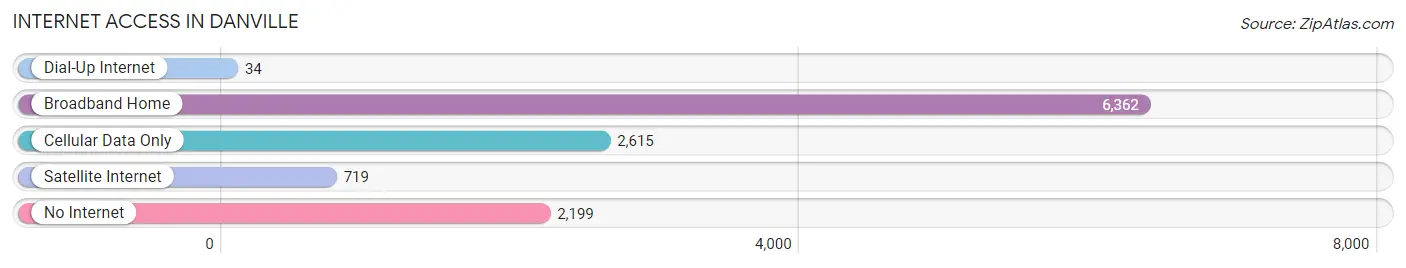
| Internet Type | # Households | % Households |
| Dial-Up Internet | 34 | 0.3% |
| Broadband Home | 6,362 | 55.1% |
| Cellular Data Only | 2,615 | 22.7% |
| Satellite Internet | 719 | 6.2% |
| No Internet | 2,199 | 19.1% |
| Total | 11,536 | 100.0% |
Danville Summary
Danville, Illinois is a city located in Vermilion County, Illinois, United States. It is the county seat of Vermilion County and is located along the North Fork of the Vermilion River. As of the 2010 census, the city had a population of 33,027.
History
The area of Danville was first settled in 1827 by William and Jane Ross. The Rosses named the settlement after their hometown of Danville, Kentucky. The town was officially incorporated in 1845.
During the Civil War, Danville served as a major supply center for the Union Army. The city was also the site of a major prisoner of war camp, Camp Douglas, which held up to 10,000 Confederate soldiers.
In the late 19th century, Danville became a major industrial center, with several coal mines, steel mills, and other factories. The city was also home to the Danville Railway and Coal Company, which operated a large rail yard and coal mine.
Geography
Danville is located in east-central Illinois, about 90 miles south of Chicago. It is situated along the North Fork of the Vermilion River, which flows through the city. The city has a total area of 16.2 square miles, of which 16.1 square miles is land and 0.1 square miles is water.
The city is located in the Tama Hills region of Illinois, which is characterized by rolling hills and wooded areas. The city is also located near the Vermilion River State Park, which offers a variety of outdoor activities, including fishing, camping, and hiking.
Economy
Danville has a diverse economy, with a mix of manufacturing, retail, and service industries. The city is home to several major employers, including Procter & Gamble, Kraft Foods, and Wal-Mart.
The city is also home to several higher education institutions, including Danville Area Community College, Lakeview College of Nursing, and the University of Illinois College of Medicine at Danville.
Demographics
As of the 2010 census, there were 33,027 people, 12,945 households, and 8,072 families residing in the city. The population density was 2,039.2 people per square mile. The racial makeup of the city was 79.2% White, 15.7% African American, 0.3% Native American, 0.7% Asian, 0.1% Pacific Islander, 1.7% from other races, and 2.1% from two or more races. Hispanic or Latino of any race were 4.2% of the population.
The median income for a household in the city was $37,837, and the median income for a family was $45,919. The per capita income for the city was $19,945. About 14.2% of families and 17.3% of the population were below the poverty line, including 25.2% of those under age 18 and 8.2% of those age 65 or over.
Common Questions
What is Per Capita Income in Danville?
Per Capita income in Danville is $24,786.
What is the Median Family Income in Danville?
Median Family Income in Danville is $53,493.
What is the Median Household income in Danville?
Median Household Income in Danville is $42,424.
What is Income or Wage Gap in Danville?
Income or Wage Gap in Danville is 27.6%.
Women in Danville earn 72.4 cents for every dollar earned by a man.
What is Family Income Deficit in Danville?
Family Income Deficit in Danville is $11,597.
Families that are below poverty line in Danville earn $11,597 less on average than the poverty threshold level.
What is Inequality or Gini Index in Danville?
Inequality or Gini Index in Danville is 0.47.
What is the Total Population of Danville?
Total Population of Danville is 29,100.
What is the Total Male Population of Danville?
Total Male Population of Danville is 14,666.
What is the Total Female Population of Danville?
Total Female Population of Danville is 14,434.
What is the Ratio of Males per 100 Females in Danville?
There are 101.61 Males per 100 Females in Danville.
What is the Ratio of Females per 100 Males in Danville?
There are 98.42 Females per 100 Males in Danville.
What is the Median Population Age in Danville?
Median Population Age in Danville is 38.6 Years.
What is the Average Family Size in Danville
Average Family Size in Danville is 3.2 People.
What is the Average Household Size in Danville
Average Household Size in Danville is 2.3 People.
How Large is the Labor Force in Danville?
There are 11,472 People in the Labor Forcein in Danville.
What is the Percentage of People in the Labor Force in Danville?
50.4% of People are in the Labor Force in Danville.
What is the Unemployment Rate in Danville?
Unemployment Rate in Danville is 9.2%.