Cities with the Highest Percentage of Federal Government Employees in Illinois
RELATED REPORTS & OPTIONS
Federal Government Employees
Illinois
Compare Cities
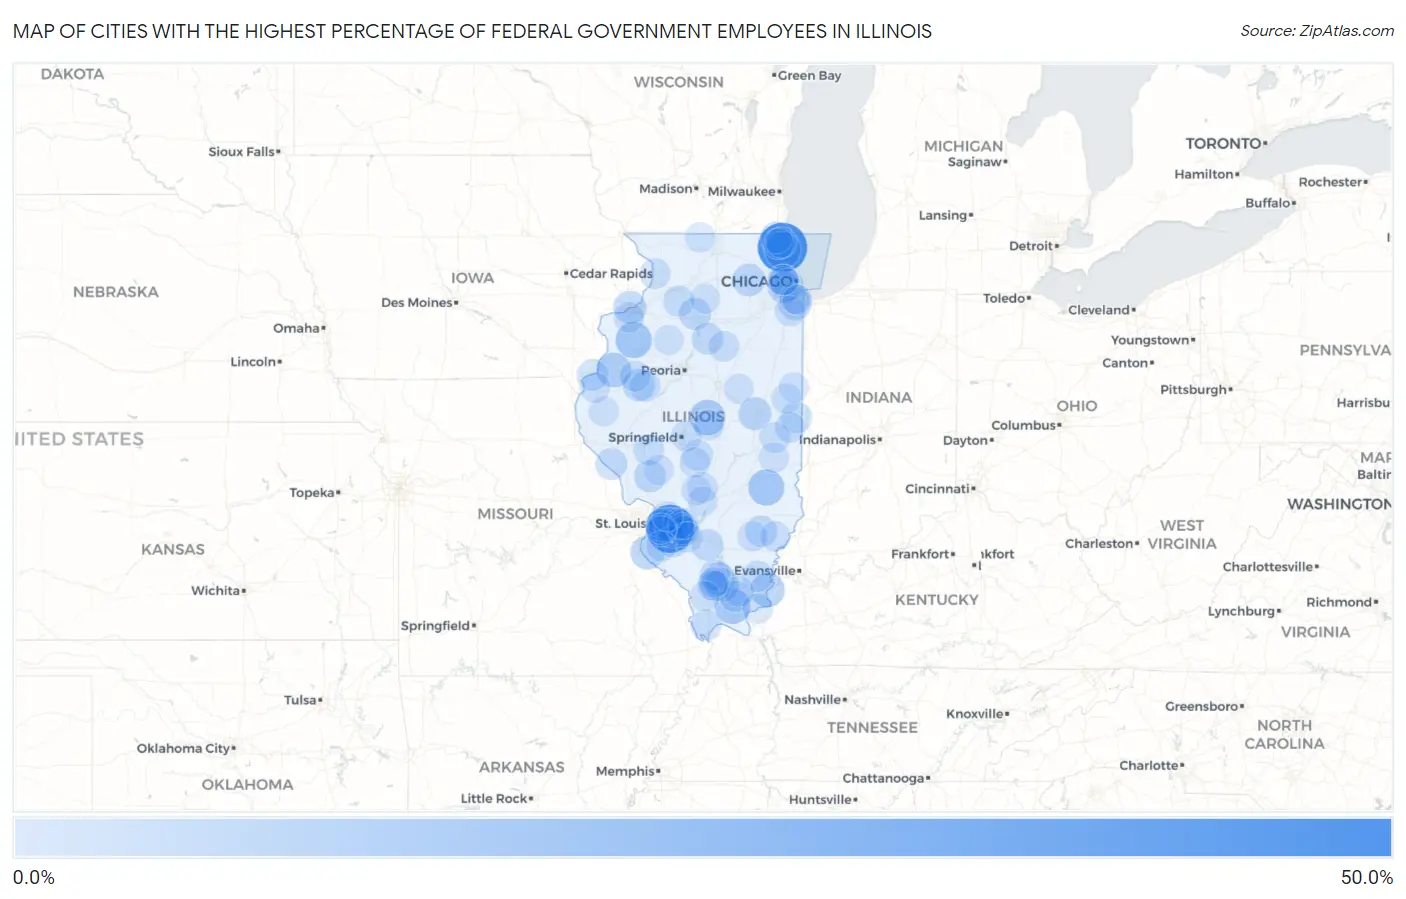
Map of Cities with the Highest Percentage of Federal Government Employees in Illinois
0.0%
50.0%
Cities with the Highest Percentage of Federal Government Employees in Illinois
| City | % Federal Government Employees | vs State | vs National | |
| 1. | North Chicago | 49.5% | 2.1%(+47.4)#1 | 3.4%(+46.1)#180 |
| 2. | Scott Afb | 46.1% | 2.1%(+43.9)#2 | 3.4%(+42.7)#201 |
| 3. | Merritt | 23.5% | 2.1%(+21.4)#3 | 3.4%(+20.2)#632 |
| 4. | Knollwood | 19.7% | 2.1%(+17.6)#4 | 3.4%(+16.3)#856 |
| 5. | Gulfport | 19.6% | 2.1%(+17.4)#5 | 3.4%(+16.2)#869 |
| 6. | North Henderson | 19.2% | 2.1%(+17.1)#6 | 3.4%(+15.9)#892 |
| 7. | Edgington | 18.9% | 2.1%(+16.7)#7 | 3.4%(+15.5)#925 |
| 8. | Rose Hill | 18.8% | 2.1%(+16.6)#8 | 3.4%(+15.4)#939 |
| 9. | Simpson | 17.9% | 2.1%(+15.7)#9 | 3.4%(+14.5)#997 |
| 10. | Shiloh | 17.8% | 2.1%(+15.7)#10 | 3.4%(+14.5)#1,000 |
| 11. | Chestnut | 17.5% | 2.1%(+15.4)#11 | 3.4%(+14.1)#1,035 |
| 12. | Raritan | 16.1% | 2.1%(+13.9)#12 | 3.4%(+12.7)#1,168 |
| 13. | New Baden | 15.7% | 2.1%(+13.5)#13 | 3.4%(+12.3)#1,221 |
| 14. | O Fallon | 15.4% | 2.1%(+13.3)#14 | 3.4%(+12.1)#1,241 |
| 15. | Old Shawneetown | 15.4% | 2.1%(+13.2)#15 | 3.4%(+12.0)#1,248 |
| 16. | Rockport | 14.3% | 2.1%(+12.1)#16 | 3.4%(+10.9)#1,386 |
| 17. | Maeystown | 14.3% | 2.1%(+12.1)#17 | 3.4%(+10.9)#1,388 |
| 18. | Mascoutah | 13.7% | 2.1%(+11.5)#18 | 3.4%(+10.3)#1,478 |
| 19. | Lebanon | 13.2% | 2.1%(+11.1)#19 | 3.4%(+9.85)#1,543 |
| 20. | Spillertown | 12.8% | 2.1%(+10.6)#20 | 3.4%(+9.37)#1,617 |
| 21. | Cable | 12.5% | 2.1%(+10.4)#21 | 3.4%(+9.12)#1,662 |
| 22. | Rock Island Arsenal | 12.3% | 2.1%(+10.1)#22 | 3.4%(+8.89)#1,707 |
| 23. | Bondville | 11.8% | 2.1%(+9.62)#23 | 3.4%(+8.39)#1,798 |
| 24. | Prairietown | 11.7% | 2.1%(+9.55)#24 | 3.4%(+8.32)#1,819 |
| 25. | Freeman Spur | 11.5% | 2.1%(+9.39)#25 | 3.4%(+8.16)#1,850 |
| 26. | East Hazel Crest | 11.4% | 2.1%(+9.29)#26 | 3.4%(+8.06)#1,871 |
| 27. | Elburn | 11.4% | 2.1%(+9.27)#27 | 3.4%(+8.03)#1,877 |
| 28. | Marietta | 11.1% | 2.1%(+8.97)#28 | 3.4%(+7.73)#1,947 |
| 29. | Stickney | 10.9% | 2.1%(+8.78)#29 | 3.4%(+7.54)#1,981 |
| 30. | Osco | 10.7% | 2.1%(+8.57)#30 | 3.4%(+7.34)#2,032 |
| 31. | Fairview Heights | 10.5% | 2.1%(+8.31)#31 | 3.4%(+7.07)#2,089 |
| 32. | Dover | 10.3% | 2.1%(+8.11)#32 | 3.4%(+6.88)#2,141 |
| 33. | Rockbridge | 10.2% | 2.1%(+8.06)#33 | 3.4%(+6.83)#2,155 |
| 34. | Mccook | 10.0% | 2.1%(+7.86)#34 | 3.4%(+6.62)#2,204 |
| 35. | Fayetteville | 9.9% | 2.1%(+7.74)#35 | 3.4%(+6.51)#2,236 |
| 36. | Ashley | 9.9% | 2.1%(+7.72)#36 | 3.4%(+6.48)#2,241 |
| 37. | Pleasant Hill | 9.8% | 2.1%(+7.63)#37 | 3.4%(+6.40)#2,263 |
| 38. | Magnolia | 9.4% | 2.1%(+7.27)#38 | 3.4%(+6.03)#2,376 |
| 39. | Mount Erie | 9.4% | 2.1%(+7.23)#39 | 3.4%(+6.00)#2,387 |
| 40. | Alvan | 9.2% | 2.1%(+7.05)#40 | 3.4%(+5.82)#2,459 |
| 41. | Old Mill Creek | 9.1% | 2.1%(+6.95)#41 | 3.4%(+5.71)#2,494 |
| 42. | Belgium | 8.9% | 2.1%(+6.75)#42 | 3.4%(+5.51)#2,558 |
| 43. | Pontoosuc | 8.8% | 2.1%(+6.68)#43 | 3.4%(+5.45)#2,584 |
| 44. | Langleyville | 8.4% | 2.1%(+6.27)#44 | 3.4%(+5.03)#2,754 |
| 45. | Lowpoint | 8.3% | 2.1%(+6.19)#45 | 3.4%(+4.96)#2,788 |
| 46. | Deer Grove | 8.3% | 2.1%(+6.19)#46 | 3.4%(+4.96)#2,796 |
| 47. | Omaha | 8.2% | 2.1%(+6.09)#47 | 3.4%(+4.86)#2,825 |
| 48. | Stonefort | 8.1% | 2.1%(+5.94)#48 | 3.4%(+4.71)#2,889 |
| 49. | Woodson | 7.9% | 2.1%(+5.72)#49 | 3.4%(+4.49)#2,959 |
| 50. | Smithfield | 7.8% | 2.1%(+5.67)#50 | 3.4%(+4.43)#2,985 |
| 51. | Broadview | 7.8% | 2.1%(+5.65)#51 | 3.4%(+4.42)#2,995 |
| 52. | Albers | 7.7% | 2.1%(+5.55)#52 | 3.4%(+4.31)#3,024 |
| 53. | Thomson | 7.7% | 2.1%(+5.55)#53 | 3.4%(+4.31)#3,025 |
| 54. | Zeigler | 7.7% | 2.1%(+5.51)#54 | 3.4%(+4.28)#3,051 |
| 55. | Newman | 7.6% | 2.1%(+5.44)#55 | 3.4%(+4.21)#3,084 |
| 56. | Damiansville | 7.5% | 2.1%(+5.38)#56 | 3.4%(+4.15)#3,107 |
| 57. | Pulaski | 7.5% | 2.1%(+5.36)#57 | 3.4%(+4.12)#3,118 |
| 58. | Bellwood | 7.5% | 2.1%(+5.35)#58 | 3.4%(+4.12)#3,126 |
| 59. | Trenton | 7.5% | 2.1%(+5.32)#59 | 3.4%(+4.08)#3,144 |
| 60. | Fillmore | 7.3% | 2.1%(+5.17)#60 | 3.4%(+3.94)#3,211 |
| 61. | Crainville | 7.3% | 2.1%(+5.16)#61 | 3.4%(+3.93)#3,219 |
| 62. | Prairie City | 7.3% | 2.1%(+5.16)#62 | 3.4%(+3.92)#3,223 |
| 63. | Clear Lake | 7.3% | 2.1%(+5.16)#63 | 3.4%(+3.92)#3,224 |
| 64. | Indianola | 7.2% | 2.1%(+5.10)#64 | 3.4%(+3.87)#3,250 |
| 65. | Aviston | 7.1% | 2.1%(+5.01)#65 | 3.4%(+3.77)#3,291 |
| 66. | Long Point | 7.1% | 2.1%(+5.00)#66 | 3.4%(+3.77)#3,299 |
| 67. | Okawville | 7.0% | 2.1%(+4.86)#67 | 3.4%(+3.62)#3,392 |
| 68. | Carrier Mills | 6.8% | 2.1%(+4.66)#68 | 3.4%(+3.43)#3,506 |
| 69. | Latham | 6.7% | 2.1%(+4.60)#69 | 3.4%(+3.37)#3,541 |
| 70. | Jeffersonville | 6.7% | 2.1%(+4.58)#70 | 3.4%(+3.34)#3,549 |
| 71. | Palmer | 6.7% | 2.1%(+4.58)#71 | 3.4%(+3.34)#3,550 |
| 72. | Troy | 6.7% | 2.1%(+4.55)#72 | 3.4%(+3.31)#3,564 |
| 73. | Coyne Center | 6.6% | 2.1%(+4.46)#73 | 3.4%(+3.22)#3,611 |
| 74. | Gurnee | 6.6% | 2.1%(+4.42)#74 | 3.4%(+3.18)#3,636 |
| 75. | Elizabethtown | 6.5% | 2.1%(+4.38)#75 | 3.4%(+3.14)#3,668 |
| 76. | Plum Valley | 6.5% | 2.1%(+4.37)#76 | 3.4%(+3.13)#3,675 |
| 77. | Richton Park | 6.5% | 2.1%(+4.34)#77 | 3.4%(+3.10)#3,686 |
| 78. | Carterville | 6.4% | 2.1%(+4.29)#78 | 3.4%(+3.05)#3,715 |
| 79. | Riverdale | 6.4% | 2.1%(+4.24)#79 | 3.4%(+3.01)#3,743 |
| 80. | Bone Gap | 6.3% | 2.1%(+4.21)#80 | 3.4%(+2.97)#3,767 |
| 81. | Ferris | 6.3% | 2.1%(+4.21)#81 | 3.4%(+2.97)#3,769 |
| 82. | Hecker | 6.3% | 2.1%(+4.19)#82 | 3.4%(+2.96)#3,776 |
| 83. | Waukegan | 6.3% | 2.1%(+4.14)#83 | 3.4%(+2.90)#3,815 |
| 84. | Potomac | 6.3% | 2.1%(+4.13)#84 | 3.4%(+2.89)#3,818 |
| 85. | Hoopeston | 6.3% | 2.1%(+4.13)#85 | 3.4%(+2.89)#3,819 |
| 86. | Ashmore | 6.2% | 2.1%(+4.11)#86 | 3.4%(+2.87)#3,830 |
| 87. | Coffeen | 6.2% | 2.1%(+4.11)#87 | 3.4%(+2.87)#3,832 |
| 88. | La Prairie | 6.2% | 2.1%(+4.11)#88 | 3.4%(+2.87)#3,846 |
| 89. | Toulon | 6.2% | 2.1%(+4.09)#89 | 3.4%(+2.86)#3,855 |
| 90. | Maywood | 6.2% | 2.1%(+4.09)#90 | 3.4%(+2.85)#3,857 |
| 91. | Belleville | 6.1% | 2.1%(+3.99)#91 | 3.4%(+2.76)#3,920 |
| 92. | Durand | 6.1% | 2.1%(+3.99)#92 | 3.4%(+2.75)#3,922 |
| 93. | Swansea | 6.1% | 2.1%(+3.98)#93 | 3.4%(+2.75)#3,929 |
| 94. | Sublette | 6.1% | 2.1%(+3.98)#94 | 3.4%(+2.74)#3,934 |
| 95. | Makanda | 6.1% | 2.1%(+3.96)#95 | 3.4%(+2.73)#3,954 |
| 96. | Arrowsmith | 6.1% | 2.1%(+3.92)#96 | 3.4%(+2.68)#3,986 |
| 97. | Hettick | 6.1% | 2.1%(+3.92)#97 | 3.4%(+2.68)#3,991 |
| 98. | Dolton | 6.0% | 2.1%(+3.90)#98 | 3.4%(+2.66)#3,997 |
| 99. | Mulberry Grove | 6.0% | 2.1%(+3.84)#99 | 3.4%(+2.61)#4,049 |
| 100. | Colp | 6.0% | 2.1%(+3.83)#100 | 3.4%(+2.59)#4,061 |
Common Questions
What are the Top 10 Cities with the Highest Percentage of Federal Government Employees in Illinois?
Top 10 Cities with the Highest Percentage of Federal Government Employees in Illinois are:
#1
49.5%
#2
46.1%
#3
19.7%
#4
19.2%
#5
18.8%
#6
17.9%
#7
17.8%
#8
17.5%
#9
16.1%
#10
15.7%
What city has the Highest Percentage of Federal Government Employees in Illinois?
North Chicago has the Highest Percentage of Federal Government Employees in Illinois with 49.5%.
What is the Percentage of Federal Government Employees in the State of Illinois?
Percentage of Federal Government Employees in Illinois is 2.1%.
What is the Percentage of Federal Government Employees in the United States?
Percentage of Federal Government Employees in the United States is 3.4%.