Elburn, IL Map & Demographics
Elburn Map
Elburn Overview
$47,332
PER CAPITA INCOME
$118,816
AVG FAMILY INCOME
$106,347
AVG HOUSEHOLD INCOME
44.2%
WAGE / INCOME GAP [ % ]
55.8¢/ $1
WAGE / INCOME GAP [ $ ]
0.38
INEQUALITY / GINI INDEX
5,958
TOTAL POPULATION
3,143
MALE POPULATION
2,815
FEMALE POPULATION
111.65
MALES / 100 FEMALES
89.56
FEMALES / 100 MALES
37.3
MEDIAN AGE
3.1
AVG FAMILY SIZE
2.8
AVG HOUSEHOLD SIZE
2,964
LABOR FORCE [ PEOPLE ]
67.6%
PERCENT IN LABOR FORCE
0.4%
UNEMPLOYMENT RATE
Elburn Zip Codes
Income in Elburn
Income Overview in Elburn
Per Capita Income in Elburn is $47,332, while median incomes of families and households are $118,816 and $106,347 respectively.
| Characteristic | Number | Measure |
| Per Capita Income | 5,958 | $47,332 |
| Median Family Income | 1,628 | $118,816 |
| Mean Family Income | 1,628 | $151,829 |
| Median Household Income | 2,122 | $106,347 |
| Mean Household Income | 2,122 | $132,125 |
| Income Deficit | 1,628 | $0 |
| Wage / Income Gap (%) | 5,958 | 44.22% |
| Wage / Income Gap ($) | 5,958 | 55.78¢ per $1 |
| Gini / Inequality Index | 5,958 | 0.38 |
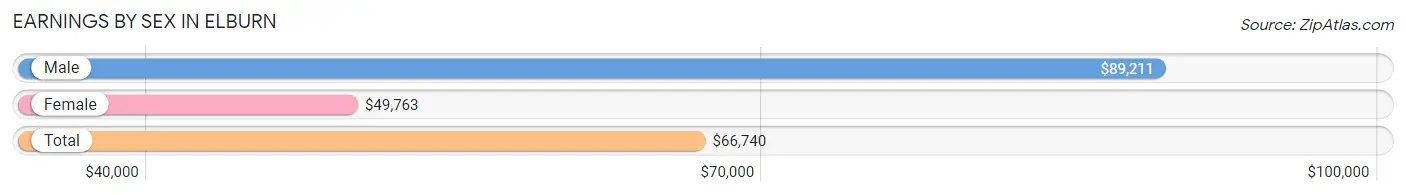
Earnings by Sex in Elburn
Average Earnings in Elburn are $66,740, $89,211 for men and $49,763 for women, a difference of 44.2%.
| Sex | Number | Average Earnings |
| Male | 1,604 (51.1%) | $89,211 |
| Female | 1,535 (48.9%) | $49,763 |
| Total | 3,139 (100.0%) | $66,740 |
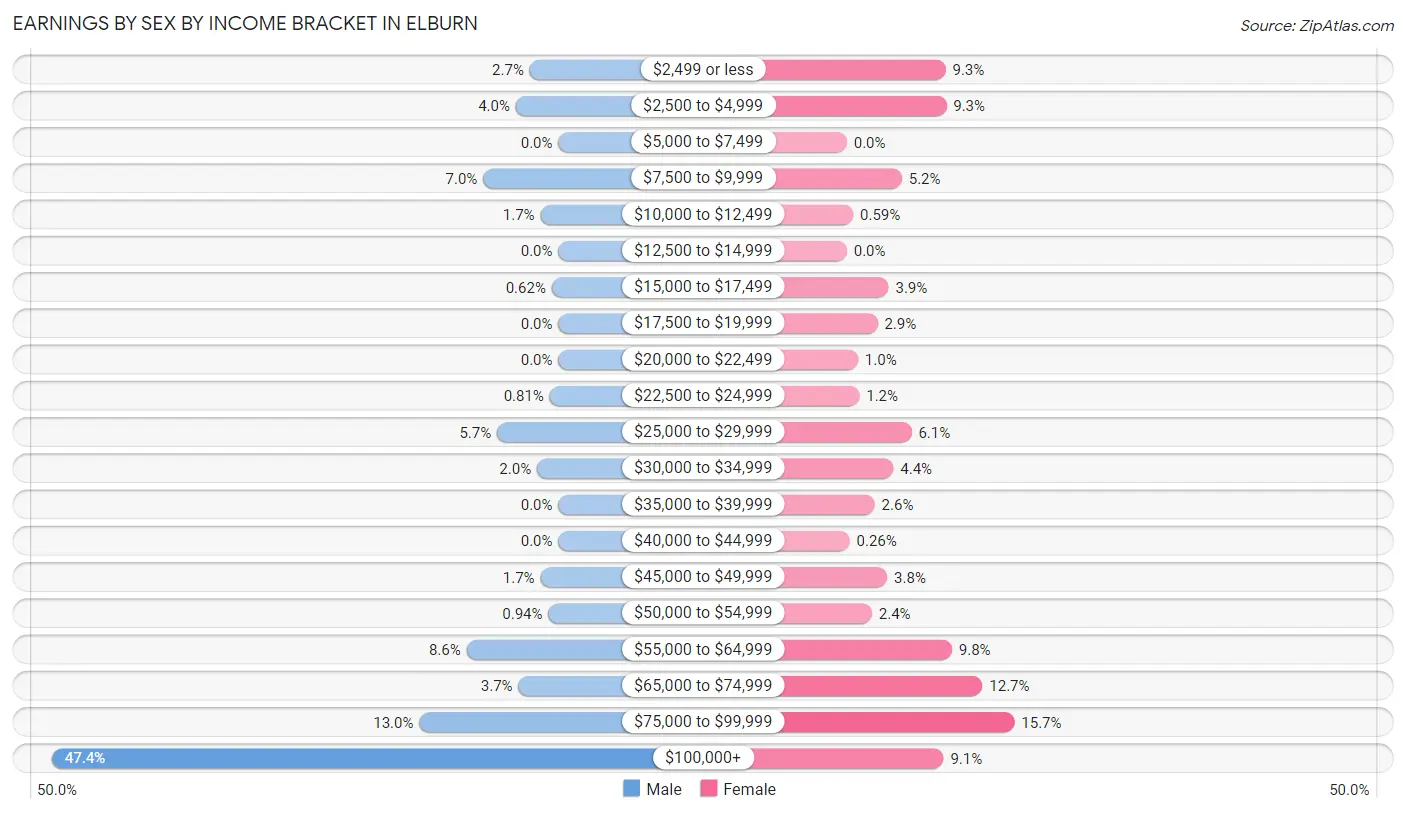
Earnings by Sex by Income Bracket in Elburn
The most common earnings brackets in Elburn are $100,000+ for men (761 | 47.4%) and $75,000 to $99,999 for women (241 | 15.7%).
| Income | Male | Female |
| $2,499 or less | 43 (2.7%) | 142 (9.2%) |
| $2,500 to $4,999 | 64 (4.0%) | 143 (9.3%) |
| $5,000 to $7,499 | 0 (0.0%) | 0 (0.0%) |
| $7,500 to $9,999 | 113 (7.0%) | 79 (5.1%) |
| $10,000 to $12,499 | 27 (1.7%) | 9 (0.6%) |
| $12,500 to $14,999 | 0 (0.0%) | 0 (0.0%) |
| $15,000 to $17,499 | 10 (0.6%) | 60 (3.9%) |
| $17,500 to $19,999 | 0 (0.0%) | 44 (2.9%) |
| $20,000 to $22,499 | 0 (0.0%) | 16 (1.0%) |
| $22,500 to $24,999 | 13 (0.8%) | 18 (1.2%) |
| $25,000 to $29,999 | 92 (5.7%) | 93 (6.1%) |
| $30,000 to $34,999 | 32 (2.0%) | 67 (4.4%) |
| $35,000 to $39,999 | 0 (0.0%) | 40 (2.6%) |
| $40,000 to $44,999 | 0 (0.0%) | 4 (0.3%) |
| $45,000 to $49,999 | 27 (1.7%) | 58 (3.8%) |
| $50,000 to $54,999 | 15 (0.9%) | 36 (2.4%) |
| $55,000 to $64,999 | 138 (8.6%) | 151 (9.8%) |
| $65,000 to $74,999 | 60 (3.7%) | 195 (12.7%) |
| $75,000 to $99,999 | 209 (13.0%) | 241 (15.7%) |
| $100,000+ | 761 (47.4%) | 139 (9.1%) |
| Total | 1,604 (100.0%) | 1,535 (100.0%) |
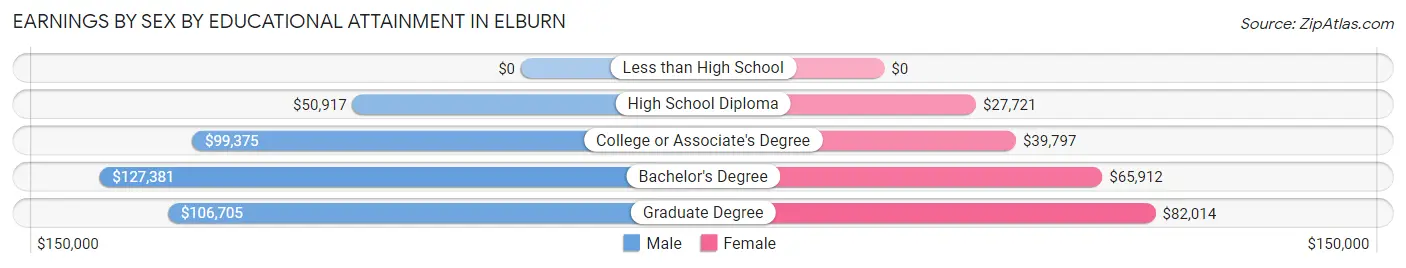
Earnings by Sex by Educational Attainment in Elburn
Average earnings in Elburn are $100,752 for men and $56,606 for women, a difference of 43.8%. Men with an educational attainment of bachelor's degree enjoy the highest average annual earnings of $127,381, while those with high school diploma education earn the least with $50,917. Women with an educational attainment of graduate degree earn the most with the average annual earnings of $82,014, while those with high school diploma education have the smallest earnings of $27,721.
| Educational Attainment | Male Income | Female Income |
| Less than High School | - | - |
| High School Diploma | $50,917 | $27,721 |
| College or Associate's Degree | $99,375 | $39,797 |
| Bachelor's Degree | $127,381 | $65,912 |
| Graduate Degree | $106,705 | $82,014 |
| Total | $100,752 | $56,606 |
Family Income in Elburn
Family Income Brackets in Elburn
According to the Elburn family income data, there are 409 families falling into the $100,000 to $149,999 income range, which is the most common income bracket and makes up 25.1% of all families.
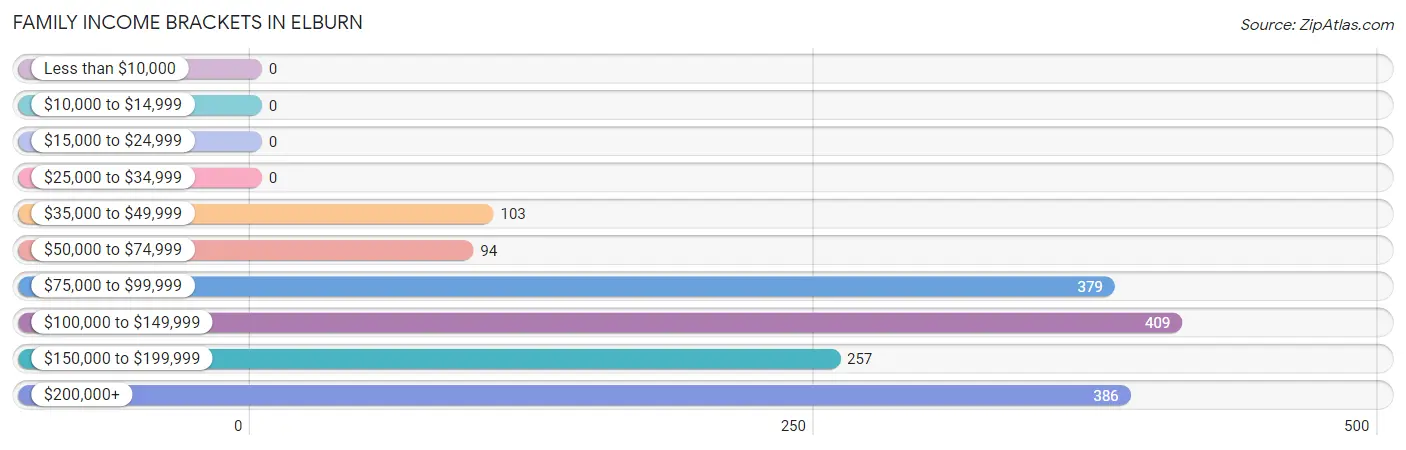
| Income Bracket | # Families | % Families |
| Less than $10,000 | 0 | 0.0% |
| $10,000 to $14,999 | 0 | 0.0% |
| $15,000 to $24,999 | 0 | 0.0% |
| $25,000 to $34,999 | 0 | 0.0% |
| $35,000 to $49,999 | 103 | 6.3% |
| $50,000 to $74,999 | 94 | 5.8% |
| $75,000 to $99,999 | 379 | 23.3% |
| $100,000 to $149,999 | 409 | 25.1% |
| $150,000 to $199,999 | 257 | 15.8% |
| $200,000+ | 386 | 23.7% |
Family Income by Famaliy Size in Elburn
3-person families (356 | 21.9%) account for the highest median family income in Elburn with $187,143 per family, while 3-person families (356 | 21.9%) have the highest median income of $62,381 per family member.
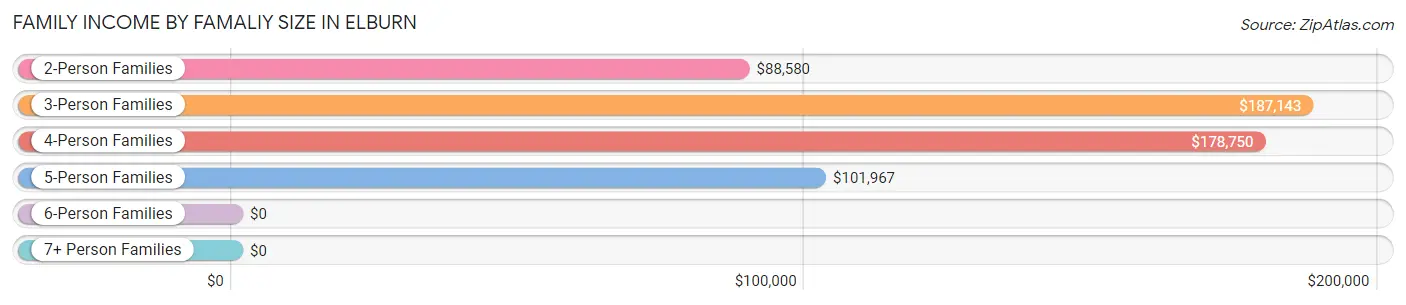
| Income Bracket | # Families | Median Income |
| 2-Person Families | 687 (42.2%) | $88,580 |
| 3-Person Families | 356 (21.9%) | $187,143 |
| 4-Person Families | 324 (19.9%) | $178,750 |
| 5-Person Families | 225 (13.8%) | $101,967 |
| 6-Person Families | 36 (2.2%) | $0 |
| 7+ Person Families | 0 (0.0%) | $0 |
| Total | 1,628 (100.0%) | $118,816 |
Family Income by Number of Earners in Elburn
The median family income in Elburn is $118,816, with families comprising 3+ earners (276) having the highest median family income of $208,690, while families with no earners (214) have the lowest median family income of $89,268, accounting for 17.0% and 13.1% of families, respectively.
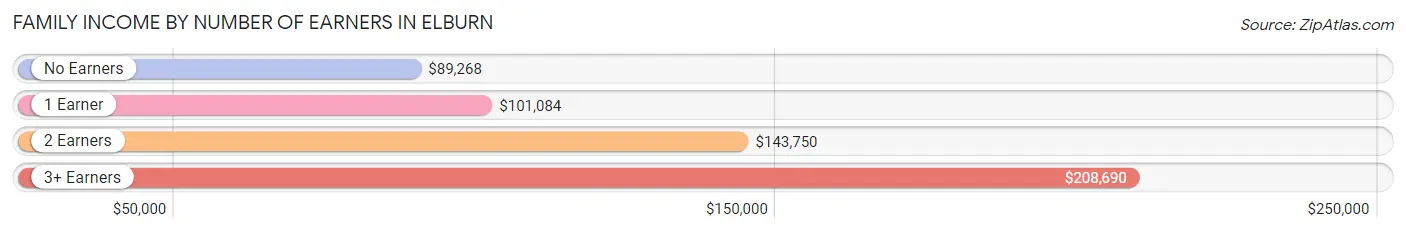
| Number of Earners | # Families | Median Income |
| No Earners | 214 (13.1%) | $89,268 |
| 1 Earner | 442 (27.2%) | $101,084 |
| 2 Earners | 696 (42.7%) | $143,750 |
| 3+ Earners | 276 (17.0%) | $208,690 |
| Total | 1,628 (100.0%) | $118,816 |
Household Income in Elburn
Household Income Brackets in Elburn
With 484 households falling in the category, the $100,000 to $149,999 income range is the most frequent in Elburn, accounting for 22.8% of all households. In contrast, only 21 households (1.0%) fall into the $15,000 to $24,999 income bracket, making it the least populous group.
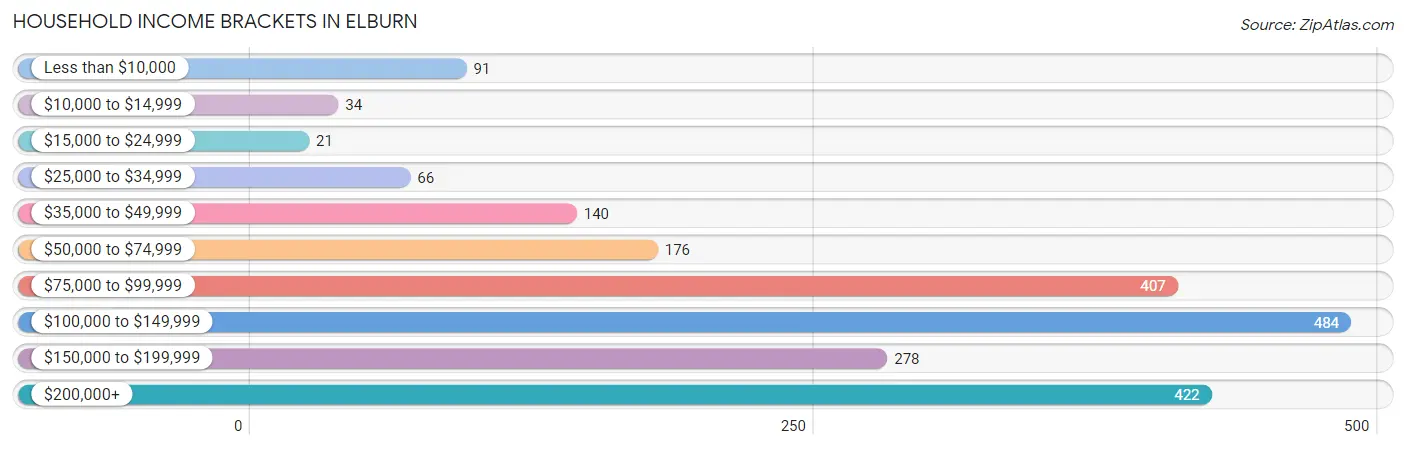
| Income Bracket | # Households | % Households |
| Less than $10,000 | 91 | 4.3% |
| $10,000 to $14,999 | 34 | 1.6% |
| $15,000 to $24,999 | 21 | 1.0% |
| $25,000 to $34,999 | 66 | 3.1% |
| $35,000 to $49,999 | 140 | 6.6% |
| $50,000 to $74,999 | 176 | 8.3% |
| $75,000 to $99,999 | 407 | 19.2% |
| $100,000 to $149,999 | 484 | 22.8% |
| $150,000 to $199,999 | 278 | 13.1% |
| $200,000+ | 422 | 19.9% |
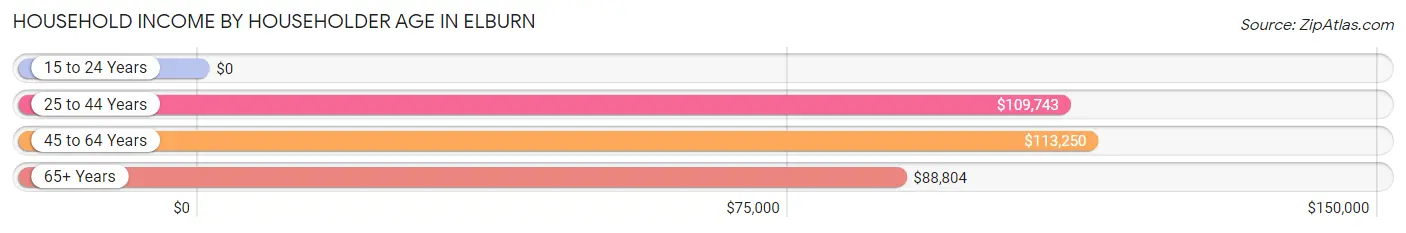
Household Income by Householder Age in Elburn
The median household income in Elburn is $106,347, with the highest median household income of $113,250 found in the 45 to 64 years age bracket for the primary householder. A total of 935 households (44.1%) fall into this category.
| Income Bracket | # Households | Median Income |
| 15 to 24 Years | 0 (0.0%) | $0 |
| 25 to 44 Years | 653 (30.8%) | $109,743 |
| 45 to 64 Years | 935 (44.1%) | $113,250 |
| 65+ Years | 534 (25.2%) | $88,804 |
| Total | 2,122 (100.0%) | $106,347 |
Poverty in Elburn
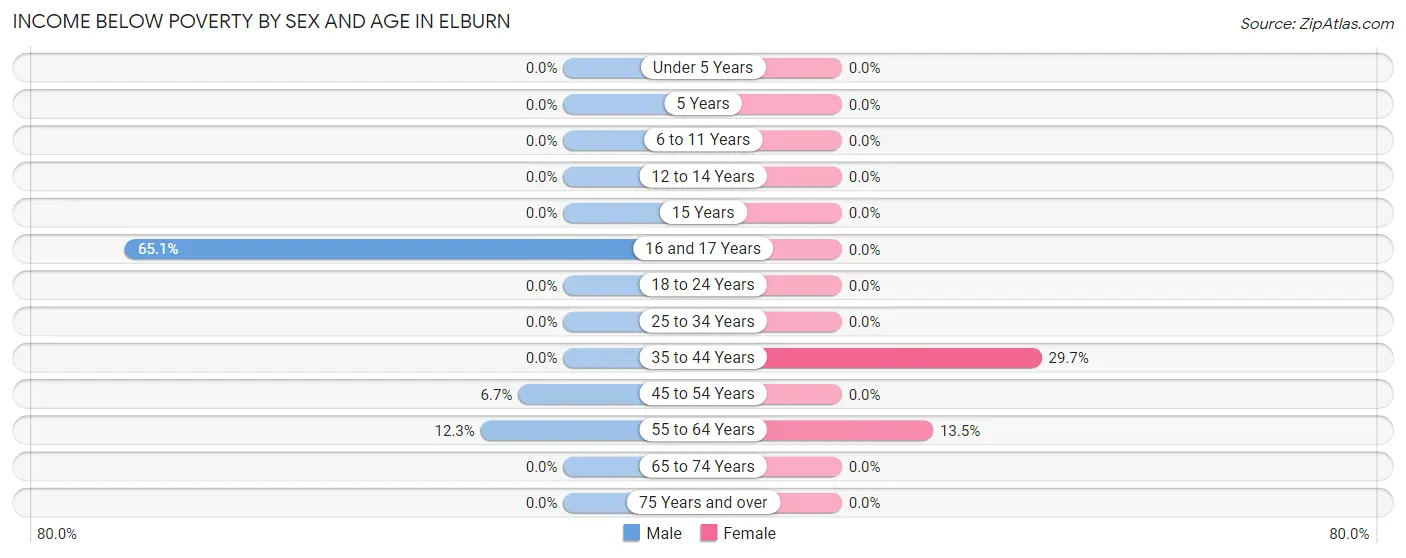
Income Below Poverty by Sex and Age in Elburn
With 7.2% poverty level for males and 6.8% for females among the residents of Elburn, 16 and 17 year old males and 35 to 44 year old females are the most vulnerable to poverty, with 151 males (65.1%) and 143 females (29.7%) in their respective age groups living below the poverty level.
| Age Bracket | Male | Female |
| Under 5 Years | 0 (0.0%) | 0 (0.0%) |
| 5 Years | 0 (0.0%) | 0 (0.0%) |
| 6 to 11 Years | 0 (0.0%) | 0 (0.0%) |
| 12 to 14 Years | 0 (0.0%) | 0 (0.0%) |
| 15 Years | 0 (0.0%) | 0 (0.0%) |
| 16 and 17 Years | 151 (65.1%) | 0 (0.0%) |
| 18 to 24 Years | 0 (0.0%) | 0 (0.0%) |
| 25 to 34 Years | 0 (0.0%) | 0 (0.0%) |
| 35 to 44 Years | 0 (0.0%) | 143 (29.7%) |
| 45 to 54 Years | 26 (6.7%) | 0 (0.0%) |
| 55 to 64 Years | 51 (12.3%) | 49 (13.5%) |
| 65 to 74 Years | 0 (0.0%) | 0 (0.0%) |
| 75 Years and over | 0 (0.0%) | 0 (0.0%) |
| Total | 228 (7.2%) | 192 (6.8%) |
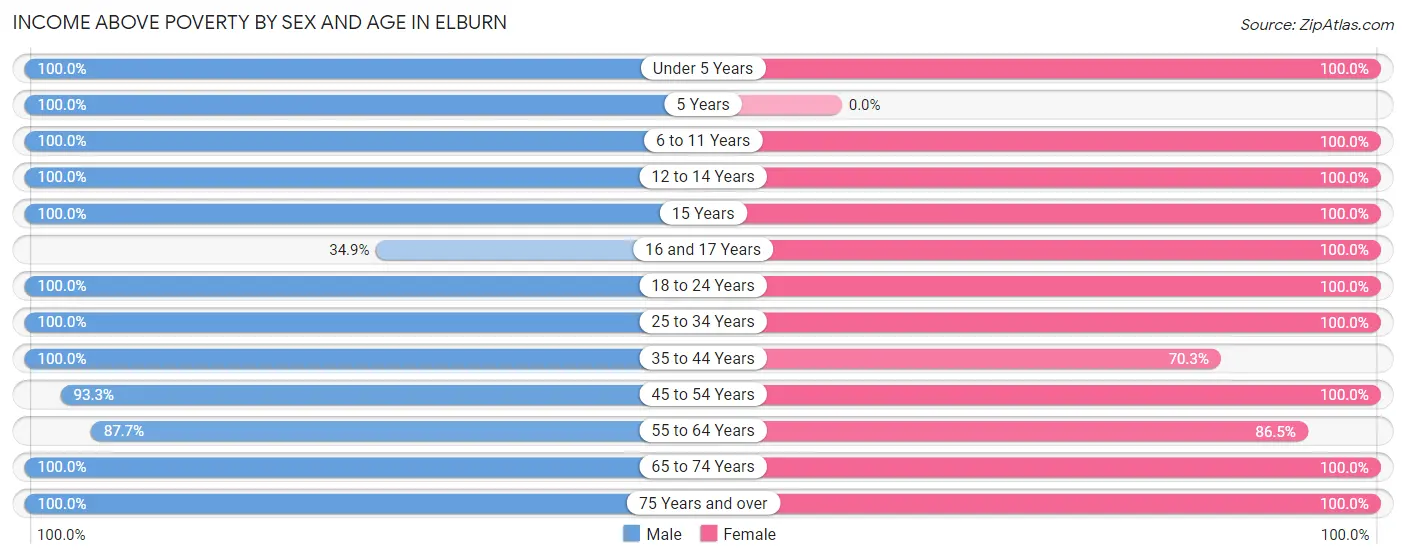
Income Above Poverty by Sex and Age in Elburn
According to the poverty statistics in Elburn, males aged under 5 years and females aged under 5 years are the age groups that are most secure financially, with 100.0% of males and 100.0% of females in these age groups living above the poverty line.
| Age Bracket | Male | Female |
| Under 5 Years | 37 (100.0%) | 165 (100.0%) |
| 5 Years | 44 (100.0%) | 0 (0.0%) |
| 6 to 11 Years | 744 (100.0%) | 292 (100.0%) |
| 12 to 14 Years | 79 (100.0%) | 66 (100.0%) |
| 15 Years | 51 (100.0%) | 96 (100.0%) |
| 16 and 17 Years | 81 (34.9%) | 131 (100.0%) |
| 18 to 24 Years | 190 (100.0%) | 241 (100.0%) |
| 25 to 34 Years | 248 (100.0%) | 75 (100.0%) |
| 35 to 44 Years | 375 (100.0%) | 339 (70.3%) |
| 45 to 54 Years | 362 (93.3%) | 366 (100.0%) |
| 55 to 64 Years | 364 (87.7%) | 313 (86.5%) |
| 65 to 74 Years | 306 (100.0%) | 340 (100.0%) |
| 75 Years and over | 34 (100.0%) | 199 (100.0%) |
| Total | 2,915 (92.7%) | 2,623 (93.2%) |
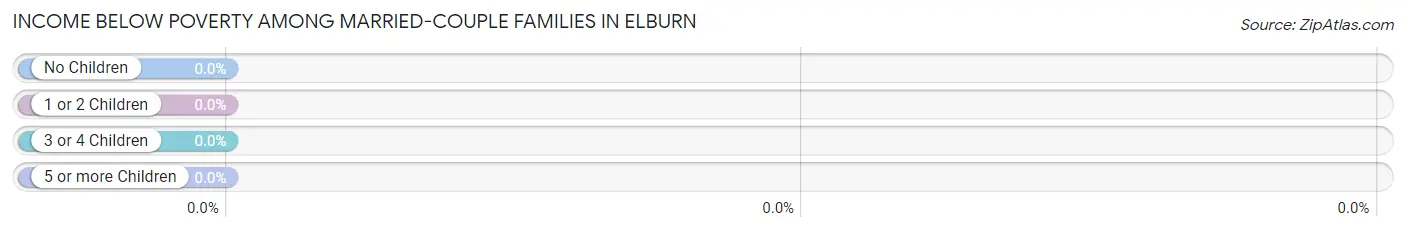
Income Below Poverty Among Married-Couple Families in Elburn
| Children | Above Poverty | Below Poverty |
| No Children | 593 (100.0%) | 0 (0.0%) |
| 1 or 2 Children | 459 (100.0%) | 0 (0.0%) |
| 3 or 4 Children | 118 (100.0%) | 0 (0.0%) |
| 5 or more Children | 0 (0.0%) | 0 (0.0%) |
| Total | 1,170 (100.0%) | 0 (0.0%) |
Income Below Poverty Among Single-Parent Households in Elburn
| Children | Single Father | Single Mother |
| No Children | 0 (0.0%) | 0 (0.0%) |
| 1 or 2 Children | 0 (0.0%) | 0 (0.0%) |
| 3 or 4 Children | 0 (0.0%) | 0 (0.0%) |
| 5 or more Children | 0 (0.0%) | 0 (0.0%) |
| Total | 0 (0.0%) | 0 (0.0%) |
Income Below Poverty Among Married-Couple vs Single-Parent Households in Elburn
| Children | Married-Couple Families | Single-Parent Households |
| No Children | 0 (0.0%) | 0 (0.0%) |
| 1 or 2 Children | 0 (0.0%) | 0 (0.0%) |
| 3 or 4 Children | 0 (0.0%) | 0 (0.0%) |
| 5 or more Children | 0 (0.0%) | 0 (0.0%) |
| Total | 0 (0.0%) | 0 (0.0%) |
Race in Elburn
The most populous races in Elburn are White / Caucasian (5,946 | 99.8%), Hispanic or Latino (726 | 12.2%), and Some other Race (12 | 0.2%).
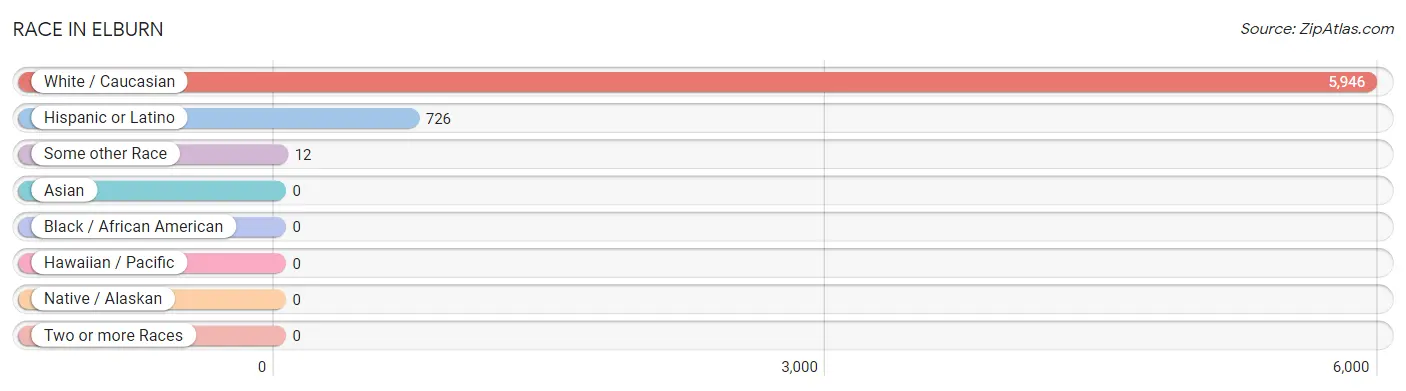
| Race | # Population | % Population |
| Asian | 0 | 0.0% |
| Black / African American | 0 | 0.0% |
| Hawaiian / Pacific | 0 | 0.0% |
| Hispanic or Latino | 726 | 12.2% |
| Native / Alaskan | 0 | 0.0% |
| White / Caucasian | 5,946 | 99.8% |
| Two or more Races | 0 | 0.0% |
| Some other Race | 12 | 0.2% |
| Total | 5,958 | 100.0% |
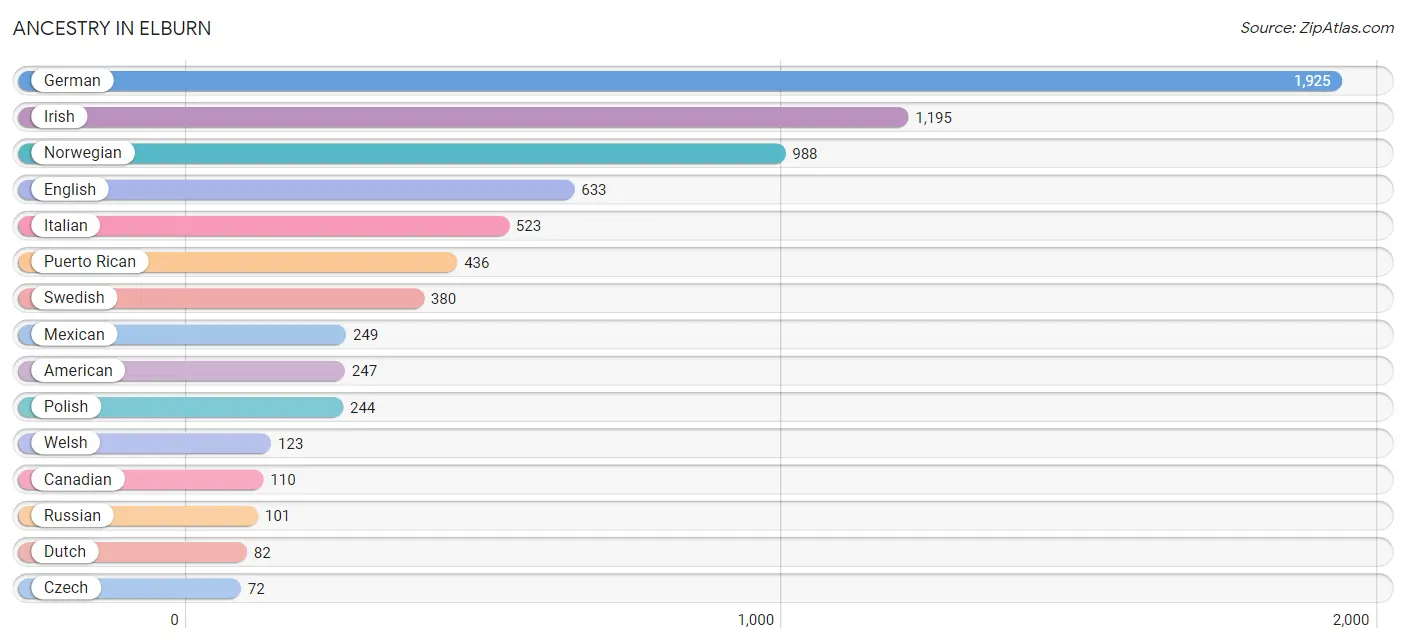
Ancestry in Elburn
The most populous ancestries reported in Elburn are German (1,925 | 32.3%), Irish (1,195 | 20.1%), Norwegian (988 | 16.6%), English (633 | 10.6%), and Italian (523 | 8.8%), together accounting for 88.3% of all Elburn residents.
| Ancestry | # Population | % Population |
| American | 247 | 4.2% |
| Argentinean | 41 | 0.7% |
| Austrian | 10 | 0.2% |
| British | 21 | 0.4% |
| Canadian | 110 | 1.8% |
| Croatian | 38 | 0.6% |
| Czech | 72 | 1.2% |
| Danish | 24 | 0.4% |
| Dutch | 82 | 1.4% |
| English | 633 | 10.6% |
| European | 13 | 0.2% |
| French | 45 | 0.8% |
| French Canadian | 24 | 0.4% |
| German | 1,925 | 32.3% |
| Greek | 38 | 0.6% |
| Hungarian | 10 | 0.2% |
| Irish | 1,195 | 20.1% |
| Italian | 523 | 8.8% |
| Lithuanian | 18 | 0.3% |
| Mexican | 249 | 4.2% |
| Norwegian | 988 | 16.6% |
| Polish | 244 | 4.1% |
| Puerto Rican | 436 | 7.3% |
| Russian | 101 | 1.7% |
| Scandinavian | 28 | 0.5% |
| Scottish | 34 | 0.6% |
| Slovak | 12 | 0.2% |
| Slovene | 32 | 0.5% |
| South American | 41 | 0.7% |
| Swedish | 380 | 6.4% |
| Ukrainian | 17 | 0.3% |
| Welsh | 123 | 2.1% |
| Yugoslavian | 31 | 0.5% | View All 33 Rows |
Immigrants in Elburn
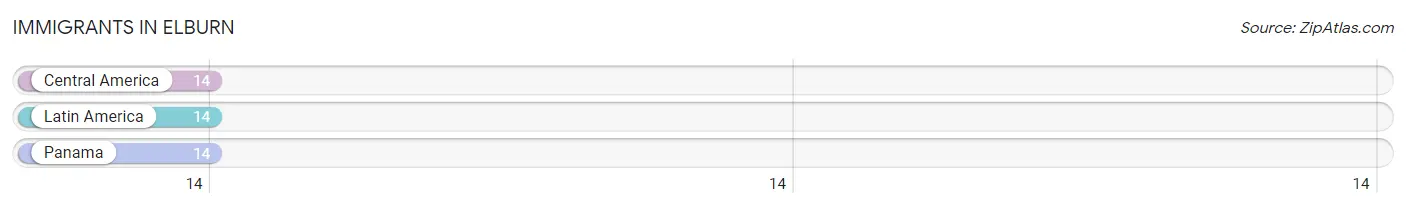
The most numerous immigrant groups reported in Elburn came from Central America (14 | 0.2%), Latin America (14 | 0.2%), and Panama (14 | 0.2%), together accounting for 0.7% of all Elburn residents.
| Immigration Origin | # Population | % Population |
| Central America | 14 | 0.2% |
| Latin America | 14 | 0.2% |
| Panama | 14 | 0.2% | View All 3 Rows |
Sex and Age in Elburn
Sex and Age in Elburn
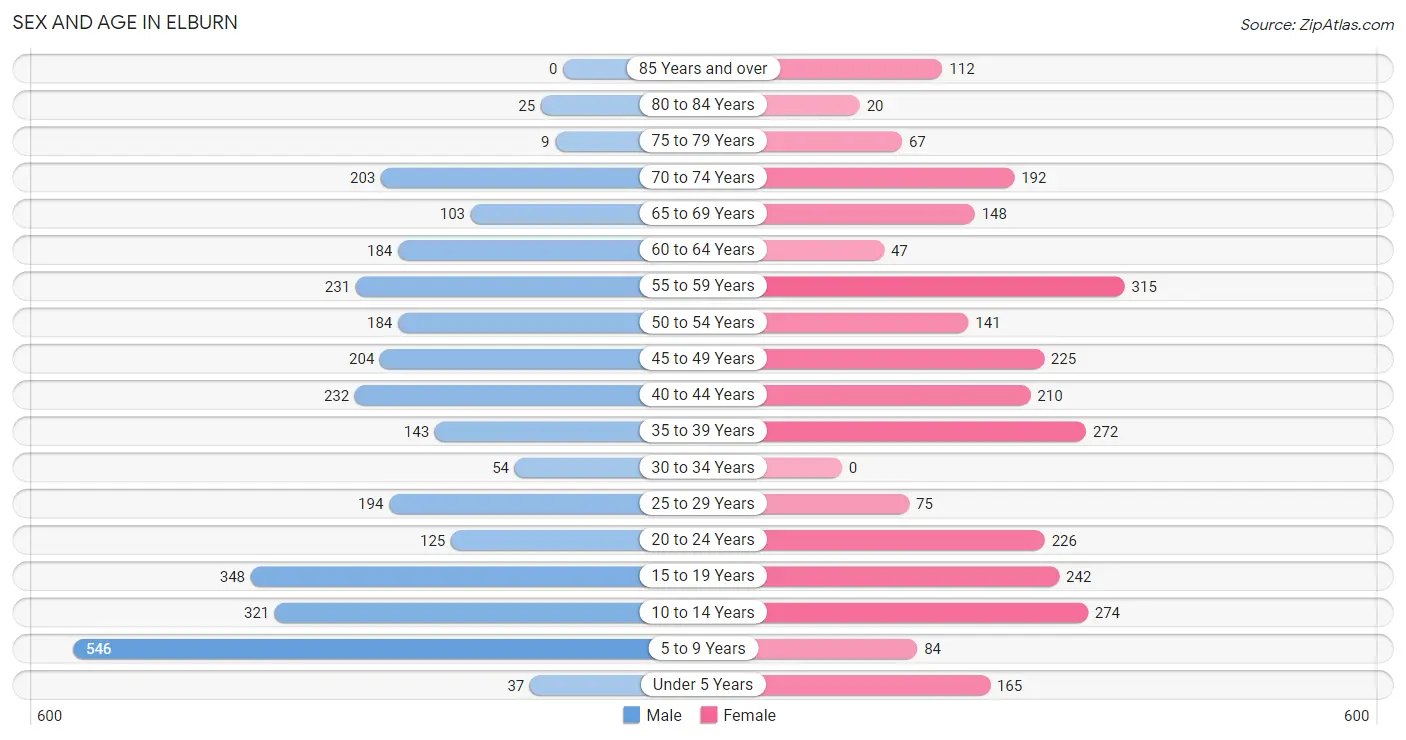
The most populous age groups in Elburn are 5 to 9 Years (546 | 17.4%) for men and 55 to 59 Years (315 | 11.2%) for women.
| Age Bracket | Male | Female |
| Under 5 Years | 37 (1.2%) | 165 (5.9%) |
| 5 to 9 Years | 546 (17.4%) | 84 (3.0%) |
| 10 to 14 Years | 321 (10.2%) | 274 (9.7%) |
| 15 to 19 Years | 348 (11.1%) | 242 (8.6%) |
| 20 to 24 Years | 125 (4.0%) | 226 (8.0%) |
| 25 to 29 Years | 194 (6.2%) | 75 (2.7%) |
| 30 to 34 Years | 54 (1.7%) | 0 (0.0%) |
| 35 to 39 Years | 143 (4.5%) | 272 (9.7%) |
| 40 to 44 Years | 232 (7.4%) | 210 (7.5%) |
| 45 to 49 Years | 204 (6.5%) | 225 (8.0%) |
| 50 to 54 Years | 184 (5.9%) | 141 (5.0%) |
| 55 to 59 Years | 231 (7.3%) | 315 (11.2%) |
| 60 to 64 Years | 184 (5.9%) | 47 (1.7%) |
| 65 to 69 Years | 103 (3.3%) | 148 (5.3%) |
| 70 to 74 Years | 203 (6.5%) | 192 (6.8%) |
| 75 to 79 Years | 9 (0.3%) | 67 (2.4%) |
| 80 to 84 Years | 25 (0.8%) | 20 (0.7%) |
| 85 Years and over | 0 (0.0%) | 112 (4.0%) |
| Total | 3,143 (100.0%) | 2,815 (100.0%) |
Families and Households in Elburn
Median Family Size in Elburn
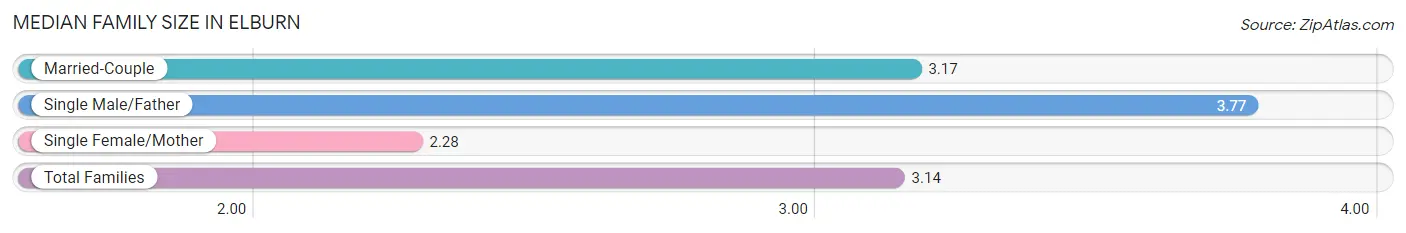
The median family size in Elburn is 3.14 persons per family, with single male/father families (241 | 14.8%) accounting for the largest median family size of 3.77 persons per family. On the other hand, single female/mother families (217 | 13.3%) represent the smallest median family size with 2.28 persons per family.
| Family Type | # Families | Family Size |
| Married-Couple | 1,170 (71.9%) | 3.17 |
| Single Male/Father | 241 (14.8%) | 3.77 |
| Single Female/Mother | 217 (13.3%) | 2.28 |
| Total Families | 1,628 (100.0%) | 3.14 |
Median Household Size in Elburn
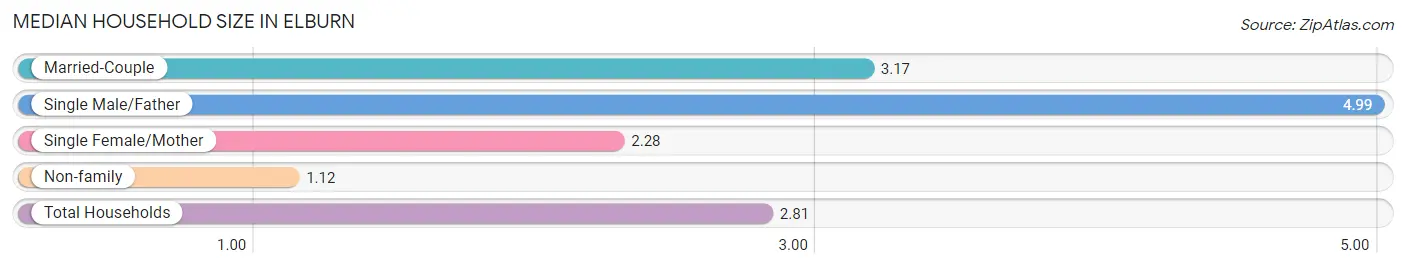
The median household size in Elburn is 2.81 persons per household, with single male/father households (241 | 11.4%) accounting for the largest median household size of 4.99 persons per household. non-family households (494 | 23.3%) represent the smallest median household size with 1.12 persons per household.
| Household Type | # Households | Household Size |
| Married-Couple | 1,170 (55.1%) | 3.17 |
| Single Male/Father | 241 (11.4%) | 4.99 |
| Single Female/Mother | 217 (10.2%) | 2.28 |
| Non-family | 494 (23.3%) | 1.12 |
| Total Households | 2,122 (100.0%) | 2.81 |
Household Size by Marriage Status in Elburn
Out of a total of 2,122 households in Elburn, 1,628 (76.7%) are family households, while 494 (23.3%) are nonfamily households. The most numerous type of family households are 2-person households, comprising 687, and the most common type of nonfamily households are 1-person households, comprising 445.
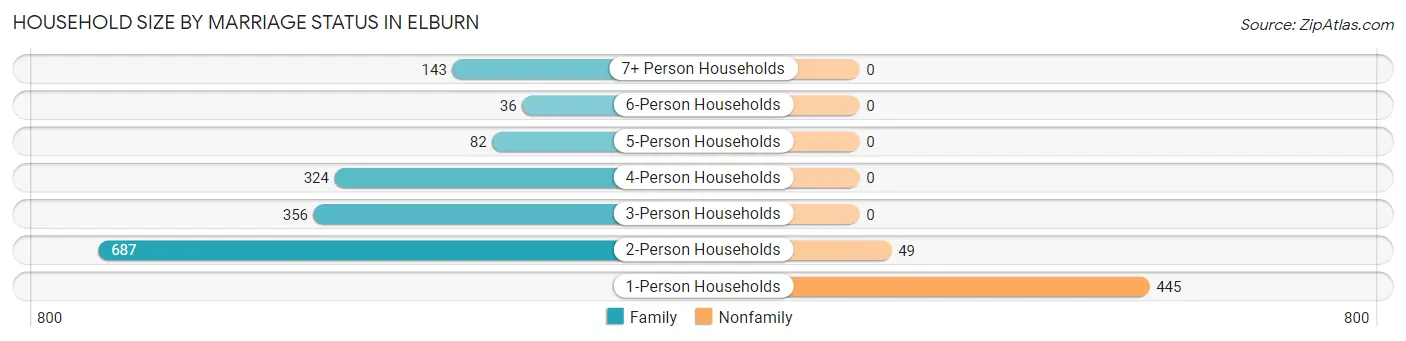
| Household Size | Family Households | Nonfamily Households |
| 1-Person Households | - | 445 (21.0%) |
| 2-Person Households | 687 (32.4%) | 49 (2.3%) |
| 3-Person Households | 356 (16.8%) | 0 (0.0%) |
| 4-Person Households | 324 (15.3%) | 0 (0.0%) |
| 5-Person Households | 82 (3.9%) | 0 (0.0%) |
| 6-Person Households | 36 (1.7%) | 0 (0.0%) |
| 7+ Person Households | 143 (6.7%) | 0 (0.0%) |
| Total | 1,628 (76.7%) | 494 (23.3%) |
Female Fertility in Elburn
Fertility by Age in Elburn
Average fertility rate in Elburn is 9.0 births per 1,000 women. Women in the age bracket of 35 to 50 years have the highest fertility rate with 17.0 births per 1,000 women. Women in the age bracket of 35 to 50 years acount for 100.0% of all women with births.
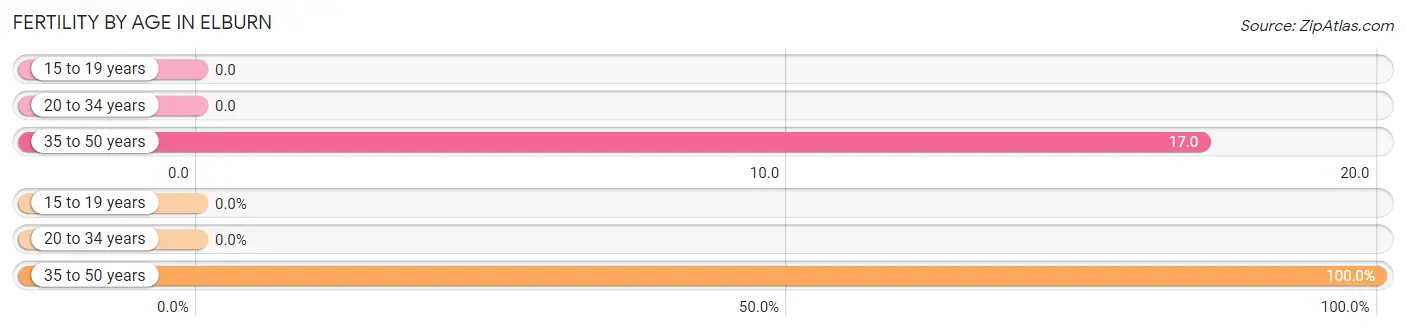
| Age Bracket | Women with Births | Births / 1,000 Women |
| 15 to 19 years | 0 (0.0%) | 0.0 |
| 20 to 34 years | 0 (0.0%) | 0.0 |
| 35 to 50 years | 12 (100.0%) | 17.0 |
| Total | 12 (100.0%) | 9.0 |
Fertility by Age by Marriage Status in Elburn
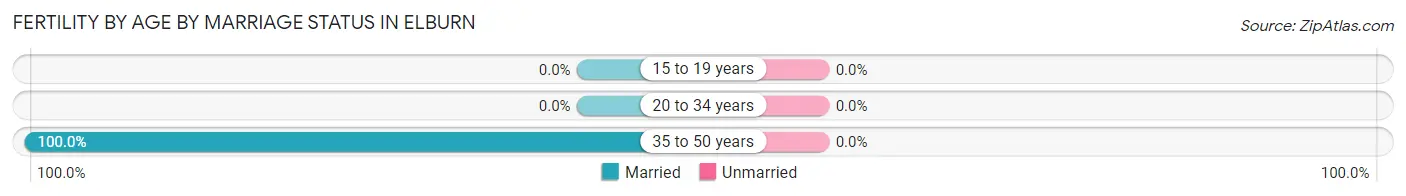
| Age Bracket | Married | Unmarried |
| 15 to 19 years | 0 (0.0%) | 0 (0.0%) |
| 20 to 34 years | 0 (0.0%) | 0 (0.0%) |
| 35 to 50 years | 12 (100.0%) | 0 (0.0%) |
| Total | 12 (100.0%) | 0 (0.0%) |
Fertility by Education in Elburn
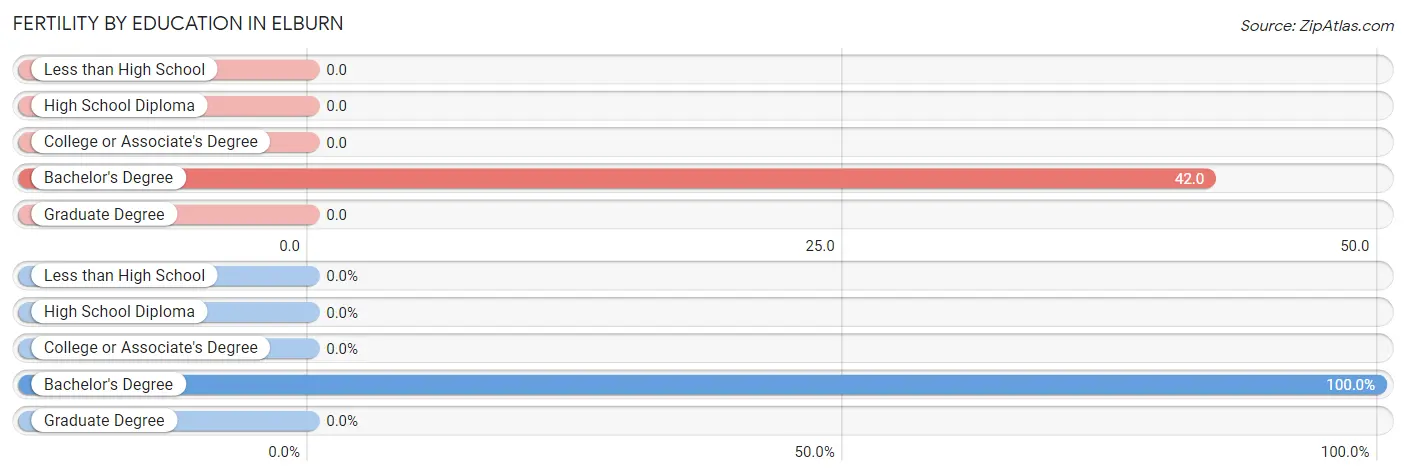
| Educational Attainment | Women with Births | Births / 1,000 Women |
| Less than High School | 0 (0.0%) | 0.0 |
| High School Diploma | 0 (0.0%) | 0.0 |
| College or Associate's Degree | 0 (0.0%) | 0.0 |
| Bachelor's Degree | 12 (100.0%) | 42.0 |
| Graduate Degree | 0 (0.0%) | 0.0 |
| Total | 12 (100.0%) | 9.0 |
Fertility by Education by Marriage Status in Elburn
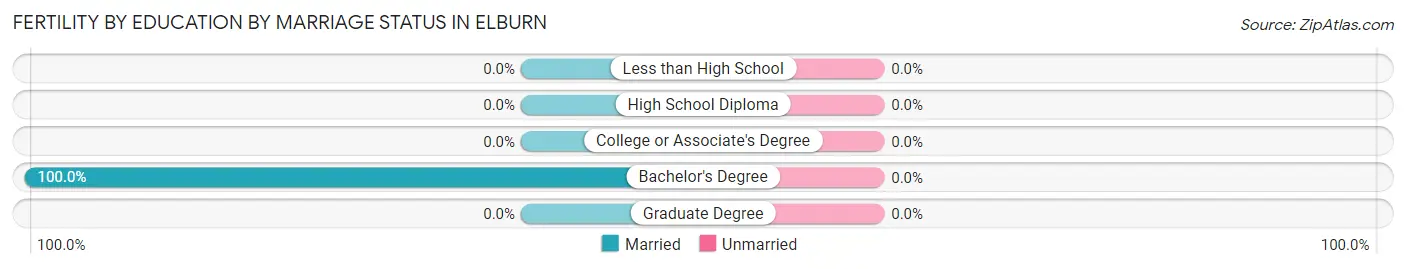
| Educational Attainment | Married | Unmarried |
| Less than High School | 0 (0.0%) | 0 (0.0%) |
| High School Diploma | 0 (0.0%) | 0 (0.0%) |
| College or Associate's Degree | 0 (0.0%) | 0 (0.0%) |
| Bachelor's Degree | 12 (100.0%) | 0 (0.0%) |
| Graduate Degree | 0 (0.0%) | 0 (0.0%) |
| Total | 12 (100.0%) | 0 (0.0%) |
Employment Characteristics in Elburn
Employment by Class of Employer in Elburn
Among the 2,927 employed individuals in Elburn, private company employees (1,669 | 57.0%), local government employees (553 | 18.9%), and federal government employees (334 | 11.4%) make up the most common classes of employment.
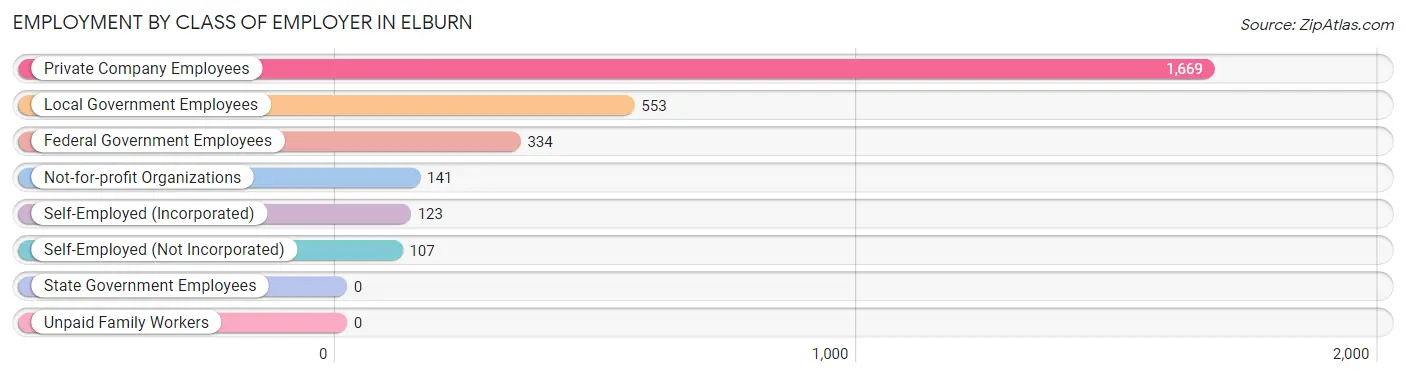
| Employer Class | # Employees | % Employees |
| Private Company Employees | 1,669 | 57.0% |
| Self-Employed (Incorporated) | 123 | 4.2% |
| Self-Employed (Not Incorporated) | 107 | 3.7% |
| Not-for-profit Organizations | 141 | 4.8% |
| Local Government Employees | 553 | 18.9% |
| State Government Employees | 0 | 0.0% |
| Federal Government Employees | 334 | 11.4% |
| Unpaid Family Workers | 0 | 0.0% |
| Total | 2,927 | 100.0% |
Employment Status by Age in Elburn
According to the labor force statistics for Elburn, out of the total population over 16 years of age (4,384), 67.6% or 2,964 individuals are in the labor force, with 0.4% or 12 of them unemployed. The age group with the highest labor force participation rate is 25 to 29 years, with 100.0% or 269 individuals in the labor force. Within the labor force, the 45 to 54 years age range has the highest percentage of unemployed individuals, with 1.8% or 12 of them being unemployed.
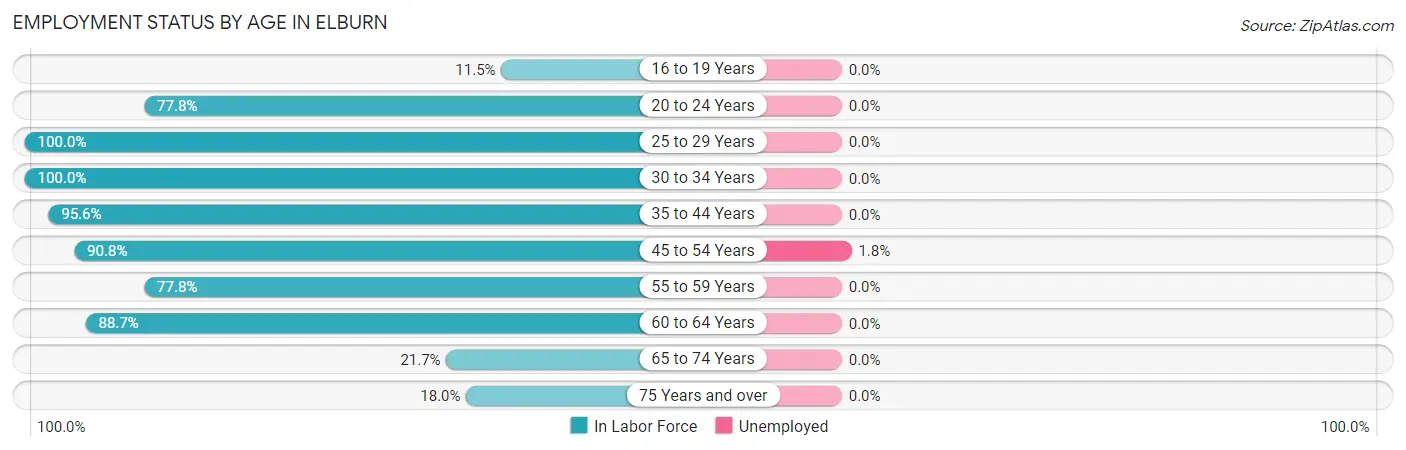
| Age Bracket | In Labor Force | Unemployed |
| 16 to 19 Years | 51 (11.5%) | 0 (0.0%) |
| 20 to 24 Years | 273 (77.8%) | 0 (0.0%) |
| 25 to 29 Years | 269 (100.0%) | 0 (0.0%) |
| 30 to 34 Years | 54 (100.0%) | 0 (0.0%) |
| 35 to 44 Years | 819 (95.6%) | 0 (0.0%) |
| 45 to 54 Years | 685 (90.8%) | 12 (1.8%) |
| 55 to 59 Years | 425 (77.8%) | 0 (0.0%) |
| 60 to 64 Years | 205 (88.7%) | 0 (0.0%) |
| 65 to 74 Years | 140 (21.7%) | 0 (0.0%) |
| 75 Years and over | 42 (18.0%) | 0 (0.0%) |
| Total | 2,964 (67.6%) | 12 (0.4%) |
Employment Status by Educational Attainment in Elburn
According to labor force statistics for Elburn, 90.6% of individuals (2,456) out of the total population between 25 and 64 years of age (2,711) are in the labor force, with 0.5% or 12 of them being unemployed. The group with the highest labor force participation rate are those with the educational attainment of college / associate degree, with 95.0% or 1,087 individuals in the labor force. Within the labor force, individuals with bachelor's degree or higher education have the highest percentage of unemployment, with 1.0% or 12 of them being unemployed.
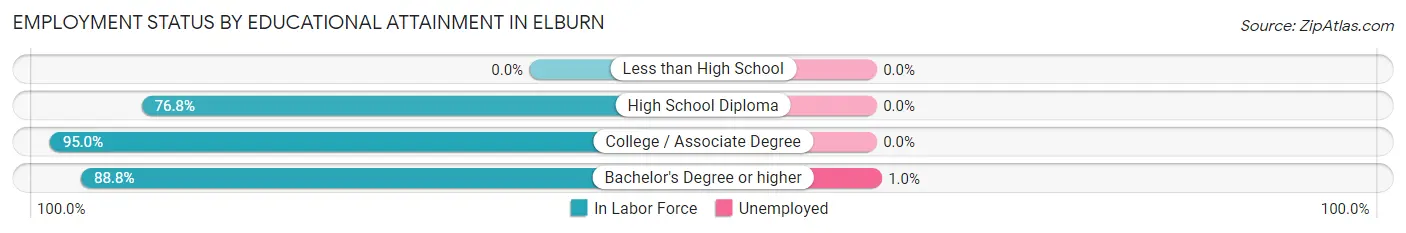
| Educational Attainment | In Labor Force | Unemployed |
| Less than High School | 0 (0.0%) | 0 (0.0%) |
| High School Diploma | 136 (76.8%) | 0 (0.0%) |
| College / Associate Degree | 1,087 (95.0%) | 0 (0.0%) |
| Bachelor's Degree or higher | 1,234 (88.8%) | 14 (1.0%) |
| Total | 2,456 (90.6%) | 14 (0.5%) |
Employment Occupations by Sex in Elburn
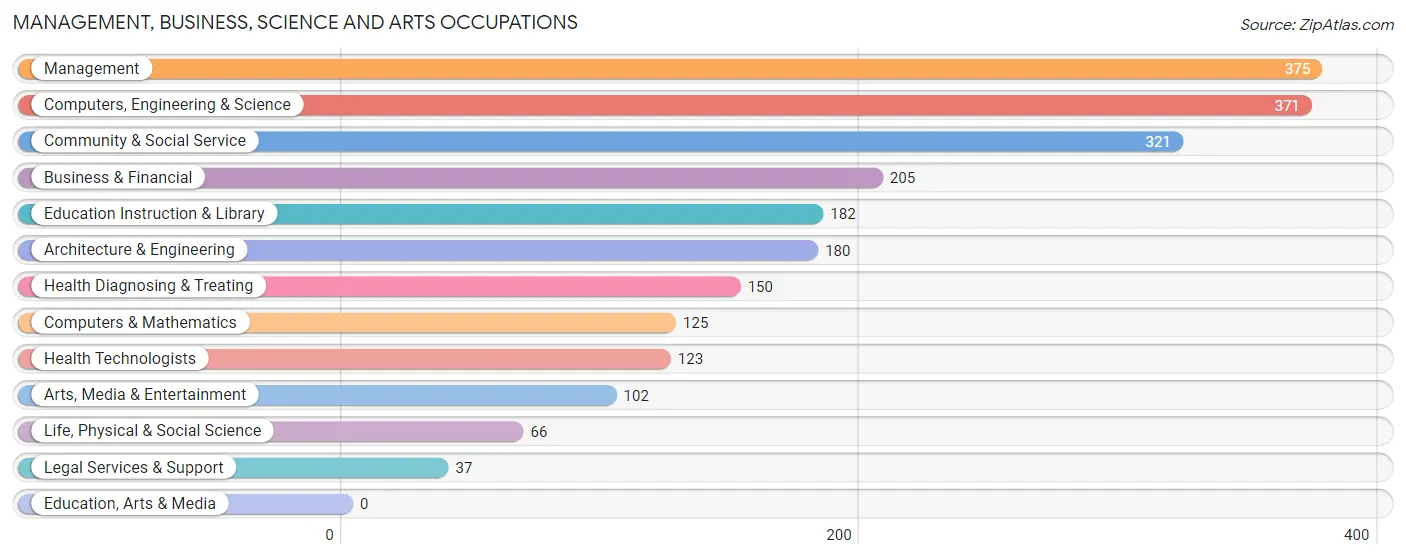
Management, Business, Science and Arts Occupations
The most common Management, Business, Science and Arts occupations in Elburn are Management (375 | 12.7%), Computers, Engineering & Science (371 | 12.6%), Community & Social Service (321 | 10.9%), Business & Financial (205 | 7.0%), and Education Instruction & Library (182 | 6.2%).
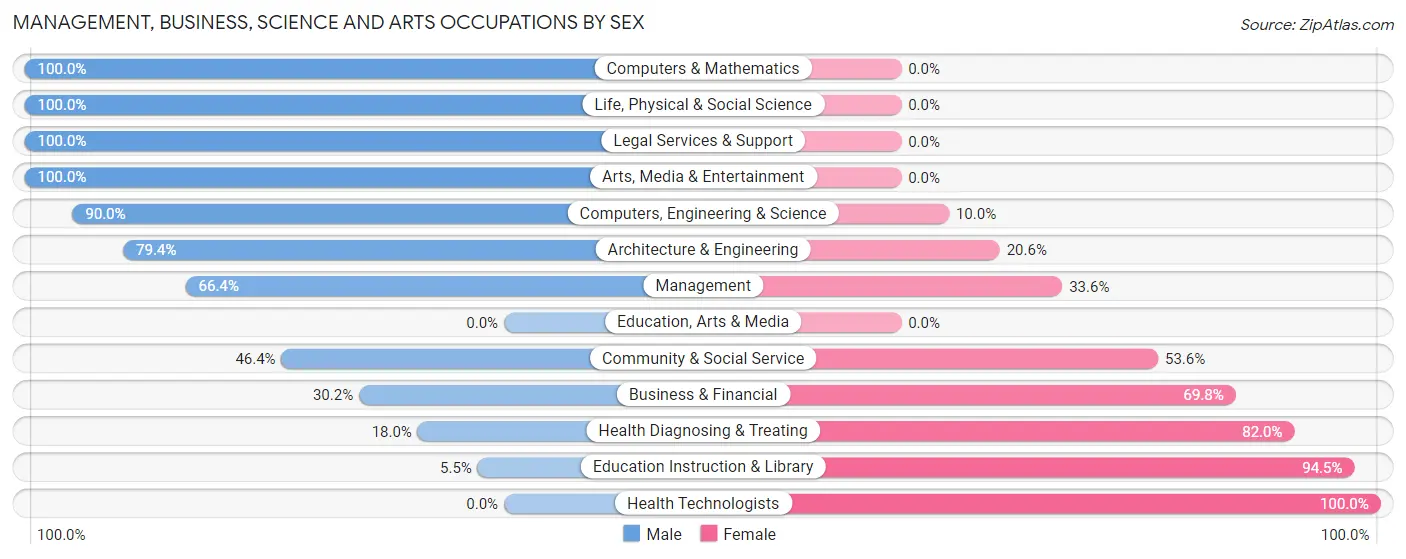
Management, Business, Science and Arts Occupations by Sex
Within the Management, Business, Science and Arts occupations in Elburn, the most male-oriented occupations are Computers & Mathematics (100.0%), Life, Physical & Social Science (100.0%), and Legal Services & Support (100.0%), while the most female-oriented occupations are Health Technologists (100.0%), Education Instruction & Library (94.5%), and Health Diagnosing & Treating (82.0%).
| Occupation | Male | Female |
| Management | 249 (66.4%) | 126 (33.6%) |
| Business & Financial | 62 (30.2%) | 143 (69.8%) |
| Computers, Engineering & Science | 334 (90.0%) | 37 (10.0%) |
| Computers & Mathematics | 125 (100.0%) | 0 (0.0%) |
| Architecture & Engineering | 143 (79.4%) | 37 (20.6%) |
| Life, Physical & Social Science | 66 (100.0%) | 0 (0.0%) |
| Community & Social Service | 149 (46.4%) | 172 (53.6%) |
| Education, Arts & Media | 0 (0.0%) | 0 (0.0%) |
| Legal Services & Support | 37 (100.0%) | 0 (0.0%) |
| Education Instruction & Library | 10 (5.5%) | 172 (94.5%) |
| Arts, Media & Entertainment | 102 (100.0%) | 0 (0.0%) |
| Health Diagnosing & Treating | 27 (18.0%) | 123 (82.0%) |
| Health Technologists | 0 (0.0%) | 123 (100.0%) |
| Total (Category) | 821 (57.7%) | 601 (42.3%) |
| Total (Overall) | 1,507 (51.1%) | 1,444 (48.9%) |
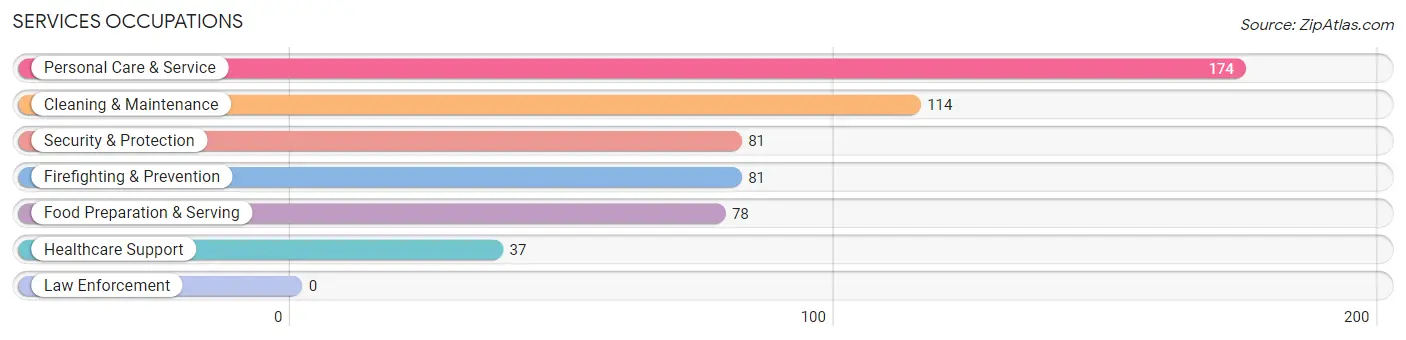
Services Occupations
The most common Services occupations in Elburn are Personal Care & Service (174 | 5.9%), Cleaning & Maintenance (114 | 3.9%), Security & Protection (81 | 2.7%), Firefighting & Prevention (81 | 2.7%), and Food Preparation & Serving (78 | 2.6%).
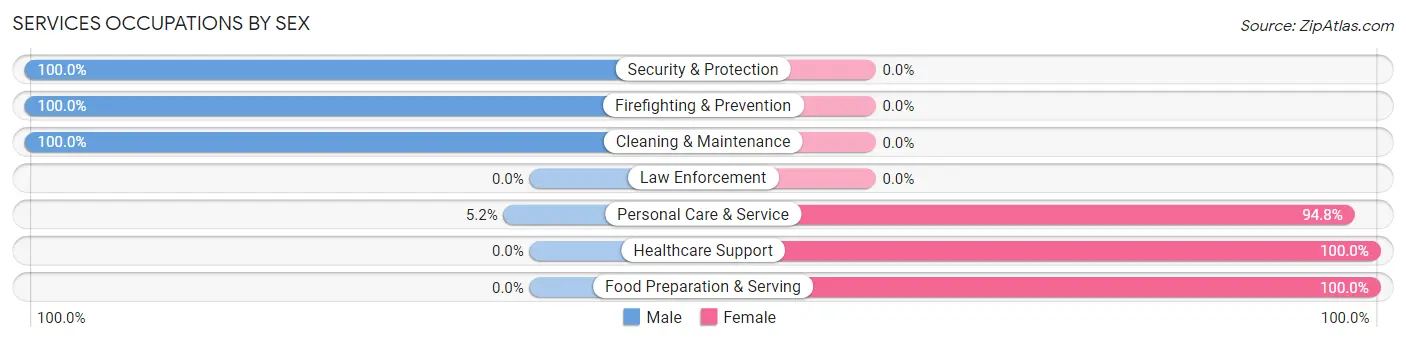
Services Occupations by Sex
Within the Services occupations in Elburn, the most male-oriented occupations are Security & Protection (100.0%), Firefighting & Prevention (100.0%), and Cleaning & Maintenance (100.0%), while the most female-oriented occupations are Healthcare Support (100.0%), Food Preparation & Serving (100.0%), and Personal Care & Service (94.8%).
| Occupation | Male | Female |
| Healthcare Support | 0 (0.0%) | 37 (100.0%) |
| Security & Protection | 81 (100.0%) | 0 (0.0%) |
| Firefighting & Prevention | 81 (100.0%) | 0 (0.0%) |
| Law Enforcement | 0 (0.0%) | 0 (0.0%) |
| Food Preparation & Serving | 0 (0.0%) | 78 (100.0%) |
| Cleaning & Maintenance | 114 (100.0%) | 0 (0.0%) |
| Personal Care & Service | 9 (5.2%) | 165 (94.8%) |
| Total (Category) | 204 (42.1%) | 280 (57.9%) |
| Total (Overall) | 1,507 (51.1%) | 1,444 (48.9%) |
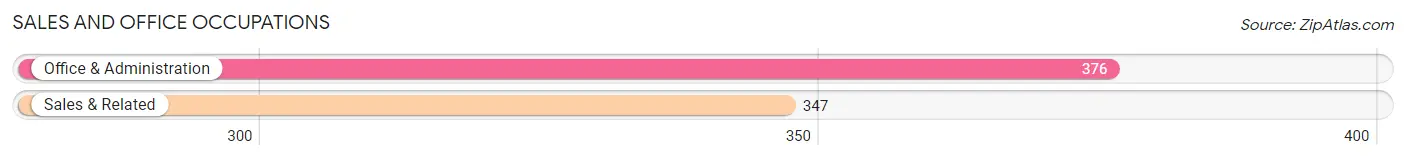
Sales and Office Occupations
The most common Sales and Office occupations in Elburn are Office & Administration (376 | 12.7%), and Sales & Related (347 | 11.8%).
Sales and Office Occupations by Sex
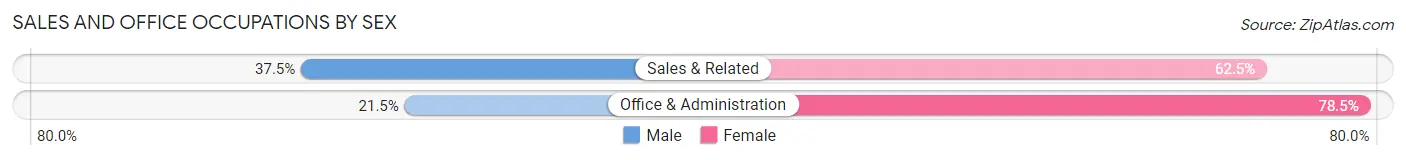
| Occupation | Male | Female |
| Sales & Related | 130 (37.5%) | 217 (62.5%) |
| Office & Administration | 81 (21.5%) | 295 (78.5%) |
| Total (Category) | 211 (29.2%) | 512 (70.8%) |
| Total (Overall) | 1,507 (51.1%) | 1,444 (48.9%) |
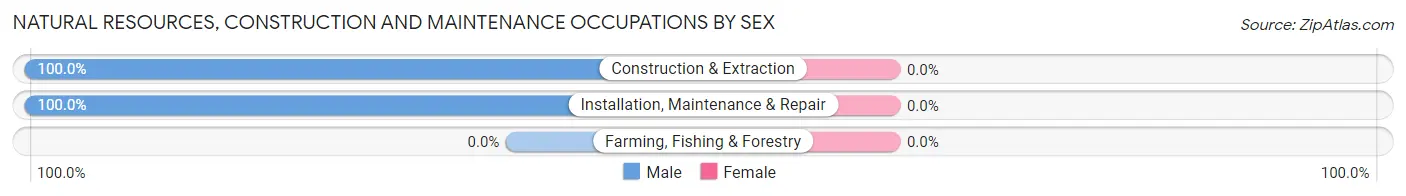
Natural Resources, Construction and Maintenance Occupations
The most common Natural Resources, Construction and Maintenance occupations in Elburn are Installation, Maintenance & Repair (90 | 3.0%), and Construction & Extraction (38 | 1.3%).

Natural Resources, Construction and Maintenance Occupations by Sex
| Occupation | Male | Female |
| Farming, Fishing & Forestry | 0 (0.0%) | 0 (0.0%) |
| Construction & Extraction | 38 (100.0%) | 0 (0.0%) |
| Installation, Maintenance & Repair | 90 (100.0%) | 0 (0.0%) |
| Total (Category) | 128 (100.0%) | 0 (0.0%) |
| Total (Overall) | 1,507 (51.1%) | 1,444 (48.9%) |
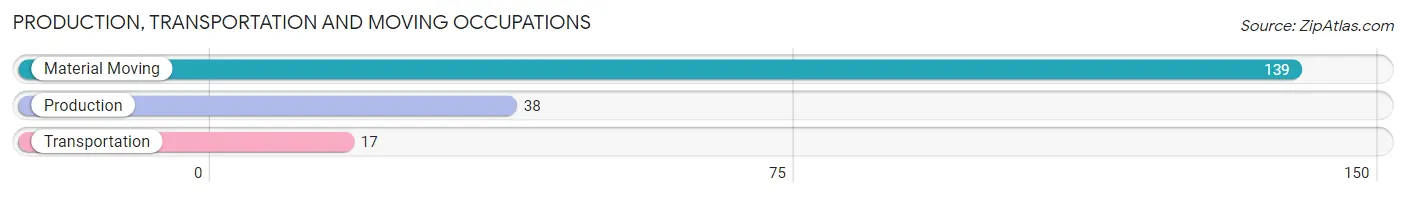
Production, Transportation and Moving Occupations
The most common Production, Transportation and Moving occupations in Elburn are Material Moving (139 | 4.7%), Production (38 | 1.3%), and Transportation (17 | 0.6%).
Production, Transportation and Moving Occupations by Sex
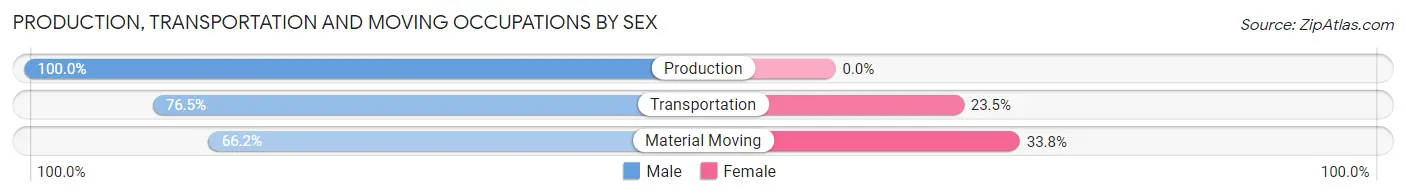
| Occupation | Male | Female |
| Production | 38 (100.0%) | 0 (0.0%) |
| Transportation | 13 (76.5%) | 4 (23.5%) |
| Material Moving | 92 (66.2%) | 47 (33.8%) |
| Total (Category) | 143 (73.7%) | 51 (26.3%) |
| Total (Overall) | 1,507 (51.1%) | 1,444 (48.9%) |
Employment Industries by Sex in Elburn
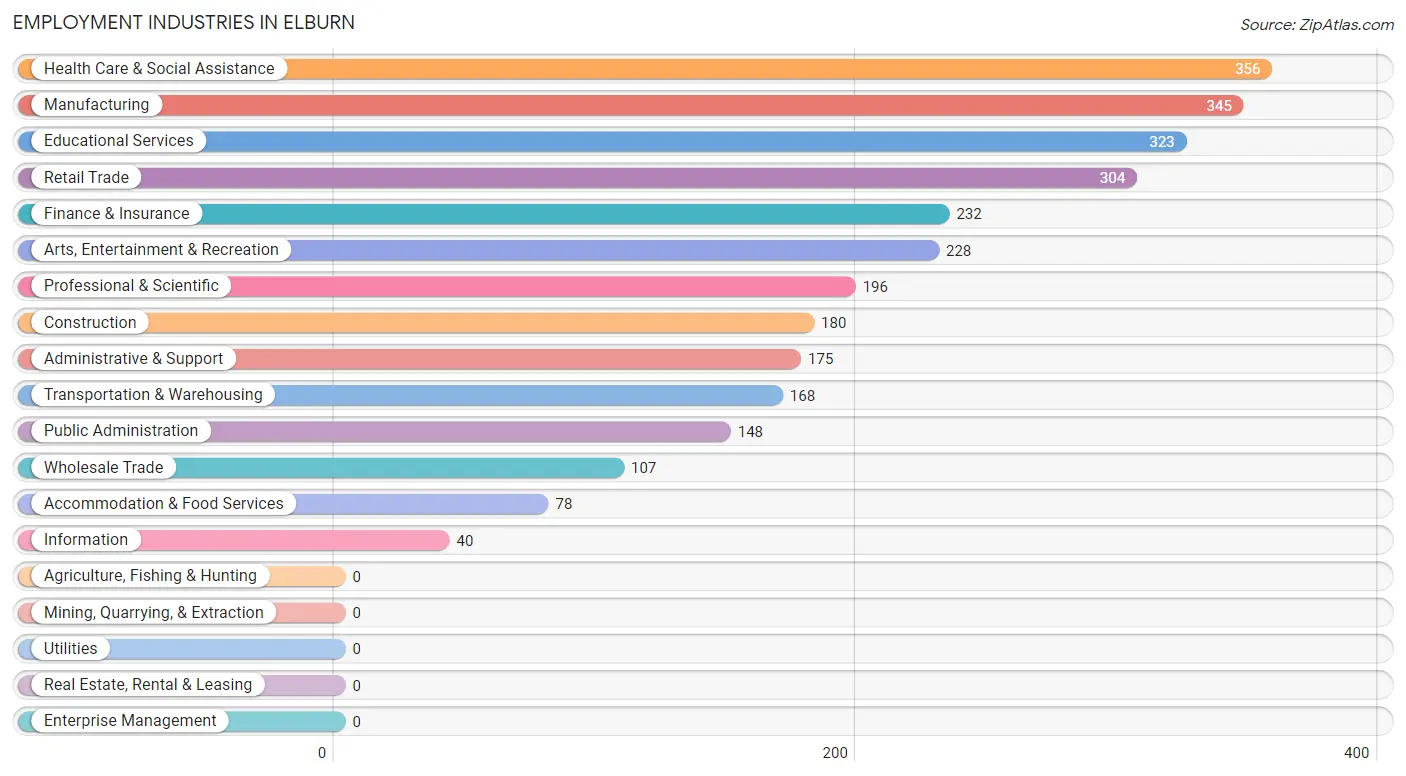
Employment Industries in Elburn
The major employment industries in Elburn include Health Care & Social Assistance (356 | 12.1%), Manufacturing (345 | 11.7%), Educational Services (323 | 11.0%), Retail Trade (304 | 10.3%), and Finance & Insurance (232 | 7.9%).
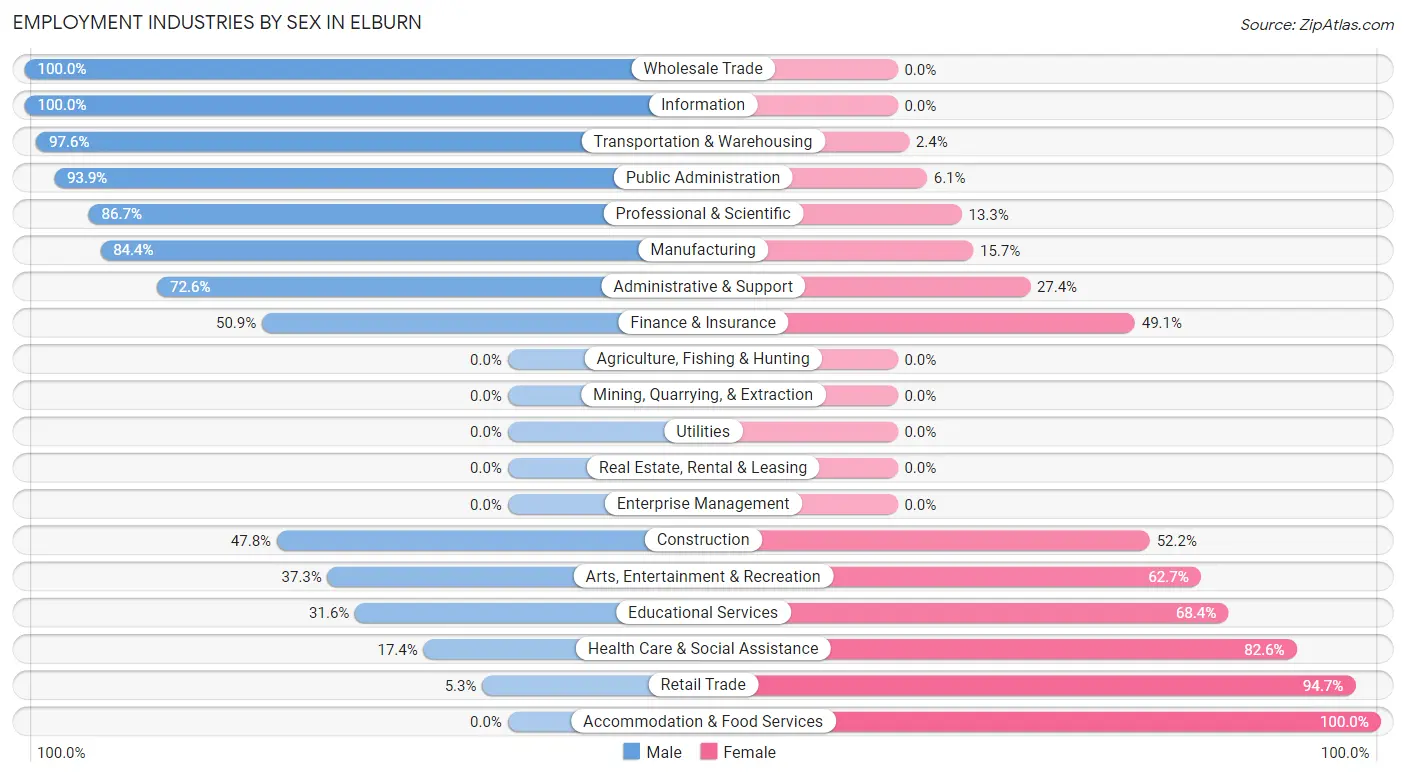
Employment Industries by Sex in Elburn
The Elburn industries that see more men than women are Wholesale Trade (100.0%), Information (100.0%), and Transportation & Warehousing (97.6%), whereas the industries that tend to have a higher number of women are Accommodation & Food Services (100.0%), Retail Trade (94.7%), and Health Care & Social Assistance (82.6%).
| Industry | Male | Female |
| Agriculture, Fishing & Hunting | 0 (0.0%) | 0 (0.0%) |
| Mining, Quarrying, & Extraction | 0 (0.0%) | 0 (0.0%) |
| Construction | 86 (47.8%) | 94 (52.2%) |
| Manufacturing | 291 (84.4%) | 54 (15.7%) |
| Wholesale Trade | 107 (100.0%) | 0 (0.0%) |
| Retail Trade | 16 (5.3%) | 288 (94.7%) |
| Transportation & Warehousing | 164 (97.6%) | 4 (2.4%) |
| Utilities | 0 (0.0%) | 0 (0.0%) |
| Information | 40 (100.0%) | 0 (0.0%) |
| Finance & Insurance | 118 (50.9%) | 114 (49.1%) |
| Real Estate, Rental & Leasing | 0 (0.0%) | 0 (0.0%) |
| Professional & Scientific | 170 (86.7%) | 26 (13.3%) |
| Enterprise Management | 0 (0.0%) | 0 (0.0%) |
| Administrative & Support | 127 (72.6%) | 48 (27.4%) |
| Educational Services | 102 (31.6%) | 221 (68.4%) |
| Health Care & Social Assistance | 62 (17.4%) | 294 (82.6%) |
| Arts, Entertainment & Recreation | 85 (37.3%) | 143 (62.7%) |
| Accommodation & Food Services | 0 (0.0%) | 78 (100.0%) |
| Public Administration | 139 (93.9%) | 9 (6.1%) |
| Total | 1,507 (51.1%) | 1,444 (48.9%) |
Education in Elburn
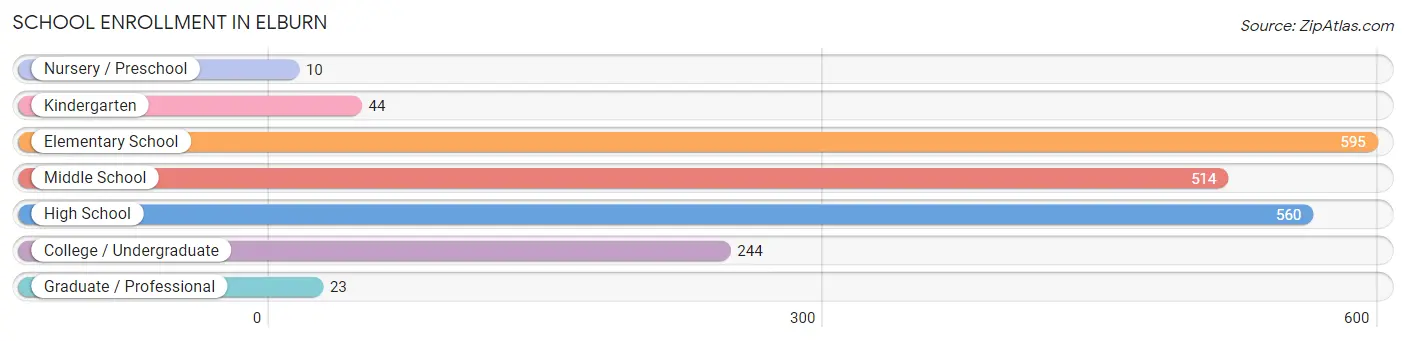
School Enrollment in Elburn
The most common levels of schooling among the 1,990 students in Elburn are elementary school (595 | 29.9%), high school (560 | 28.1%), and middle school (514 | 25.8%).
| School Level | # Students | % Students |
| Nursery / Preschool | 10 | 0.5% |
| Kindergarten | 44 | 2.2% |
| Elementary School | 595 | 29.9% |
| Middle School | 514 | 25.8% |
| High School | 560 | 28.1% |
| College / Undergraduate | 244 | 12.3% |
| Graduate / Professional | 23 | 1.2% |
| Total | 1,990 | 100.0% |
School Enrollment by Age by Funding Source in Elburn
Out of a total of 1,990 students who are enrolled in schools in Elburn, 139 (7.0%) attend a private institution, while the remaining 1,851 (93.0%) are enrolled in public schools. The age group of 35 years and over has the highest likelihood of being enrolled in private schools, with 26 (52.0% in the age bracket) enrolled. Conversely, the age group of 3 to 4 year olds has the lowest likelihood of being enrolled in a private school, with 10 (100.0% in the age bracket) attending a public institution.
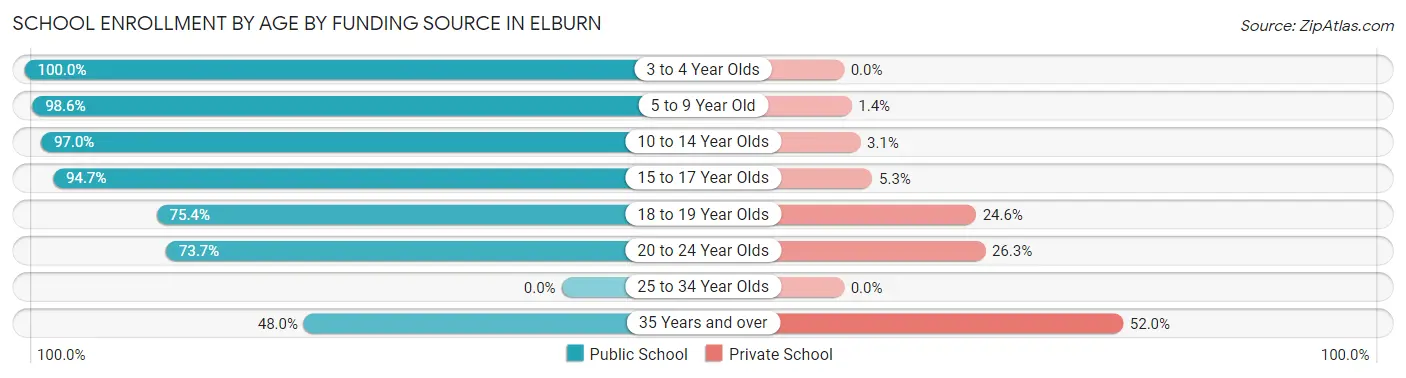
| Age Bracket | Public School | Private School |
| 3 to 4 Year Olds | 10 (100.0%) | 0 (0.0%) |
| 5 to 9 Year Old | 621 (98.6%) | 9 (1.4%) |
| 10 to 14 Year Olds | 541 (97.0%) | 17 (3.0%) |
| 15 to 17 Year Olds | 483 (94.7%) | 27 (5.3%) |
| 18 to 19 Year Olds | 46 (75.4%) | 15 (24.6%) |
| 20 to 24 Year Olds | 126 (73.7%) | 45 (26.3%) |
| 25 to 34 Year Olds | 0 (0.0%) | 0 (0.0%) |
| 35 Years and over | 24 (48.0%) | 26 (52.0%) |
| Total | 1,851 (93.0%) | 139 (7.0%) |
Educational Attainment by Field of Study in Elburn
Business (642 | 28.7%), science & technology (556 | 24.8%), education (216 | 9.7%), liberal arts & history (171 | 7.6%), and computers & mathematics (148 | 6.6%) are the most common fields of study among 2,239 individuals in Elburn who have obtained a bachelor's degree or higher.
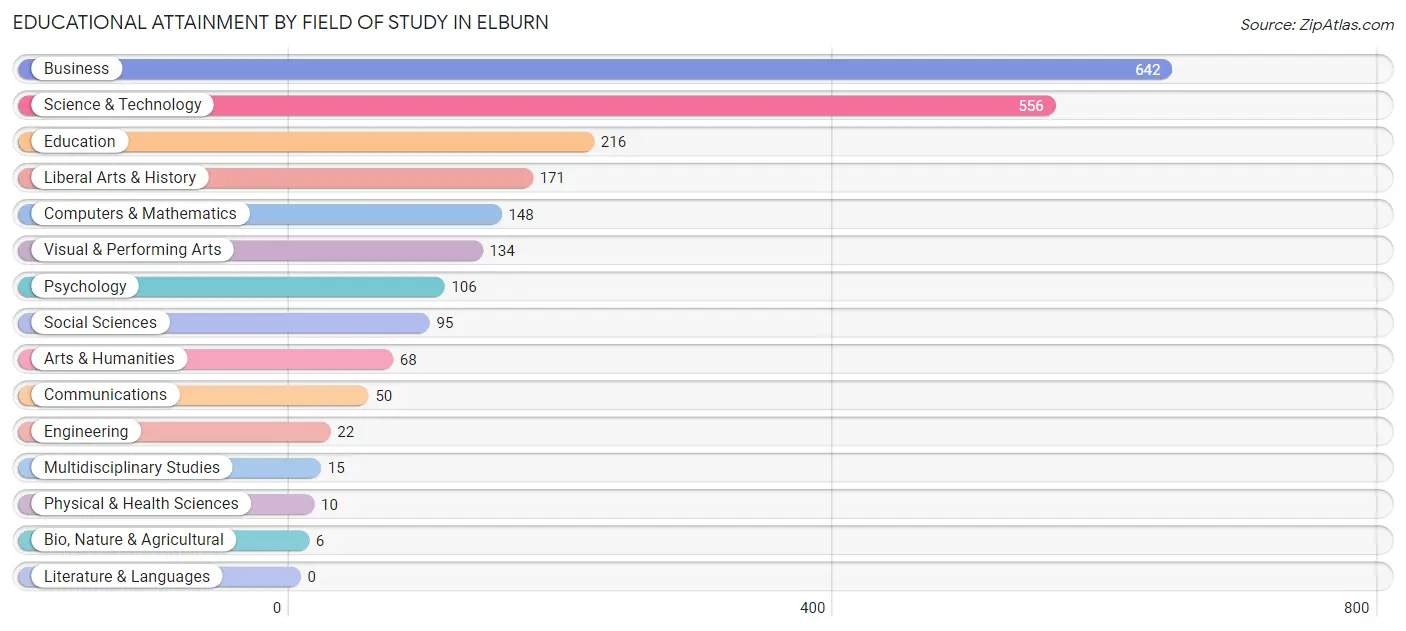
| Field of Study | # Graduates | % Graduates |
| Computers & Mathematics | 148 | 6.6% |
| Bio, Nature & Agricultural | 6 | 0.3% |
| Physical & Health Sciences | 10 | 0.4% |
| Psychology | 106 | 4.7% |
| Social Sciences | 95 | 4.2% |
| Engineering | 22 | 1.0% |
| Multidisciplinary Studies | 15 | 0.7% |
| Science & Technology | 556 | 24.8% |
| Business | 642 | 28.7% |
| Education | 216 | 9.7% |
| Literature & Languages | 0 | 0.0% |
| Liberal Arts & History | 171 | 7.6% |
| Visual & Performing Arts | 134 | 6.0% |
| Communications | 50 | 2.2% |
| Arts & Humanities | 68 | 3.0% |
| Total | 2,239 | 100.0% |
Transportation & Commute in Elburn
Vehicle Availability by Sex in Elburn
The most prevalent vehicle ownership categories in Elburn are males with 2 vehicles (760, accounting for 50.4%) and females with 2 vehicles (543, making up 53.5%).
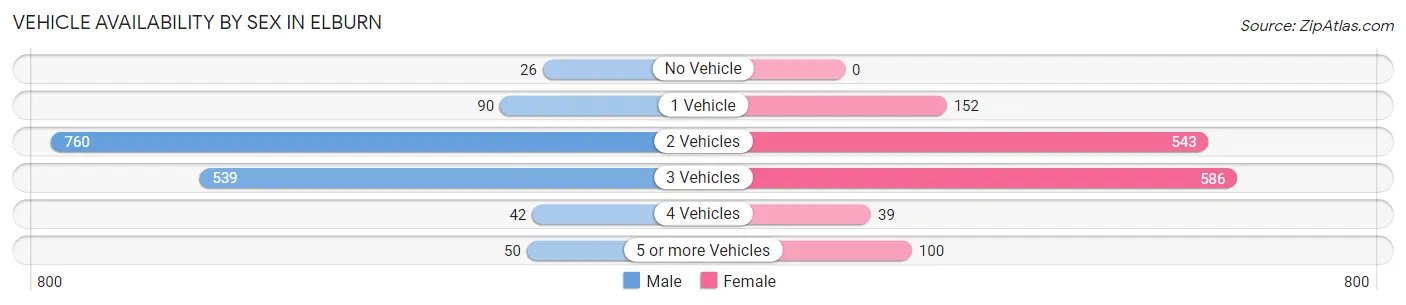
| Vehicles Available | Male | Female |
| No Vehicle | 26 (1.7%) | 0 (0.0%) |
| 1 Vehicle | 90 (6.0%) | 152 (10.7%) |
| 2 Vehicles | 760 (50.4%) | 543 (38.2%) |
| 3 Vehicles | 539 (35.8%) | 586 (41.3%) |
| 4 Vehicles | 42 (2.8%) | 39 (2.8%) |
| 5 or more Vehicles | 50 (3.3%) | 100 (7.0%) |
| Total | 1,507 (100.0%) | 1,420 (100.0%) |
Commute Time in Elburn
The most frequently occuring commute durations in Elburn are 20 to 24 minutes (430 commuters, 17.7%), 30 to 34 minutes (318 commuters, 13.1%), and 40 to 44 minutes (279 commuters, 11.5%).
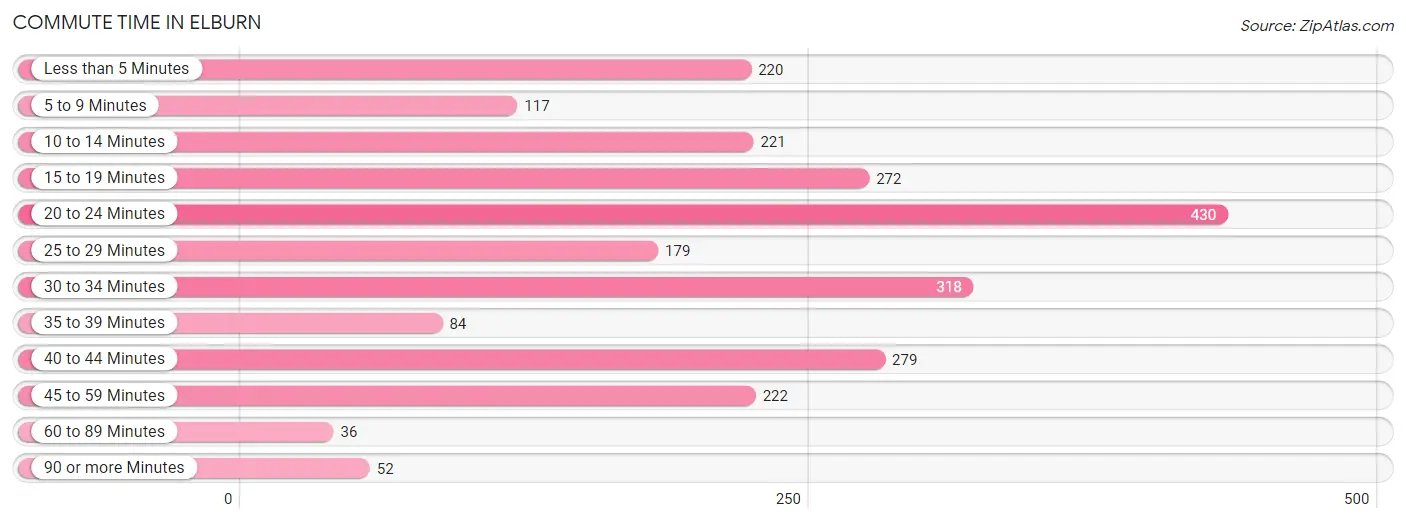
| Commute Time | # Commuters | % Commuters |
| Less than 5 Minutes | 220 | 9.0% |
| 5 to 9 Minutes | 117 | 4.8% |
| 10 to 14 Minutes | 221 | 9.1% |
| 15 to 19 Minutes | 272 | 11.2% |
| 20 to 24 Minutes | 430 | 17.7% |
| 25 to 29 Minutes | 179 | 7.4% |
| 30 to 34 Minutes | 318 | 13.1% |
| 35 to 39 Minutes | 84 | 3.5% |
| 40 to 44 Minutes | 279 | 11.5% |
| 45 to 59 Minutes | 222 | 9.1% |
| 60 to 89 Minutes | 36 | 1.5% |
| 90 or more Minutes | 52 | 2.1% |
Commute Time by Sex in Elburn
The most common commute times in Elburn are 20 to 24 minutes (276 commuters, 21.5%) for males and 10 to 14 minutes (202 commuters, 17.6%) for females.
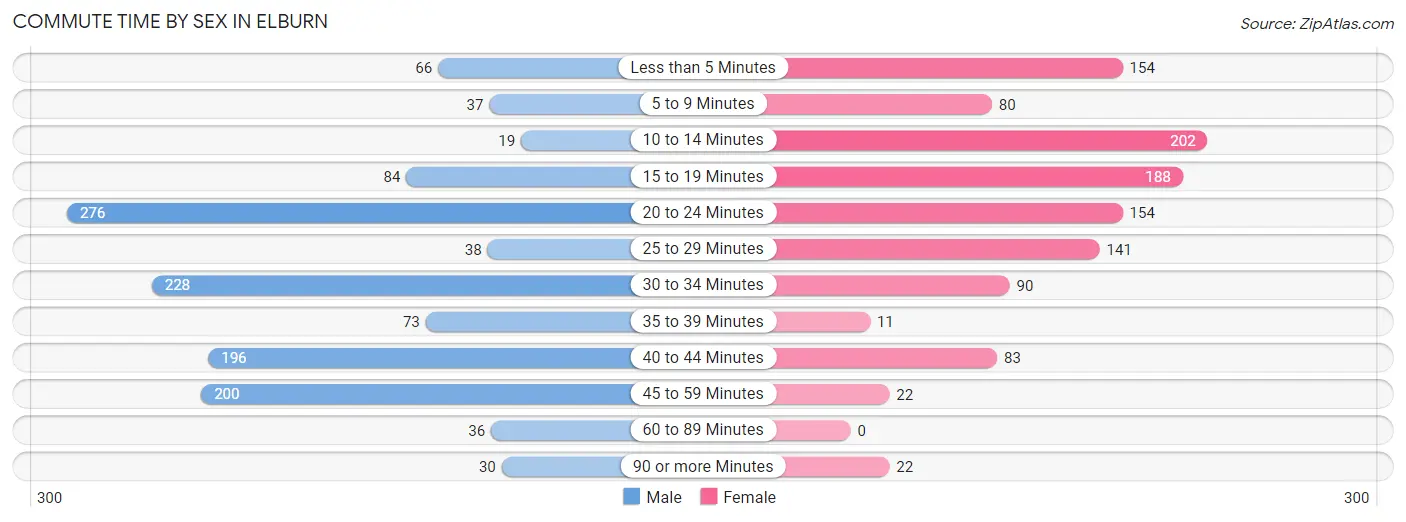
| Commute Time | Male | Female |
| Less than 5 Minutes | 66 (5.1%) | 154 (13.4%) |
| 5 to 9 Minutes | 37 (2.9%) | 80 (7.0%) |
| 10 to 14 Minutes | 19 (1.5%) | 202 (17.6%) |
| 15 to 19 Minutes | 84 (6.6%) | 188 (16.4%) |
| 20 to 24 Minutes | 276 (21.5%) | 154 (13.4%) |
| 25 to 29 Minutes | 38 (3.0%) | 141 (12.3%) |
| 30 to 34 Minutes | 228 (17.8%) | 90 (7.9%) |
| 35 to 39 Minutes | 73 (5.7%) | 11 (1.0%) |
| 40 to 44 Minutes | 196 (15.3%) | 83 (7.2%) |
| 45 to 59 Minutes | 200 (15.6%) | 22 (1.9%) |
| 60 to 89 Minutes | 36 (2.8%) | 0 (0.0%) |
| 90 or more Minutes | 30 (2.3%) | 22 (1.9%) |
Time of Departure to Work by Sex in Elburn
The most frequent times of departure to work in Elburn are 5:30 AM to 5:59 AM (274, 21.4%) for males and 7:30 AM to 7:59 AM (299, 26.1%) for females.
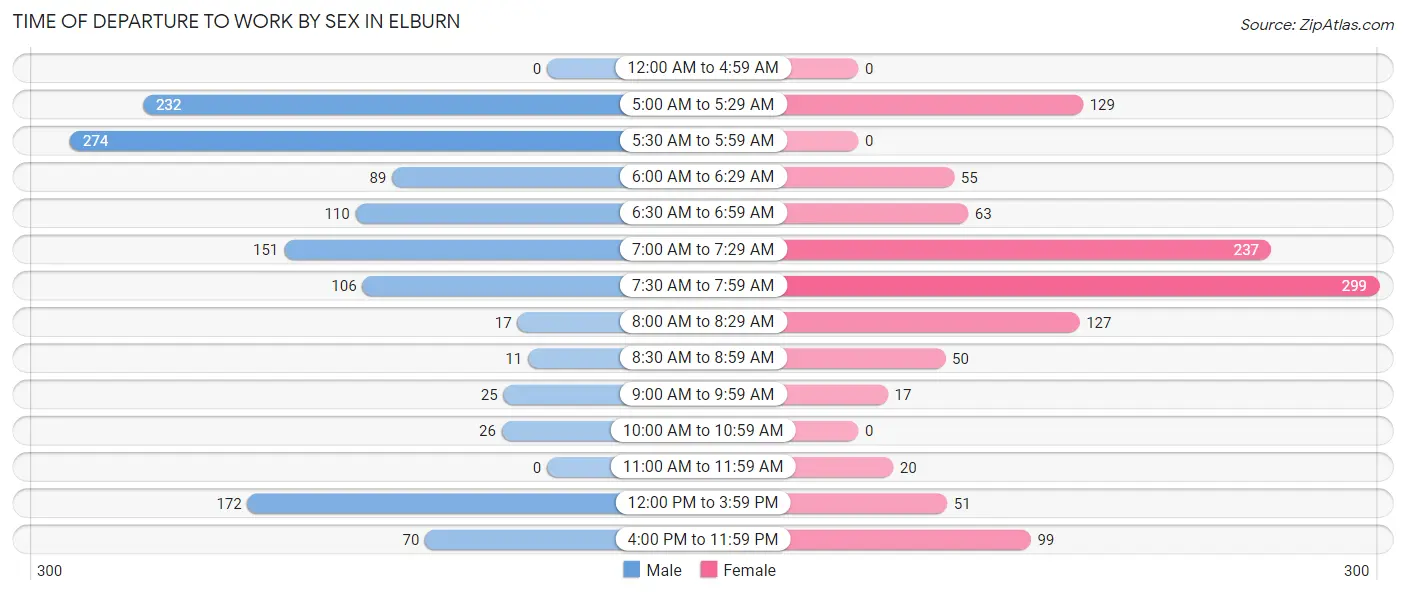
| Time of Departure | Male | Female |
| 12:00 AM to 4:59 AM | 0 (0.0%) | 0 (0.0%) |
| 5:00 AM to 5:29 AM | 232 (18.1%) | 129 (11.3%) |
| 5:30 AM to 5:59 AM | 274 (21.4%) | 0 (0.0%) |
| 6:00 AM to 6:29 AM | 89 (6.9%) | 55 (4.8%) |
| 6:30 AM to 6:59 AM | 110 (8.6%) | 63 (5.5%) |
| 7:00 AM to 7:29 AM | 151 (11.8%) | 237 (20.7%) |
| 7:30 AM to 7:59 AM | 106 (8.3%) | 299 (26.1%) |
| 8:00 AM to 8:29 AM | 17 (1.3%) | 127 (11.1%) |
| 8:30 AM to 8:59 AM | 11 (0.9%) | 50 (4.4%) |
| 9:00 AM to 9:59 AM | 25 (1.9%) | 17 (1.5%) |
| 10:00 AM to 10:59 AM | 26 (2.0%) | 0 (0.0%) |
| 11:00 AM to 11:59 AM | 0 (0.0%) | 20 (1.7%) |
| 12:00 PM to 3:59 PM | 172 (13.4%) | 51 (4.4%) |
| 4:00 PM to 11:59 PM | 70 (5.5%) | 99 (8.6%) |
| Total | 1,283 (100.0%) | 1,147 (100.0%) |
Housing Occupancy in Elburn
Occupancy by Ownership in Elburn
Of the total 2,122 dwellings in Elburn, owner-occupied units account for 1,930 (90.9%), while renter-occupied units make up 192 (9.0%).
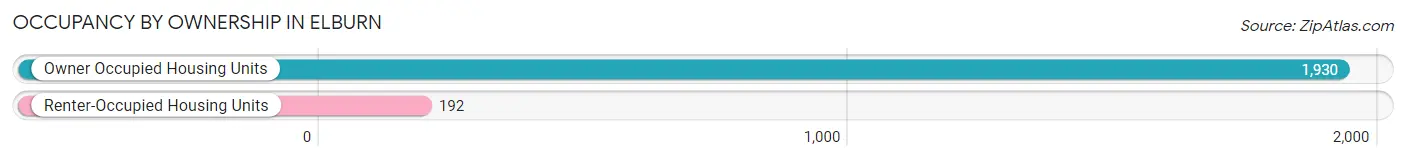
| Occupancy | # Housing Units | % Housing Units |
| Owner Occupied Housing Units | 1,930 | 90.9% |
| Renter-Occupied Housing Units | 192 | 9.0% |
| Total Occupied Housing Units | 2,122 | 100.0% |
Occupancy by Household Size in Elburn
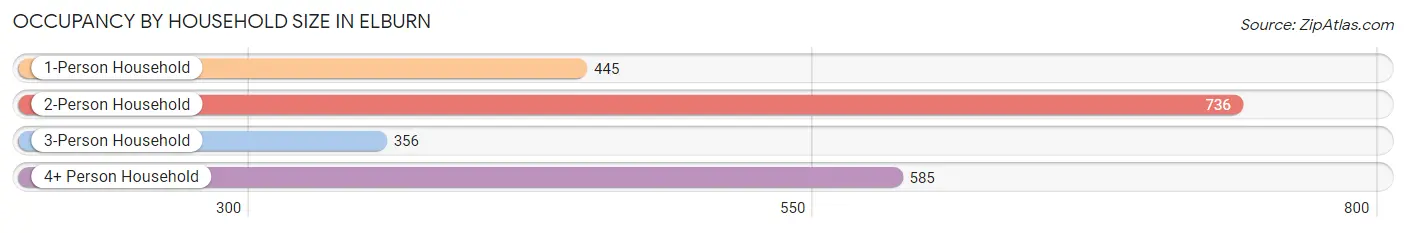
| Household Size | # Housing Units | % Housing Units |
| 1-Person Household | 445 | 21.0% |
| 2-Person Household | 736 | 34.7% |
| 3-Person Household | 356 | 16.8% |
| 4+ Person Household | 585 | 27.6% |
| Total Housing Units | 2,122 | 100.0% |
Occupancy by Ownership by Household Size in Elburn
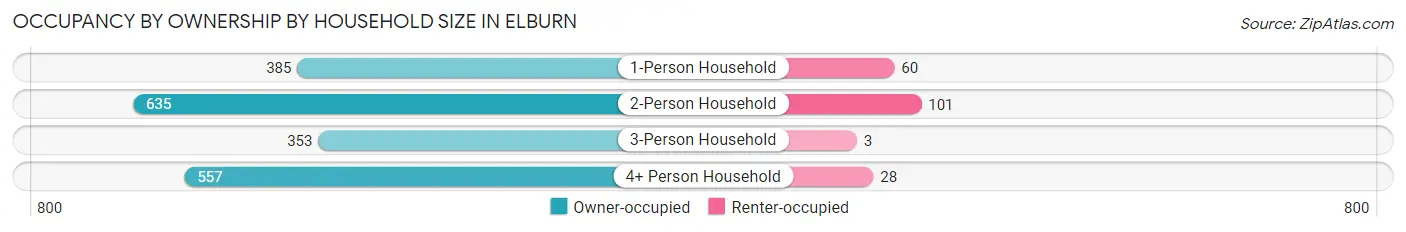
| Household Size | Owner-occupied | Renter-occupied |
| 1-Person Household | 385 (86.5%) | 60 (13.5%) |
| 2-Person Household | 635 (86.3%) | 101 (13.7%) |
| 3-Person Household | 353 (99.2%) | 3 (0.8%) |
| 4+ Person Household | 557 (95.2%) | 28 (4.8%) |
| Total Housing Units | 1,930 (90.9%) | 192 (9.0%) |
Occupancy by Educational Attainment in Elburn
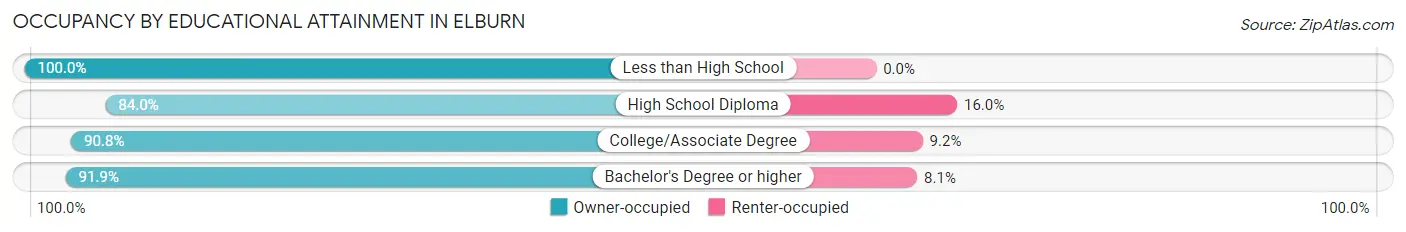
| Household Size | Owner-occupied | Renter-occupied |
| Less than High School | 18 (100.0%) | 0 (0.0%) |
| High School Diploma | 131 (84.0%) | 25 (16.0%) |
| College/Associate Degree | 719 (90.8%) | 73 (9.2%) |
| Bachelor's Degree or higher | 1,062 (91.9%) | 94 (8.1%) |
Occupancy by Age of Householder in Elburn
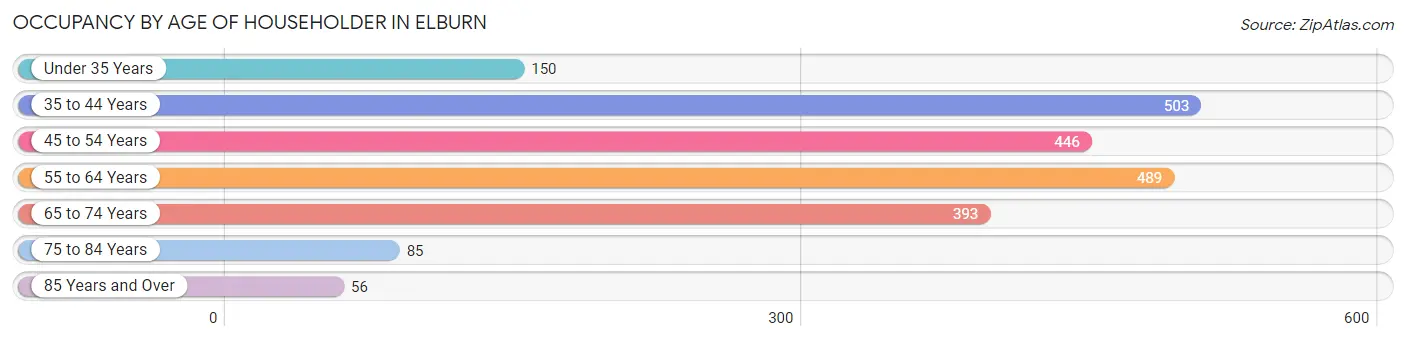
| Age Bracket | # Households | % Households |
| Under 35 Years | 150 | 7.1% |
| 35 to 44 Years | 503 | 23.7% |
| 45 to 54 Years | 446 | 21.0% |
| 55 to 64 Years | 489 | 23.0% |
| 65 to 74 Years | 393 | 18.5% |
| 75 to 84 Years | 85 | 4.0% |
| 85 Years and Over | 56 | 2.6% |
| Total | 2,122 | 100.0% |
Housing Finances in Elburn
Median Income by Occupancy in Elburn
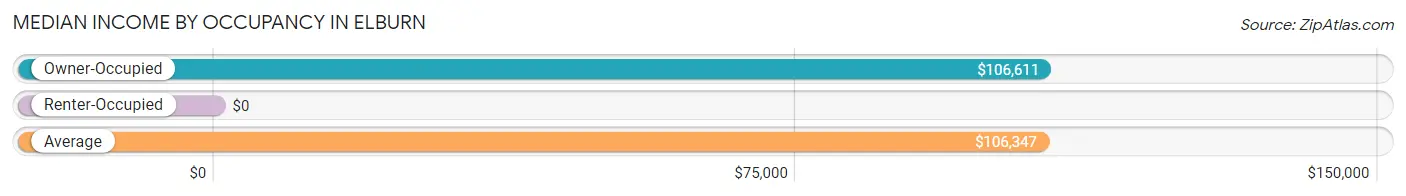
| Occupancy Type | # Households | Median Income |
| Owner-Occupied | 1,930 (90.9%) | $106,611 |
| Renter-Occupied | 192 (9.0%) | $0 |
| Average | 2,122 (100.0%) | $106,347 |
Occupancy by Householder Income Bracket in Elburn
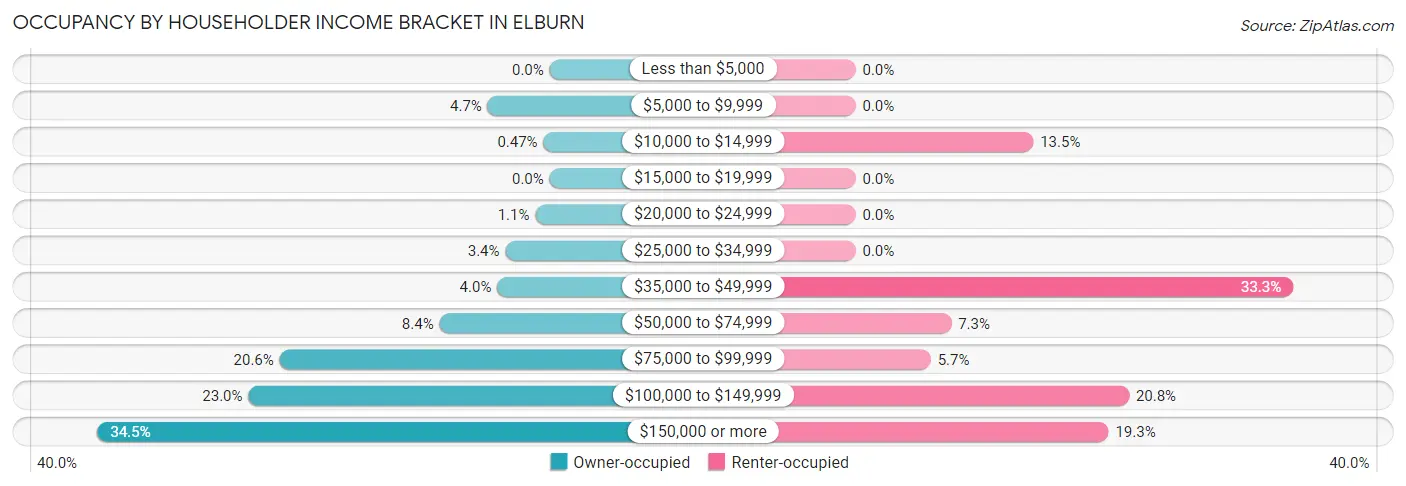
| Income Bracket | Owner-occupied | Renter-occupied |
| Less than $5,000 | 0 (0.0%) | 0 (0.0%) |
| $5,000 to $9,999 | 91 (4.7%) | 0 (0.0%) |
| $10,000 to $14,999 | 9 (0.5%) | 26 (13.5%) |
| $15,000 to $19,999 | 0 (0.0%) | 0 (0.0%) |
| $20,000 to $24,999 | 21 (1.1%) | 0 (0.0%) |
| $25,000 to $34,999 | 65 (3.4%) | 0 (0.0%) |
| $35,000 to $49,999 | 77 (4.0%) | 64 (33.3%) |
| $50,000 to $74,999 | 162 (8.4%) | 14 (7.3%) |
| $75,000 to $99,999 | 397 (20.6%) | 11 (5.7%) |
| $100,000 to $149,999 | 443 (23.0%) | 40 (20.8%) |
| $150,000 or more | 665 (34.5%) | 37 (19.3%) |
| Total | 1,930 (100.0%) | 192 (100.0%) |
Monthly Housing Cost Tiers in Elburn
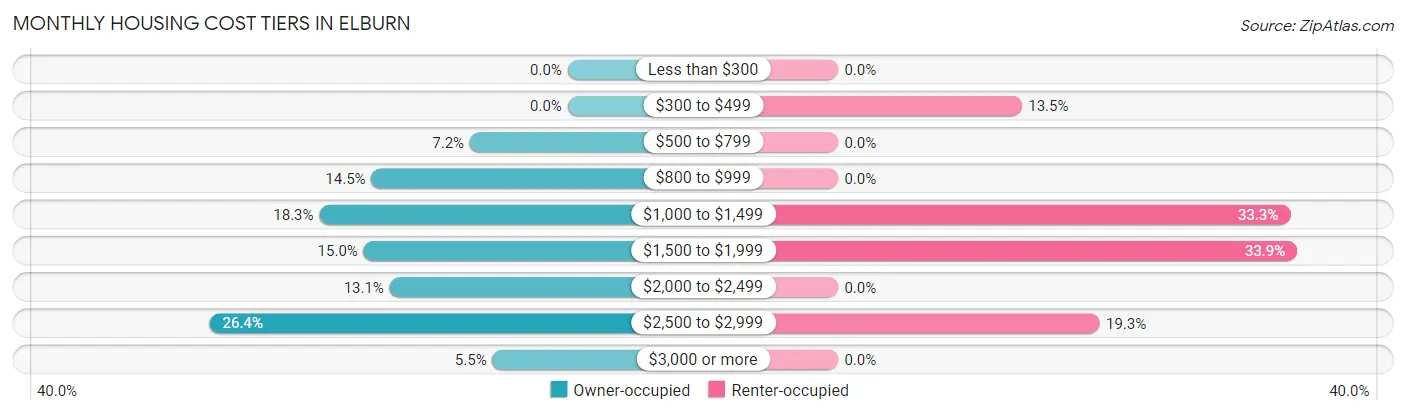
| Monthly Cost | Owner-occupied | Renter-occupied |
| Less than $300 | 0 (0.0%) | 0 (0.0%) |
| $300 to $499 | 0 (0.0%) | 26 (13.5%) |
| $500 to $799 | 139 (7.2%) | 0 (0.0%) |
| $800 to $999 | 279 (14.5%) | 0 (0.0%) |
| $1,000 to $1,499 | 353 (18.3%) | 64 (33.3%) |
| $1,500 to $1,999 | 290 (15.0%) | 65 (33.9%) |
| $2,000 to $2,499 | 253 (13.1%) | 0 (0.0%) |
| $2,500 to $2,999 | 509 (26.4%) | 37 (19.3%) |
| $3,000 or more | 107 (5.5%) | 0 (0.0%) |
| Total | 1,930 (100.0%) | 192 (100.0%) |
Physical Housing Characteristics in Elburn
Housing Structures in Elburn
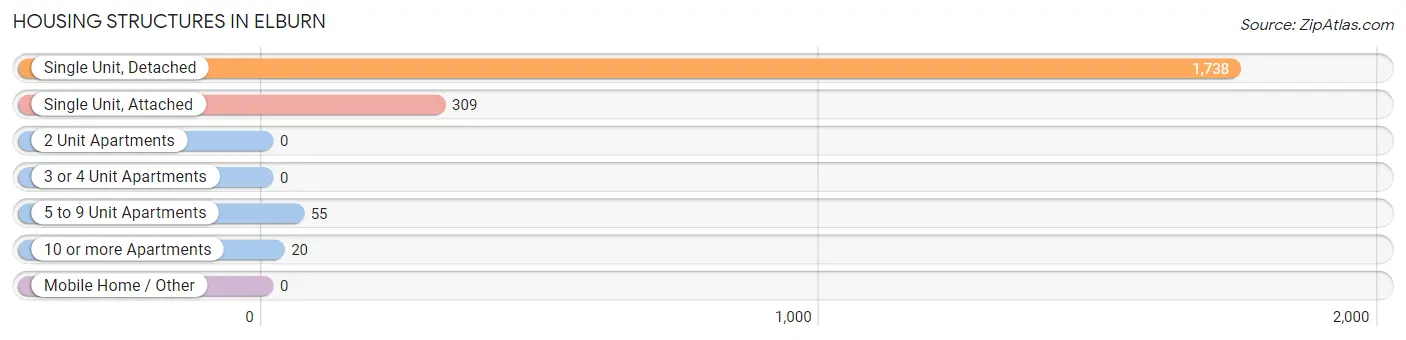
| Structure Type | # Housing Units | % Housing Units |
| Single Unit, Detached | 1,738 | 81.9% |
| Single Unit, Attached | 309 | 14.6% |
| 2 Unit Apartments | 0 | 0.0% |
| 3 or 4 Unit Apartments | 0 | 0.0% |
| 5 to 9 Unit Apartments | 55 | 2.6% |
| 10 or more Apartments | 20 | 0.9% |
| Mobile Home / Other | 0 | 0.0% |
| Total | 2,122 | 100.0% |
Housing Structures by Occupancy in Elburn
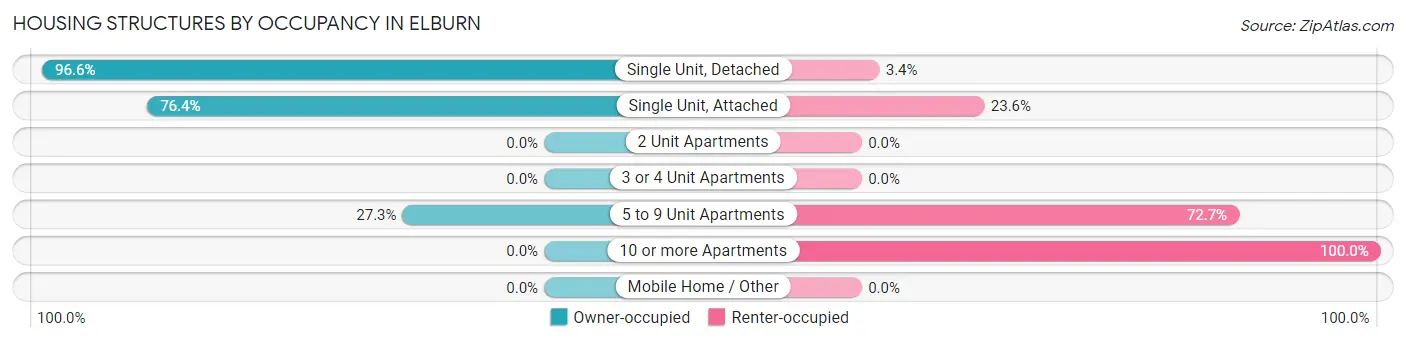
| Structure Type | Owner-occupied | Renter-occupied |
| Single Unit, Detached | 1,679 (96.6%) | 59 (3.4%) |
| Single Unit, Attached | 236 (76.4%) | 73 (23.6%) |
| 2 Unit Apartments | 0 (0.0%) | 0 (0.0%) |
| 3 or 4 Unit Apartments | 0 (0.0%) | 0 (0.0%) |
| 5 to 9 Unit Apartments | 15 (27.3%) | 40 (72.7%) |
| 10 or more Apartments | 0 (0.0%) | 20 (100.0%) |
| Mobile Home / Other | 0 (0.0%) | 0 (0.0%) |
| Total | 1,930 (90.9%) | 192 (9.0%) |
Housing Structures by Number of Rooms in Elburn
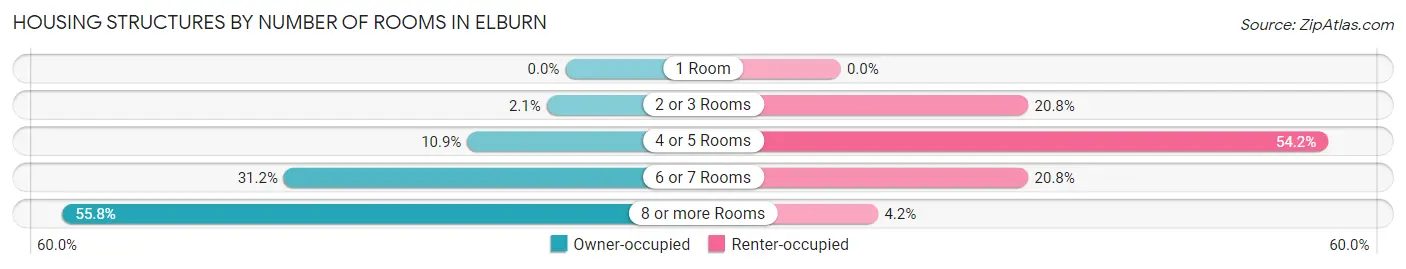
| Number of Rooms | Owner-occupied | Renter-occupied |
| 1 Room | 0 (0.0%) | 0 (0.0%) |
| 2 or 3 Rooms | 40 (2.1%) | 40 (20.8%) |
| 4 or 5 Rooms | 210 (10.9%) | 104 (54.2%) |
| 6 or 7 Rooms | 603 (31.2%) | 40 (20.8%) |
| 8 or more Rooms | 1,077 (55.8%) | 8 (4.2%) |
| Total | 1,930 (100.0%) | 192 (100.0%) |
Housing Structure by Heating Type in Elburn
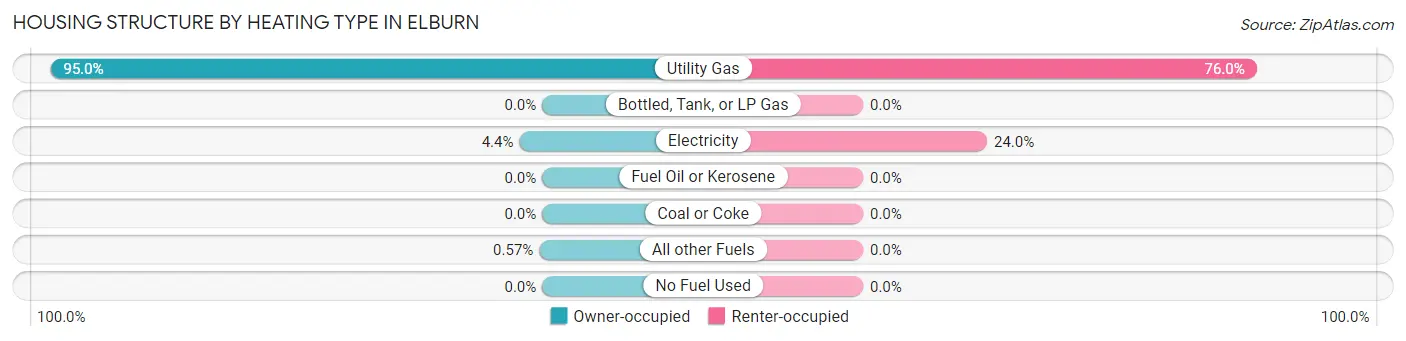
| Heating Type | Owner-occupied | Renter-occupied |
| Utility Gas | 1,834 (95.0%) | 146 (76.0%) |
| Bottled, Tank, or LP Gas | 0 (0.0%) | 0 (0.0%) |
| Electricity | 85 (4.4%) | 46 (24.0%) |
| Fuel Oil or Kerosene | 0 (0.0%) | 0 (0.0%) |
| Coal or Coke | 0 (0.0%) | 0 (0.0%) |
| All other Fuels | 11 (0.6%) | 0 (0.0%) |
| No Fuel Used | 0 (0.0%) | 0 (0.0%) |
| Total | 1,930 (100.0%) | 192 (100.0%) |
Household Vehicle Usage in Elburn
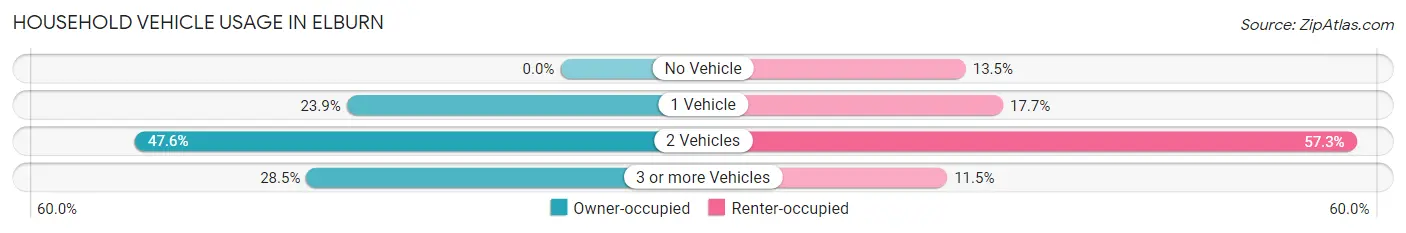
| Vehicles per Household | Owner-occupied | Renter-occupied |
| No Vehicle | 0 (0.0%) | 26 (13.5%) |
| 1 Vehicle | 462 (23.9%) | 34 (17.7%) |
| 2 Vehicles | 919 (47.6%) | 110 (57.3%) |
| 3 or more Vehicles | 549 (28.4%) | 22 (11.5%) |
| Total | 1,930 (100.0%) | 192 (100.0%) |
Real Estate & Mortgages in Elburn
Real Estate and Mortgage Overview in Elburn
| Characteristic | Without Mortgage | With Mortgage |
| Housing Units | 584 | 1,346 |
| Median Property Value | $325,500 | $329,300 |
| Median Household Income | $88,304 | $557 |
| Monthly Housing Costs | $949 | $107 |
| Real Estate Taxes | $7,799 | $36 |
Property Value by Mortgage Status in Elburn
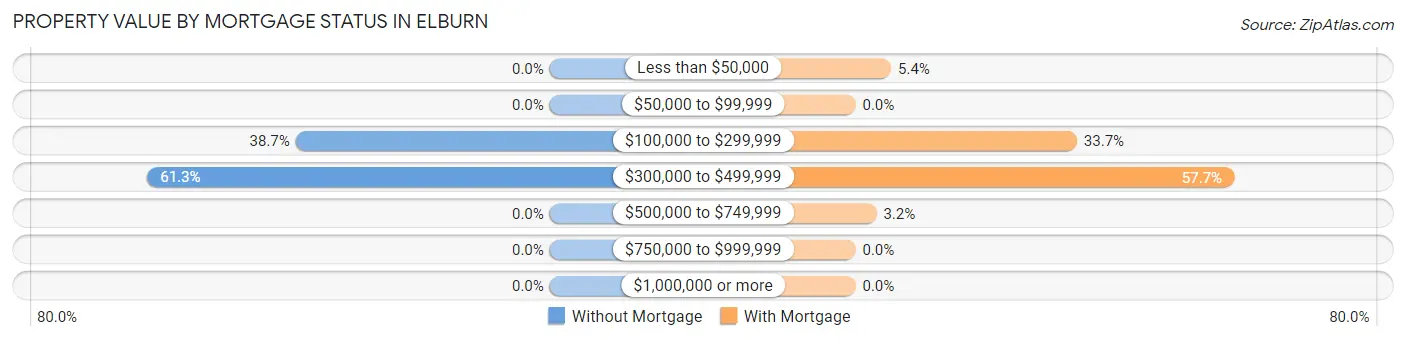
| Property Value | Without Mortgage | With Mortgage |
| Less than $50,000 | 0 (0.0%) | 73 (5.4%) |
| $50,000 to $99,999 | 0 (0.0%) | 0 (0.0%) |
| $100,000 to $299,999 | 226 (38.7%) | 454 (33.7%) |
| $300,000 to $499,999 | 358 (61.3%) | 776 (57.7%) |
| $500,000 to $749,999 | 0 (0.0%) | 43 (3.2%) |
| $750,000 to $999,999 | 0 (0.0%) | 0 (0.0%) |
| $1,000,000 or more | 0 (0.0%) | 0 (0.0%) |
| Total | 584 (100.0%) | 1,346 (100.0%) |
Household Income by Mortgage Status in Elburn
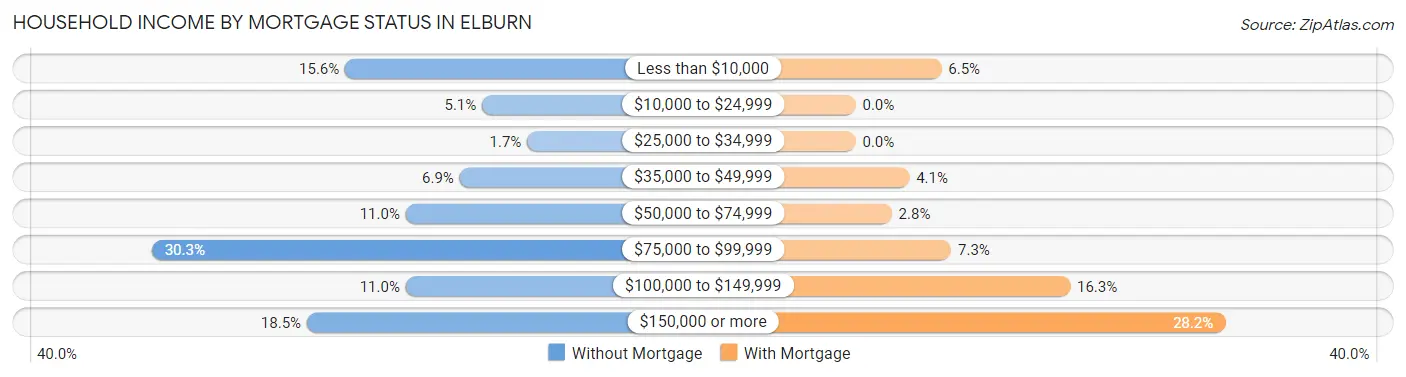
| Household Income | Without Mortgage | With Mortgage |
| Less than $10,000 | 91 (15.6%) | 88 (6.5%) |
| $10,000 to $24,999 | 30 (5.1%) | 0 (0.0%) |
| $25,000 to $34,999 | 10 (1.7%) | 0 (0.0%) |
| $35,000 to $49,999 | 40 (6.9%) | 55 (4.1%) |
| $50,000 to $74,999 | 64 (11.0%) | 37 (2.8%) |
| $75,000 to $99,999 | 177 (30.3%) | 98 (7.3%) |
| $100,000 to $149,999 | 64 (11.0%) | 220 (16.3%) |
| $150,000 or more | 108 (18.5%) | 379 (28.2%) |
| Total | 584 (100.0%) | 1,346 (100.0%) |
Property Value to Household Income Ratio in Elburn
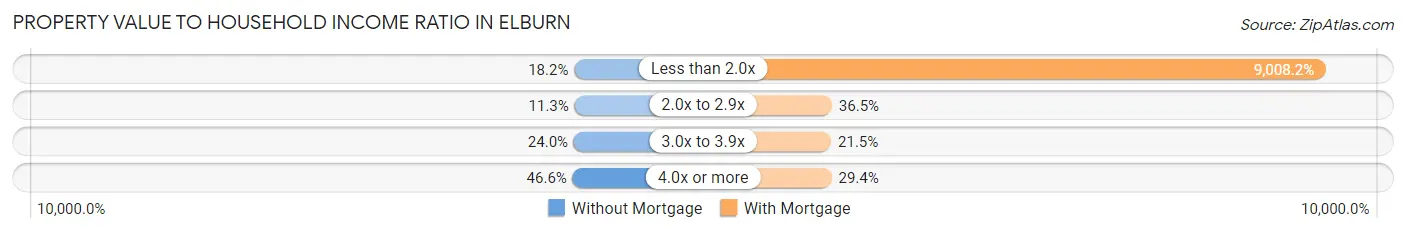
| Value-to-Income Ratio | Without Mortgage | With Mortgage |
| Less than 2.0x | 106 (18.1%) | 121,250 (9,008.2%) |
| 2.0x to 2.9x | 66 (11.3%) | 491 (36.5%) |
| 3.0x to 3.9x | 140 (24.0%) | 289 (21.5%) |
| 4.0x or more | 272 (46.6%) | 395 (29.3%) |
| Total | 584 (100.0%) | 1,346 (100.0%) |
Real Estate Taxes by Mortgage Status in Elburn
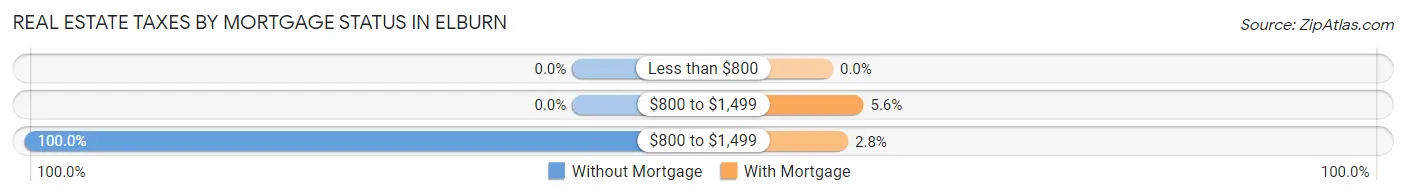
| Property Taxes | Without Mortgage | With Mortgage |
| Less than $800 | 0 (0.0%) | 0 (0.0%) |
| $800 to $1,499 | 0 (0.0%) | 75 (5.6%) |
| $800 to $1,499 | 584 (100.0%) | 37 (2.8%) |
| Total | 584 (100.0%) | 1,346 (100.0%) |
Health & Disability in Elburn
Health Insurance Coverage by Age in Elburn
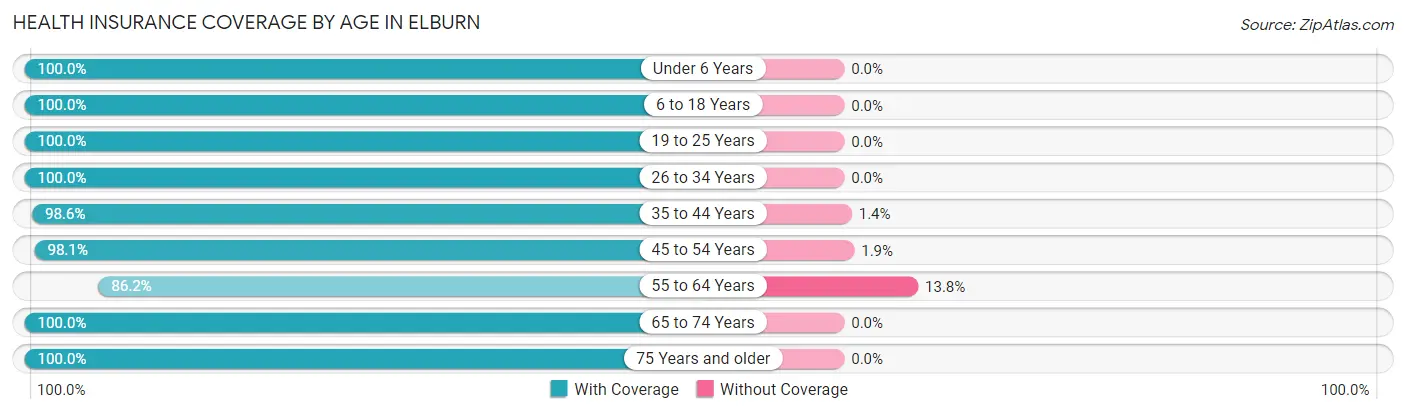
| Age Bracket | With Coverage | Without Coverage |
| Under 6 Years | 246 (100.0%) | 0 (0.0%) |
| 6 to 18 Years | 1,725 (100.0%) | 0 (0.0%) |
| 19 to 25 Years | 451 (100.0%) | 0 (0.0%) |
| 26 to 34 Years | 269 (100.0%) | 0 (0.0%) |
| 35 to 44 Years | 845 (98.6%) | 12 (1.4%) |
| 45 to 54 Years | 740 (98.1%) | 14 (1.9%) |
| 55 to 64 Years | 670 (86.2%) | 107 (13.8%) |
| 65 to 74 Years | 646 (100.0%) | 0 (0.0%) |
| 75 Years and older | 233 (100.0%) | 0 (0.0%) |
| Total | 5,825 (97.8%) | 133 (2.2%) |
Health Insurance Coverage by Citizenship Status in Elburn
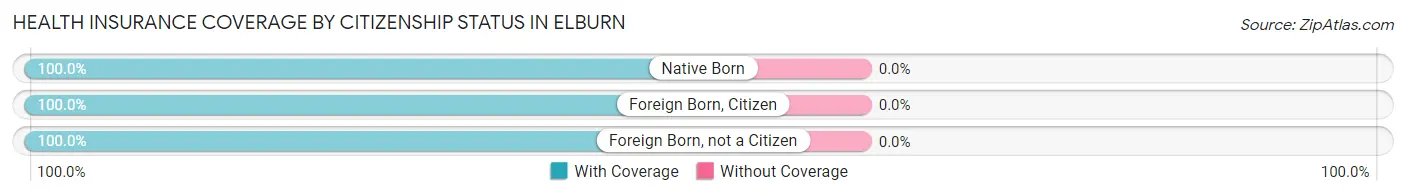
| Citizenship Status | With Coverage | Without Coverage |
| Native Born | 246 (100.0%) | 0 (0.0%) |
| Foreign Born, Citizen | 1,725 (100.0%) | 0 (0.0%) |
| Foreign Born, not a Citizen | 451 (100.0%) | 0 (0.0%) |
Health Insurance Coverage by Household Income in Elburn
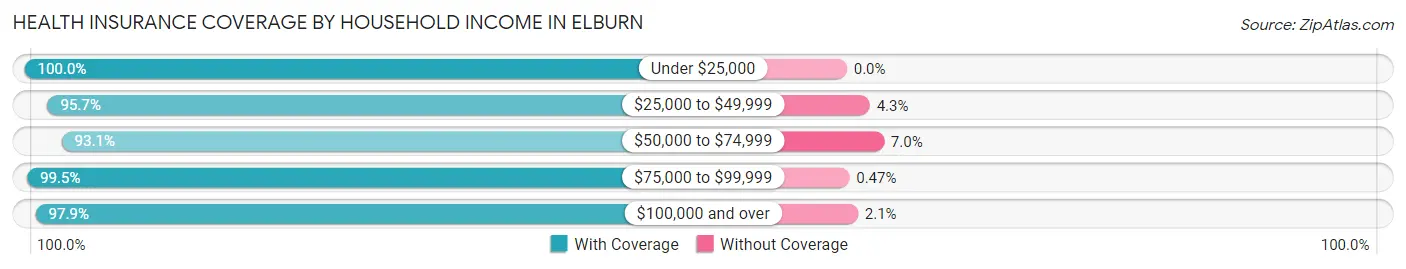
| Household Income | With Coverage | Without Coverage |
| Under $25,000 | 147 (100.0%) | 0 (0.0%) |
| $25,000 to $49,999 | 290 (95.7%) | 13 (4.3%) |
| $50,000 to $74,999 | 375 (93.0%) | 28 (7.0%) |
| $75,000 to $99,999 | 849 (99.5%) | 4 (0.5%) |
| $100,000 and over | 4,164 (97.9%) | 88 (2.1%) |
Public vs Private Health Insurance Coverage by Age in Elburn
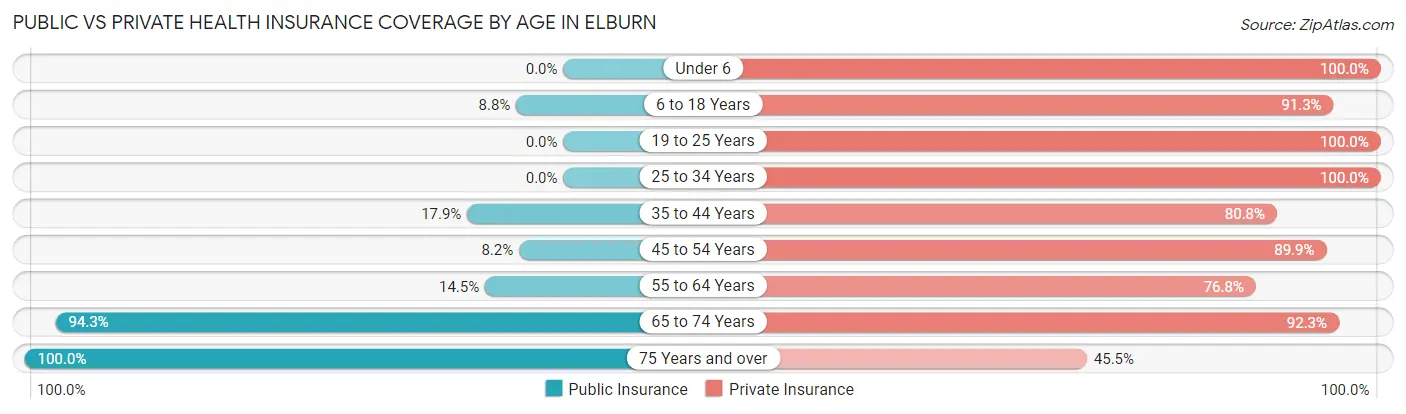
| Age Bracket | Public Insurance | Private Insurance |
| Under 6 | 0 (0.0%) | 246 (100.0%) |
| 6 to 18 Years | 151 (8.7%) | 1,574 (91.2%) |
| 19 to 25 Years | 0 (0.0%) | 451 (100.0%) |
| 25 to 34 Years | 0 (0.0%) | 269 (100.0%) |
| 35 to 44 Years | 153 (17.8%) | 692 (80.7%) |
| 45 to 54 Years | 62 (8.2%) | 678 (89.9%) |
| 55 to 64 Years | 113 (14.5%) | 597 (76.8%) |
| 65 to 74 Years | 609 (94.3%) | 596 (92.3%) |
| 75 Years and over | 233 (100.0%) | 106 (45.5%) |
| Total | 1,321 (22.2%) | 5,209 (87.4%) |
Disability Status by Sex by Age in Elburn
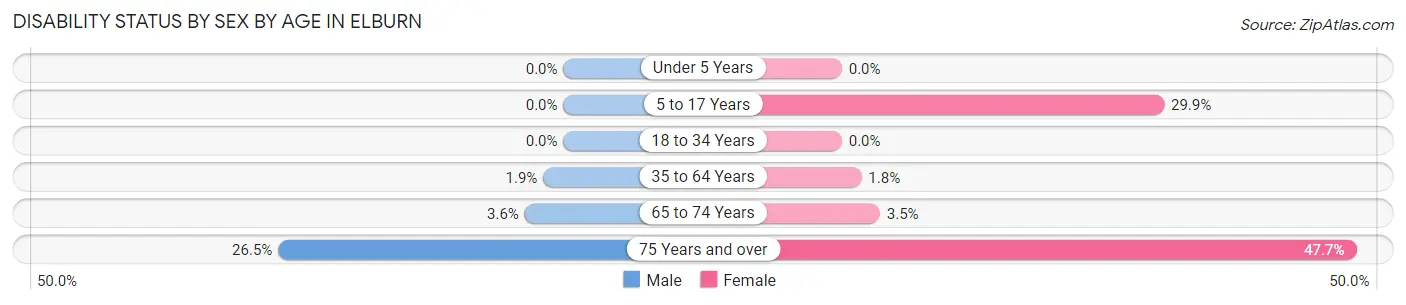
| Age Bracket | Male | Female |
| Under 5 Years | 0 (0.0%) | 0 (0.0%) |
| 5 to 17 Years | 0 (0.0%) | 175 (29.9%) |
| 18 to 34 Years | 0 (0.0%) | 0 (0.0%) |
| 35 to 64 Years | 22 (1.9%) | 22 (1.8%) |
| 65 to 74 Years | 11 (3.6%) | 12 (3.5%) |
| 75 Years and over | 9 (26.5%) | 95 (47.7%) |
Disability Class by Sex by Age in Elburn
Disability Class: Hearing Difficulty
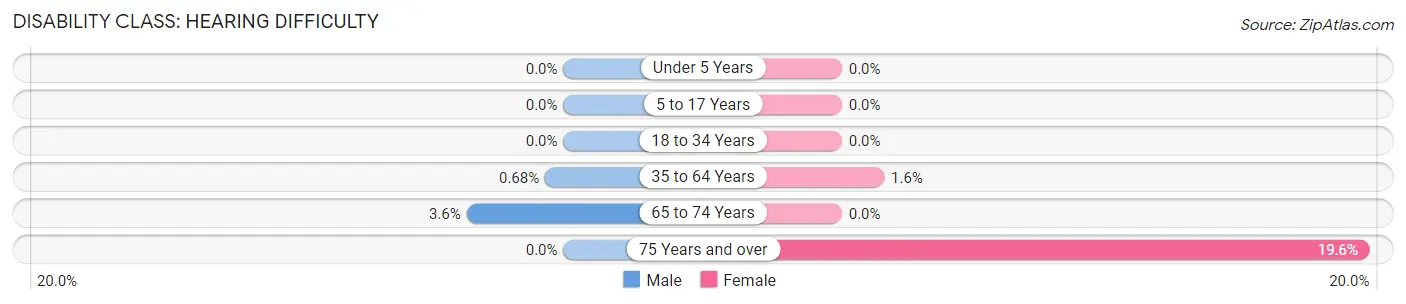
| Age Bracket | Male | Female |
| Under 5 Years | 0 (0.0%) | 0 (0.0%) |
| 5 to 17 Years | 0 (0.0%) | 0 (0.0%) |
| 18 to 34 Years | 0 (0.0%) | 0 (0.0%) |
| 35 to 64 Years | 8 (0.7%) | 19 (1.6%) |
| 65 to 74 Years | 11 (3.6%) | 0 (0.0%) |
| 75 Years and over | 0 (0.0%) | 39 (19.6%) |
Disability Class: Vision Difficulty
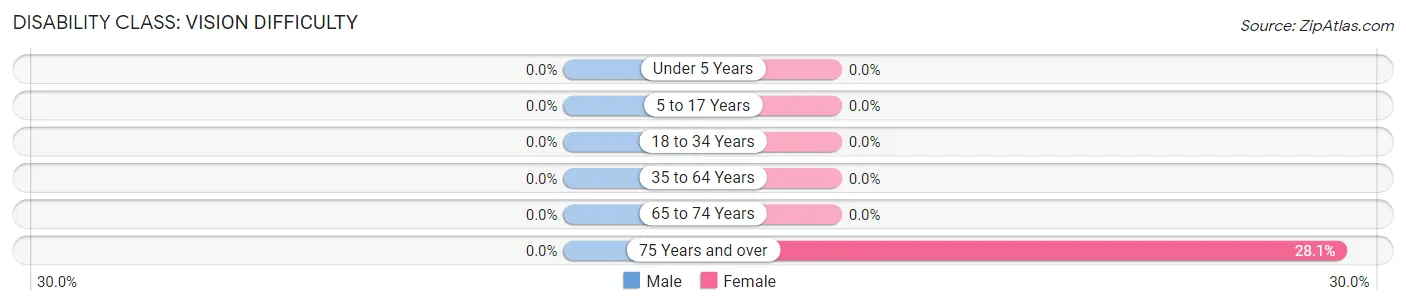
| Age Bracket | Male | Female |
| Under 5 Years | 0 (0.0%) | 0 (0.0%) |
| 5 to 17 Years | 0 (0.0%) | 0 (0.0%) |
| 18 to 34 Years | 0 (0.0%) | 0 (0.0%) |
| 35 to 64 Years | 0 (0.0%) | 0 (0.0%) |
| 65 to 74 Years | 0 (0.0%) | 0 (0.0%) |
| 75 Years and over | 0 (0.0%) | 56 (28.1%) |
Disability Class: Cognitive Difficulty
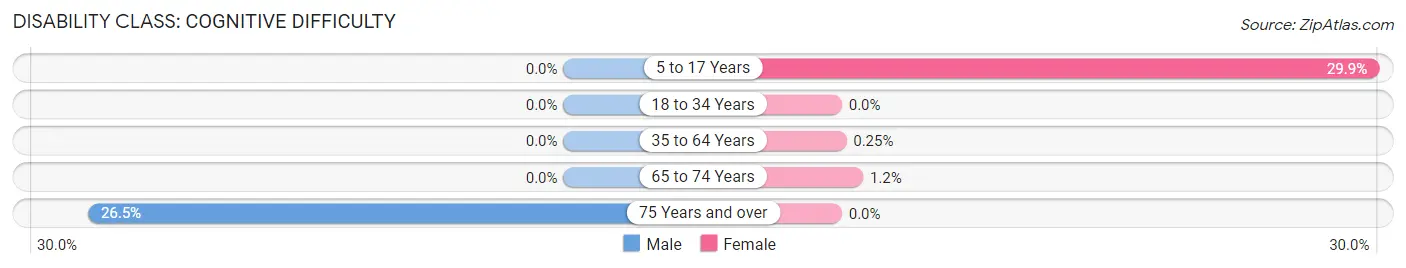
| Age Bracket | Male | Female |
| 5 to 17 Years | 0 (0.0%) | 175 (29.9%) |
| 18 to 34 Years | 0 (0.0%) | 0 (0.0%) |
| 35 to 64 Years | 0 (0.0%) | 3 (0.3%) |
| 65 to 74 Years | 0 (0.0%) | 4 (1.2%) |
| 75 Years and over | 9 (26.5%) | 0 (0.0%) |
Disability Class: Ambulatory Difficulty
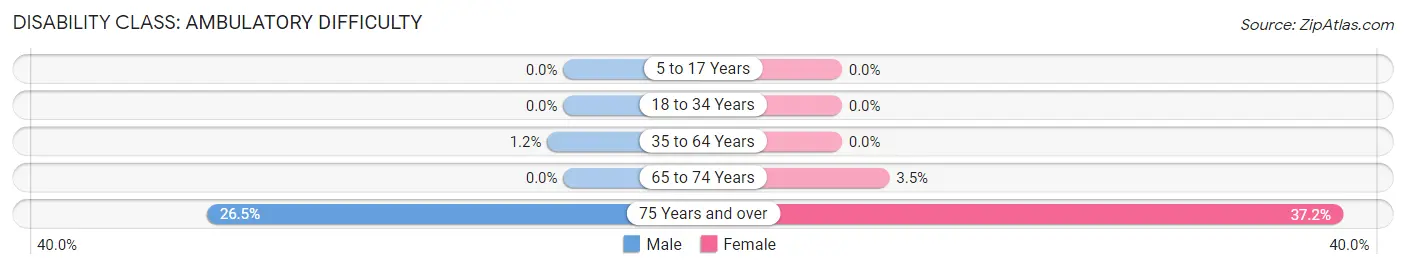
| Age Bracket | Male | Female |
| 5 to 17 Years | 0 (0.0%) | 0 (0.0%) |
| 18 to 34 Years | 0 (0.0%) | 0 (0.0%) |
| 35 to 64 Years | 14 (1.2%) | 0 (0.0%) |
| 65 to 74 Years | 0 (0.0%) | 12 (3.5%) |
| 75 Years and over | 9 (26.5%) | 74 (37.2%) |
Disability Class: Self-Care Difficulty
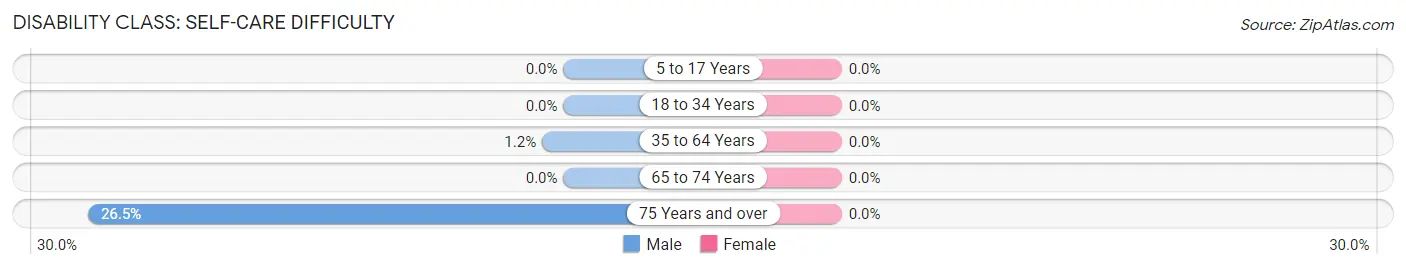
| Age Bracket | Male | Female |
| 5 to 17 Years | 0 (0.0%) | 0 (0.0%) |
| 18 to 34 Years | 0 (0.0%) | 0 (0.0%) |
| 35 to 64 Years | 14 (1.2%) | 0 (0.0%) |
| 65 to 74 Years | 0 (0.0%) | 0 (0.0%) |
| 75 Years and over | 9 (26.5%) | 0 (0.0%) |
Technology Access in Elburn
Computing Device Access in Elburn
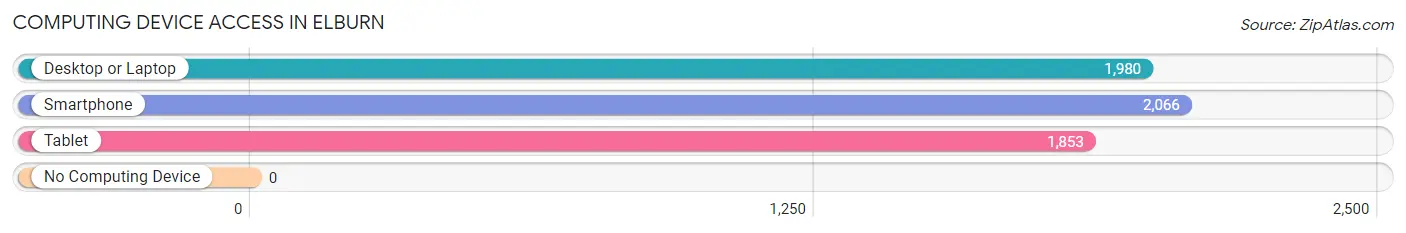
| Device Type | # Households | % Households |
| Desktop or Laptop | 1,980 | 93.3% |
| Smartphone | 2,066 | 97.4% |
| Tablet | 1,853 | 87.3% |
| No Computing Device | 0 | 0.0% |
| Total | 2,122 | 100.0% |
Internet Access in Elburn
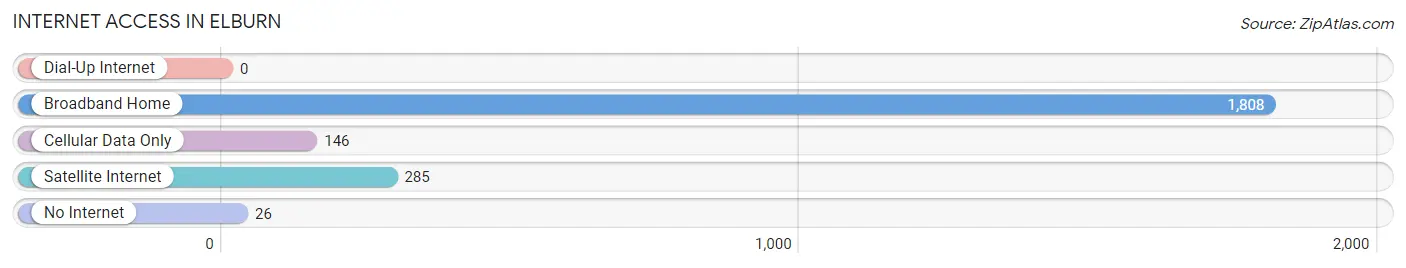
| Internet Type | # Households | % Households |
| Dial-Up Internet | 0 | 0.0% |
| Broadband Home | 1,808 | 85.2% |
| Cellular Data Only | 146 | 6.9% |
| Satellite Internet | 285 | 13.4% |
| No Internet | 26 | 1.2% |
| Total | 2,122 | 100.0% |
Elburn Summary
Elburn, Illinois is a small village located in Kane County, Illinois, about 40 miles west of Chicago. The village is situated on the Fox River and is part of the Chicago metropolitan area. As of the 2010 census, the population of Elburn was 5,602.
History
Elburn was first settled in 1837 by a group of settlers from New York. The village was originally known as Blackberry Station, named after the nearby Blackberry Creek. In 1854, the village was renamed Elburn after the Elburn family, who had moved to the area from New York. The Elburn family was instrumental in the development of the village, and the family’s name is still prominent in the village today.
In 1864, the Chicago and Northwestern Railroad was built through Elburn, connecting the village to Chicago and other nearby towns. This allowed for the growth of the village, and by the late 19th century, Elburn had become a thriving agricultural community.
In the early 20th century, Elburn began to experience a population boom. The village was incorporated in 1923, and by the 1950s, the population had grown to over 1,000. The village continued to grow throughout the 20th century, and by the 2010 census, the population had grown to 5,602.
Geography
Elburn is located in Kane County, Illinois, about 40 miles west of Chicago. The village is situated on the Fox River and is part of the Chicago metropolitan area. The village covers an area of 4.2 square miles, and the elevation is 690 feet above sea level.
The climate in Elburn is classified as humid continental, with hot, humid summers and cold, snowy winters. The average annual temperature is 48°F, and the average annual precipitation is 37 inches.
Economy
The economy of Elburn is largely based on agriculture and manufacturing. The village is home to several large agricultural operations, including a dairy farm, a vegetable farm, and a grain elevator.
Manufacturing is also an important part of the local economy. Elburn is home to several factories, including a plastics factory, a metal fabrication plant, and a printing company.
Demographics
As of the 2010 census, the population of Elburn was 5,602. The racial makeup of the village was 94.3% White, 1.2% African American, 0.3% Native American, 1.2% Asian, 0.1% Pacific Islander, 1.3% from other races, and 1.6% from two or more races. Hispanic or Latino of any race were 4.2% of the population.
The median household income in Elburn was $76,944, and the median family income was $86,944. The per capita income was $31,944. About 4.2% of families and 5.2% of the population were below the poverty line.
Common Questions
What is Per Capita Income in Elburn?
Per Capita income in Elburn is $47,332.
What is the Median Family Income in Elburn?
Median Family Income in Elburn is $118,816.
What is the Median Household income in Elburn?
Median Household Income in Elburn is $106,347.
What is Income or Wage Gap in Elburn?
Income or Wage Gap in Elburn is 44.2%.
Women in Elburn earn 55.8 cents for every dollar earned by a man.
What is Inequality or Gini Index in Elburn?
Inequality or Gini Index in Elburn is 0.38.
What is the Total Population of Elburn?
Total Population of Elburn is 5,958.
What is the Total Male Population of Elburn?
Total Male Population of Elburn is 3,143.
What is the Total Female Population of Elburn?
Total Female Population of Elburn is 2,815.
What is the Ratio of Males per 100 Females in Elburn?
There are 111.65 Males per 100 Females in Elburn.
What is the Ratio of Females per 100 Males in Elburn?
There are 89.56 Females per 100 Males in Elburn.
What is the Median Population Age in Elburn?
Median Population Age in Elburn is 37.3 Years.
What is the Average Family Size in Elburn
Average Family Size in Elburn is 3.1 People.
What is the Average Household Size in Elburn
Average Household Size in Elburn is 2.8 People.
How Large is the Labor Force in Elburn?
There are 2,964 People in the Labor Forcein in Elburn.
What is the Percentage of People in the Labor Force in Elburn?
67.6% of People are in the Labor Force in Elburn.
What is the Unemployment Rate in Elburn?
Unemployment Rate in Elburn is 0.4%.