Carterville, IL Map & Demographics
Carterville Map
Carterville Overview
$40,352
PER CAPITA INCOME
$90,146
AVG FAMILY INCOME
$59,174
AVG HOUSEHOLD INCOME
15.7%
WAGE / INCOME GAP [ % ]
84.3¢/ $1
WAGE / INCOME GAP [ $ ]
0.49
INEQUALITY / GINI INDEX
5,836
TOTAL POPULATION
2,642
MALE POPULATION
3,194
FEMALE POPULATION
82.72
MALES / 100 FEMALES
120.89
FEMALES / 100 MALES
38.6
MEDIAN AGE
3.0
AVG FAMILY SIZE
2.3
AVG HOUSEHOLD SIZE
2,610
LABOR FORCE [ PEOPLE ]
58.8%
PERCENT IN LABOR FORCE
2.7%
UNEMPLOYMENT RATE
Carterville Zip Codes
Carterville Area Codes
Income in Carterville
Income Overview in Carterville
Per Capita Income in Carterville is $40,352, while median incomes of families and households are $90,146 and $59,174 respectively.
| Characteristic | Number | Measure |
| Per Capita Income | 5,836 | $40,352 |
| Median Family Income | 1,609 | $90,146 |
| Mean Family Income | 1,609 | $112,908 |
| Median Household Income | 2,545 | $59,174 |
| Mean Household Income | 2,545 | $90,818 |
| Income Deficit | 1,609 | $0 |
| Wage / Income Gap (%) | 5,836 | 15.74% |
| Wage / Income Gap ($) | 5,836 | 84.26¢ per $1 |
| Gini / Inequality Index | 5,836 | 0.49 |
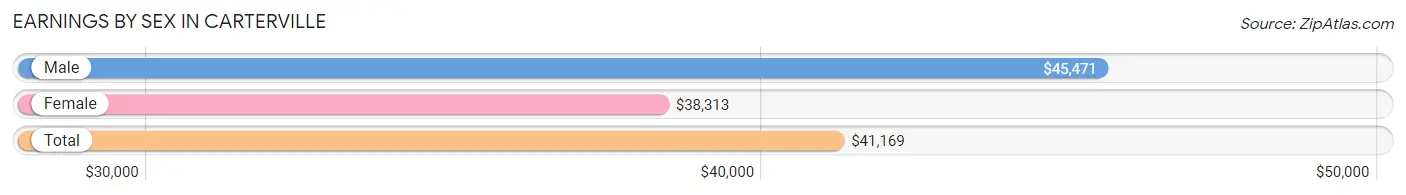
Earnings by Sex in Carterville
Average Earnings in Carterville are $41,169, $45,471 for men and $38,313 for women, a difference of 15.7%.
| Sex | Number | Average Earnings |
| Male | 1,403 (49.5%) | $45,471 |
| Female | 1,429 (50.5%) | $38,313 |
| Total | 2,832 (100.0%) | $41,169 |
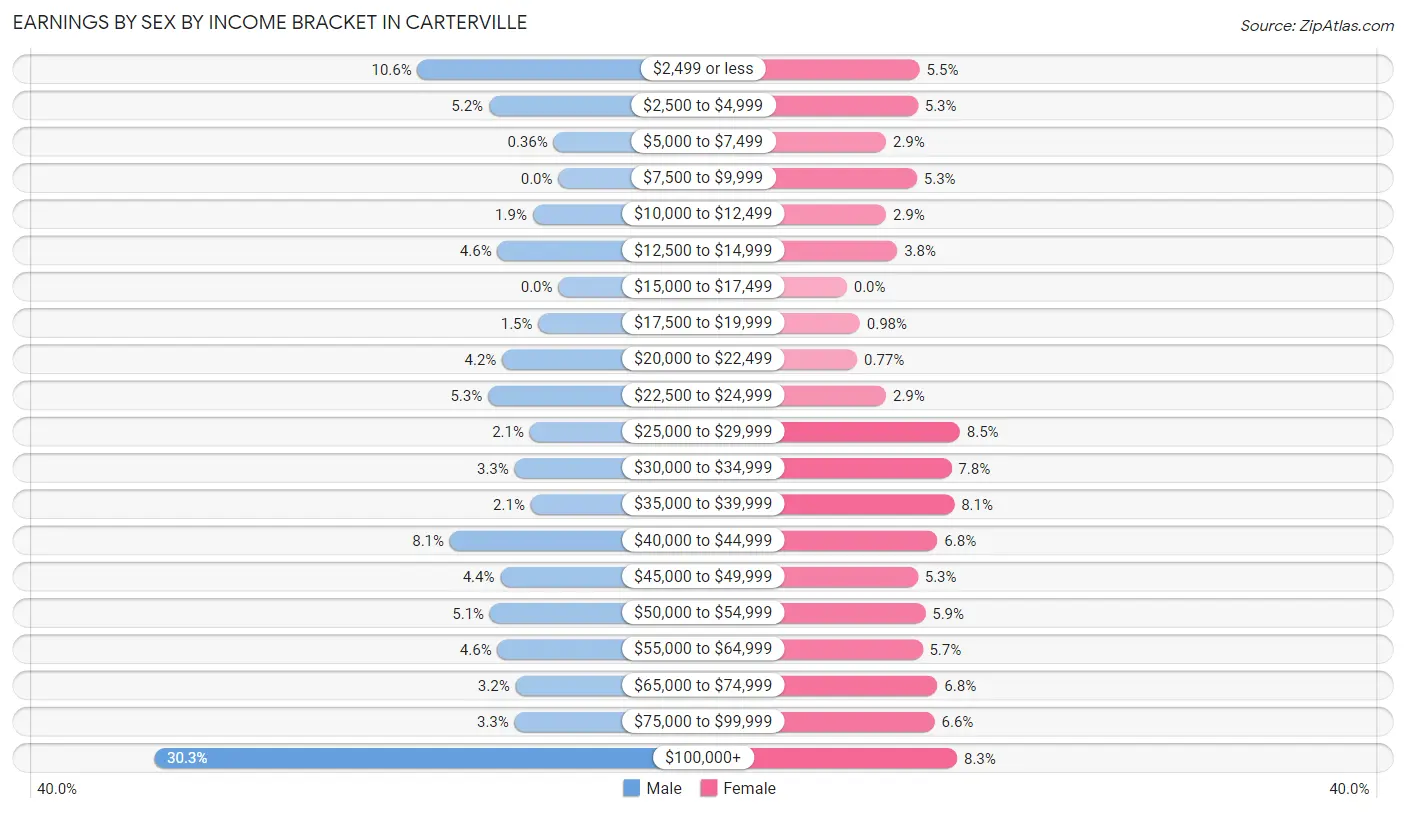
Earnings by Sex by Income Bracket in Carterville
The most common earnings brackets in Carterville are $100,000+ for men (425 | 30.3%) and $25,000 to $29,999 for women (121 | 8.5%).
| Income | Male | Female |
| $2,499 or less | 148 (10.5%) | 78 (5.5%) |
| $2,500 to $4,999 | 73 (5.2%) | 76 (5.3%) |
| $5,000 to $7,499 | 5 (0.4%) | 42 (2.9%) |
| $7,500 to $9,999 | 0 (0.0%) | 75 (5.2%) |
| $10,000 to $12,499 | 27 (1.9%) | 42 (2.9%) |
| $12,500 to $14,999 | 64 (4.6%) | 54 (3.8%) |
| $15,000 to $17,499 | 0 (0.0%) | 0 (0.0%) |
| $17,500 to $19,999 | 21 (1.5%) | 14 (1.0%) |
| $20,000 to $22,499 | 59 (4.2%) | 11 (0.8%) |
| $22,500 to $24,999 | 74 (5.3%) | 42 (2.9%) |
| $25,000 to $29,999 | 30 (2.1%) | 121 (8.5%) |
| $30,000 to $34,999 | 46 (3.3%) | 112 (7.8%) |
| $35,000 to $39,999 | 29 (2.1%) | 115 (8.1%) |
| $40,000 to $44,999 | 114 (8.1%) | 97 (6.8%) |
| $45,000 to $49,999 | 61 (4.3%) | 76 (5.3%) |
| $50,000 to $54,999 | 72 (5.1%) | 84 (5.9%) |
| $55,000 to $64,999 | 64 (4.6%) | 81 (5.7%) |
| $65,000 to $74,999 | 45 (3.2%) | 97 (6.8%) |
| $75,000 to $99,999 | 46 (3.3%) | 94 (6.6%) |
| $100,000+ | 425 (30.3%) | 118 (8.3%) |
| Total | 1,403 (100.0%) | 1,429 (100.0%) |
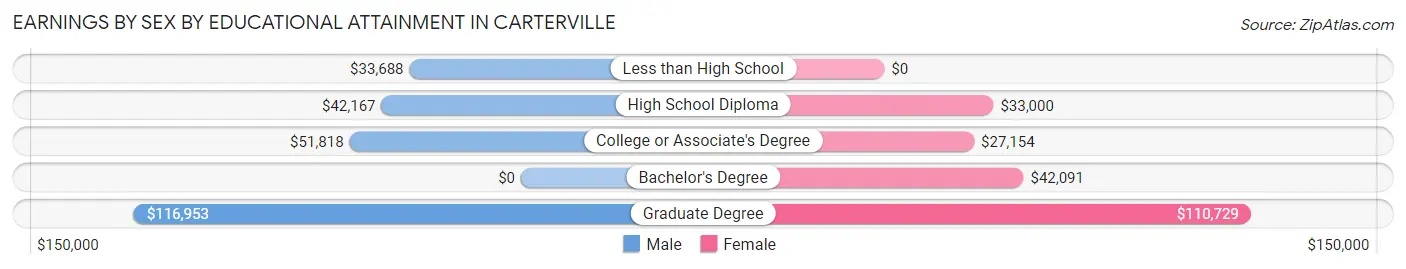
Earnings by Sex by Educational Attainment in Carterville
Average earnings in Carterville are $51,338 for men and $41,378 for women, a difference of 19.4%. Men with an educational attainment of graduate degree enjoy the highest average annual earnings of $116,953, while those with less than high school education earn the least with $33,688. Women with an educational attainment of graduate degree earn the most with the average annual earnings of $110,729, while those with college or associate's degree education have the smallest earnings of $27,154.
| Educational Attainment | Male Income | Female Income |
| Less than High School | $33,688 | $0 |
| High School Diploma | $42,167 | $33,000 |
| College or Associate's Degree | $51,818 | $27,154 |
| Bachelor's Degree | - | - |
| Graduate Degree | $116,953 | $110,729 |
| Total | $51,338 | $41,378 |
Family Income in Carterville
Family Income Brackets in Carterville
According to the Carterville family income data, there are 293 families falling into the $100,000 to $149,999 income range, which is the most common income bracket and makes up 18.2% of all families. Conversely, the less than $10,000 income bracket is the least frequent group with only 24 families (1.5%) belonging to this category.

| Income Bracket | # Families | % Families |
| Less than $10,000 | 24 | 1.5% |
| $10,000 to $14,999 | 74 | 4.6% |
| $15,000 to $24,999 | 146 | 9.1% |
| $25,000 to $34,999 | 45 | 2.8% |
| $35,000 to $49,999 | 193 | 12.0% |
| $50,000 to $74,999 | 225 | 14.0% |
| $75,000 to $99,999 | 238 | 14.8% |
| $100,000 to $149,999 | 293 | 18.2% |
| $150,000 to $199,999 | 117 | 7.3% |
| $200,000+ | 253 | 15.7% |
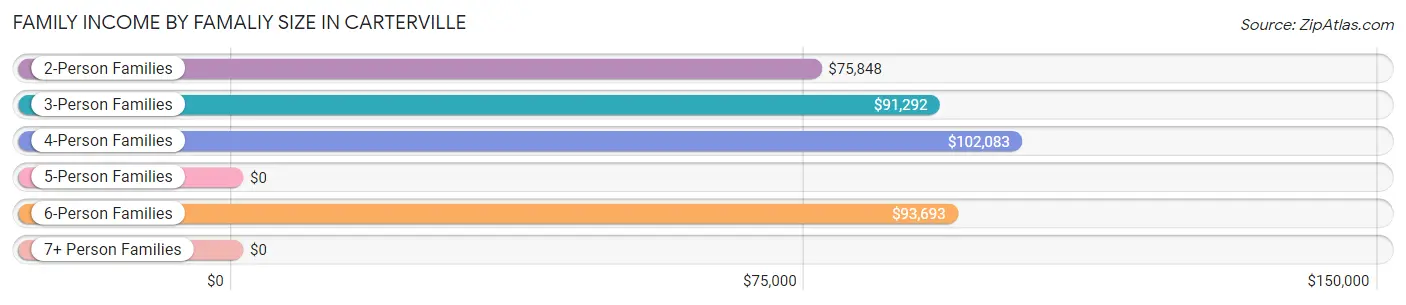
Family Income by Famaliy Size in Carterville
4-person families (189 | 11.7%) account for the highest median family income in Carterville with $102,083 per family, while 2-person families (825 | 51.3%) have the highest median income of $37,924 per family member.
| Income Bracket | # Families | Median Income |
| 2-Person Families | 825 (51.3%) | $75,848 |
| 3-Person Families | 348 (21.6%) | $91,292 |
| 4-Person Families | 189 (11.7%) | $102,083 |
| 5-Person Families | 151 (9.4%) | $0 |
| 6-Person Families | 96 (6.0%) | $93,693 |
| 7+ Person Families | 0 (0.0%) | $0 |
| Total | 1,609 (100.0%) | $90,146 |
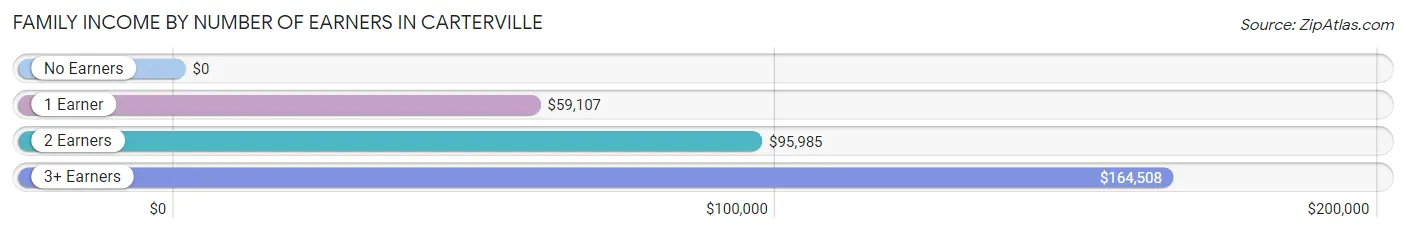
Family Income by Number of Earners in Carterville
| Number of Earners | # Families | Median Income |
| No Earners | 258 (16.0%) | $0 |
| 1 Earner | 608 (37.8%) | $59,107 |
| 2 Earners | 648 (40.3%) | $95,985 |
| 3+ Earners | 95 (5.9%) | $164,508 |
| Total | 1,609 (100.0%) | $90,146 |
Household Income in Carterville
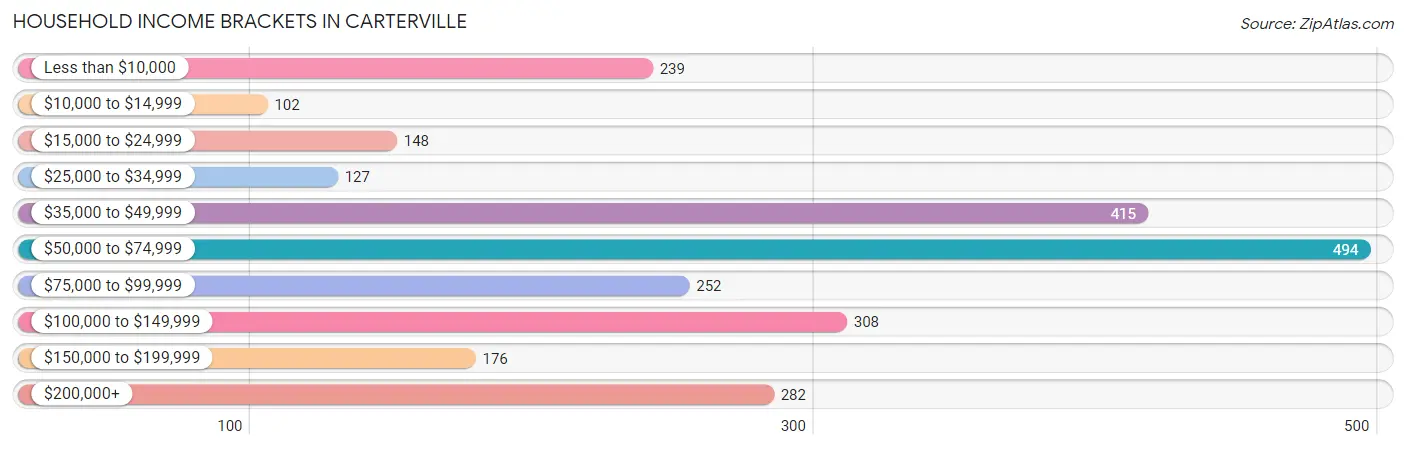
Household Income Brackets in Carterville
With 494 households falling in the category, the $50,000 to $74,999 income range is the most frequent in Carterville, accounting for 19.4% of all households. In contrast, only 102 households (4.0%) fall into the $10,000 to $14,999 income bracket, making it the least populous group.
| Income Bracket | # Households | % Households |
| Less than $10,000 | 239 | 9.4% |
| $10,000 to $14,999 | 102 | 4.0% |
| $15,000 to $24,999 | 148 | 5.8% |
| $25,000 to $34,999 | 127 | 5.0% |
| $35,000 to $49,999 | 415 | 16.3% |
| $50,000 to $74,999 | 494 | 19.4% |
| $75,000 to $99,999 | 252 | 9.9% |
| $100,000 to $149,999 | 308 | 12.1% |
| $150,000 to $199,999 | 176 | 6.9% |
| $200,000+ | 282 | 11.1% |
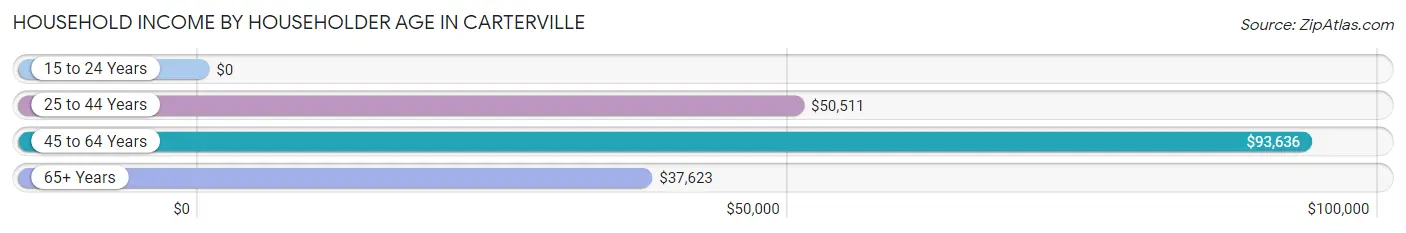
Household Income by Householder Age in Carterville
The median household income in Carterville is $59,174, with the highest median household income of $93,636 found in the 45 to 64 years age bracket for the primary householder. A total of 846 households (33.2%) fall into this category. Meanwhile, the 15 to 24 years age bracket for the primary householder has the lowest median household income of $0, with 85 households (3.3%) in this group.
| Income Bracket | # Households | Median Income |
| 15 to 24 Years | 85 (3.3%) | $0 |
| 25 to 44 Years | 811 (31.9%) | $50,511 |
| 45 to 64 Years | 846 (33.2%) | $93,636 |
| 65+ Years | 803 (31.6%) | $37,623 |
| Total | 2,545 (100.0%) | $59,174 |
Poverty in Carterville
Income Below Poverty by Sex and Age in Carterville
With 9.7% poverty level for males and 15.7% for females among the residents of Carterville, under 5 year old males and 6 to 11 year old females are the most vulnerable to poverty, with 156 males (54.9%) and 116 females (66.3%) in their respective age groups living below the poverty level.
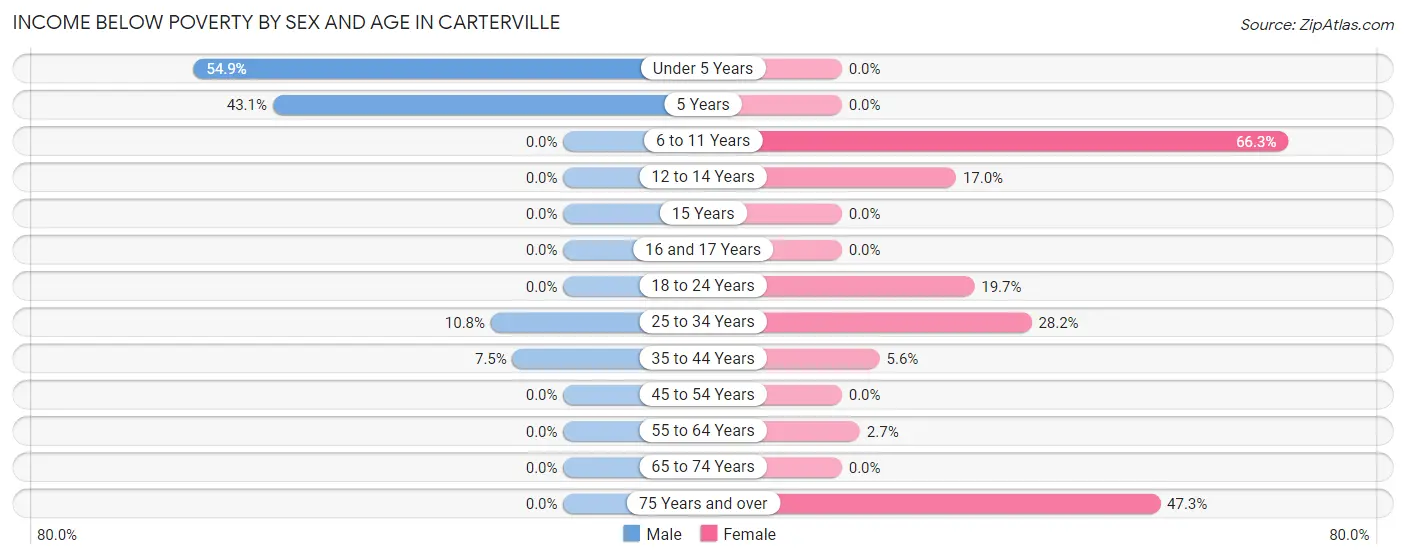
| Age Bracket | Male | Female |
| Under 5 Years | 156 (54.9%) | 0 (0.0%) |
| 5 Years | 44 (43.1%) | 0 (0.0%) |
| 6 to 11 Years | 0 (0.0%) | 116 (66.3%) |
| 12 to 14 Years | 0 (0.0%) | 20 (17.0%) |
| 15 Years | 0 (0.0%) | 0 (0.0%) |
| 16 and 17 Years | 0 (0.0%) | 0 (0.0%) |
| 18 to 24 Years | 0 (0.0%) | 48 (19.7%) |
| 25 to 34 Years | 34 (10.8%) | 98 (28.2%) |
| 35 to 44 Years | 22 (7.5%) | 23 (5.6%) |
| 45 to 54 Years | 0 (0.0%) | 0 (0.0%) |
| 55 to 64 Years | 0 (0.0%) | 13 (2.7%) |
| 65 to 74 Years | 0 (0.0%) | 0 (0.0%) |
| 75 Years and over | 0 (0.0%) | 182 (47.3%) |
| Total | 256 (9.7%) | 500 (15.7%) |
Income Above Poverty by Sex and Age in Carterville
According to the poverty statistics in Carterville, males aged 6 to 11 years and females aged under 5 years are the age groups that are most secure financially, with 100.0% of males and 100.0% of females in these age groups living above the poverty line.
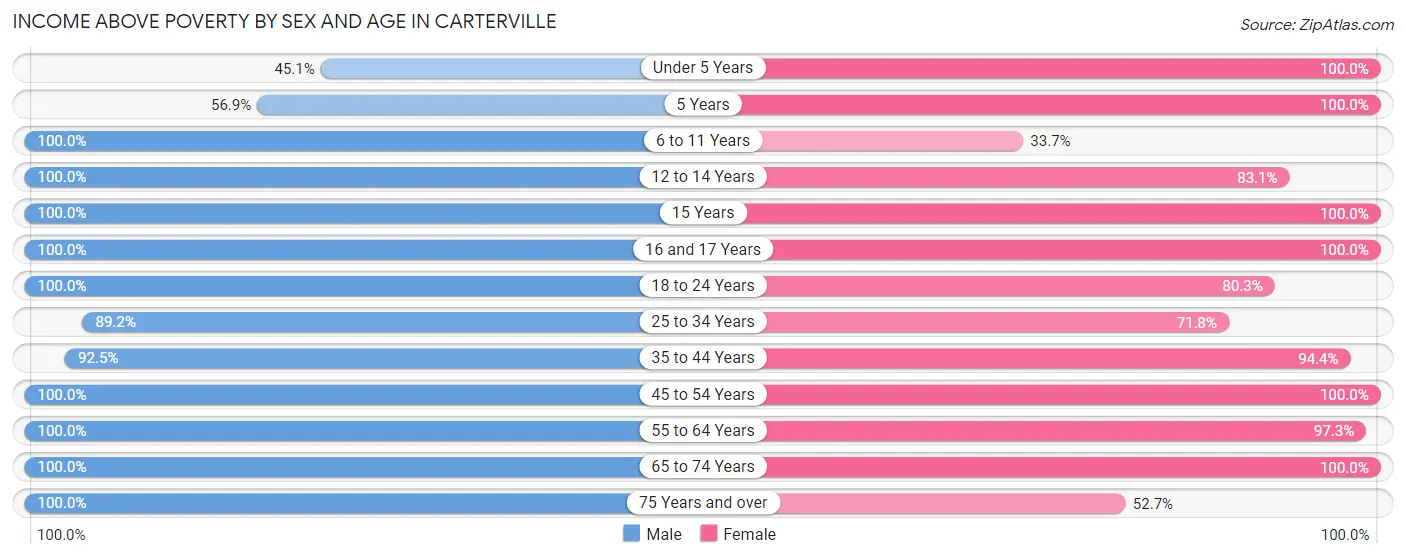
| Age Bracket | Male | Female |
| Under 5 Years | 128 (45.1%) | 174 (100.0%) |
| 5 Years | 58 (56.9%) | 118 (100.0%) |
| 6 to 11 Years | 241 (100.0%) | 59 (33.7%) |
| 12 to 14 Years | 97 (100.0%) | 98 (83.1%) |
| 15 Years | 10 (100.0%) | 66 (100.0%) |
| 16 and 17 Years | 48 (100.0%) | 50 (100.0%) |
| 18 to 24 Years | 212 (100.0%) | 196 (80.3%) |
| 25 to 34 Years | 282 (89.2%) | 250 (71.8%) |
| 35 to 44 Years | 270 (92.5%) | 387 (94.4%) |
| 45 to 54 Years | 330 (100.0%) | 264 (100.0%) |
| 55 to 64 Years | 350 (100.0%) | 471 (97.3%) |
| 65 to 74 Years | 250 (100.0%) | 345 (100.0%) |
| 75 Years and over | 110 (100.0%) | 203 (52.7%) |
| Total | 2,386 (90.3%) | 2,681 (84.3%) |
Income Below Poverty Among Married-Couple Families in Carterville
The poverty statistics for married-couple families in Carterville show that 1.4% or 17 of the total 1,236 families live below the poverty line. Families with 3 or 4 children have the highest poverty rate of 11.9%, comprising of 17 families. On the other hand, families with no children have the lowest poverty rate of 0.0%, which includes 0 families.
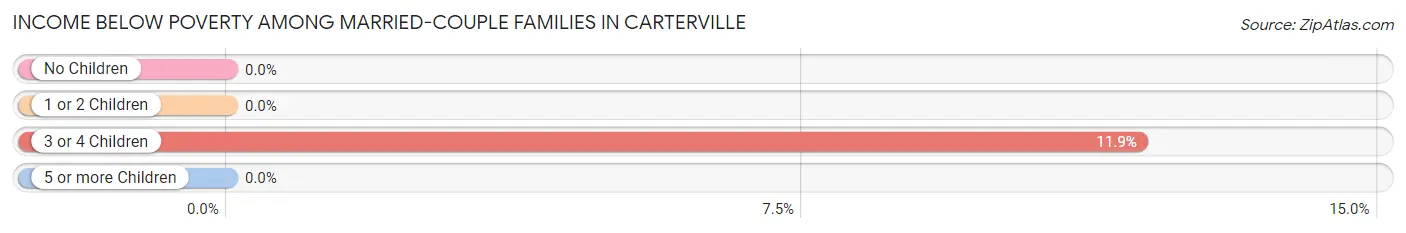
| Children | Above Poverty | Below Poverty |
| No Children | 822 (100.0%) | 0 (0.0%) |
| 1 or 2 Children | 271 (100.0%) | 0 (0.0%) |
| 3 or 4 Children | 126 (88.1%) | 17 (11.9%) |
| 5 or more Children | 0 (0.0%) | 0 (0.0%) |
| Total | 1,219 (98.6%) | 17 (1.4%) |
Income Below Poverty Among Single-Parent Households in Carterville
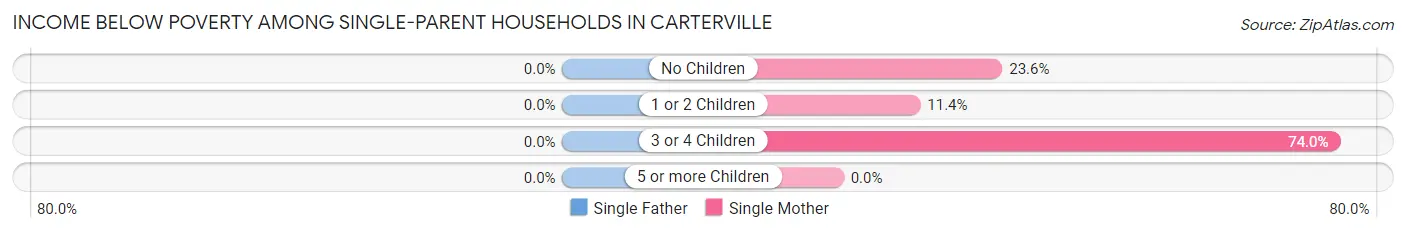
| Children | Single Father | Single Mother |
| No Children | 0 (0.0%) | 13 (23.6%) |
| 1 or 2 Children | 0 (0.0%) | 24 (11.4%) |
| 3 or 4 Children | 0 (0.0%) | 74 (74.0%) |
| 5 or more Children | 0 (0.0%) | 0 (0.0%) |
| Total | 0 (0.0%) | 111 (30.4%) |
Income Below Poverty Among Married-Couple vs Single-Parent Households in Carterville
The poverty data for Carterville shows that 17 of the married-couple family households (1.4%) and 111 of the single-parent households (29.8%) are living below the poverty level. Within the married-couple family households, those with 3 or 4 children have the highest poverty rate, with 17 households (11.9%) falling below the poverty line. Among the single-parent households, those with 3 or 4 children have the highest poverty rate, with 74 household (74.0%) living below poverty.
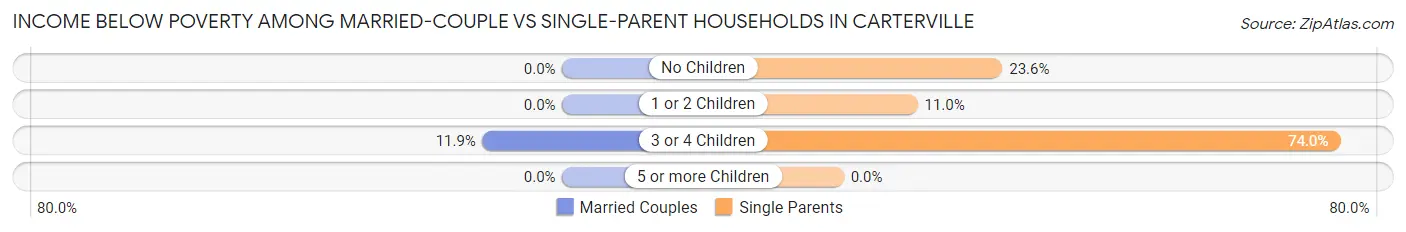
| Children | Married-Couple Families | Single-Parent Households |
| No Children | 0 (0.0%) | 13 (23.6%) |
| 1 or 2 Children | 0 (0.0%) | 24 (11.0%) |
| 3 or 4 Children | 17 (11.9%) | 74 (74.0%) |
| 5 or more Children | 0 (0.0%) | 0 (0.0%) |
| Total | 17 (1.4%) | 111 (29.8%) |
Race in Carterville
The most populous races in Carterville are White / Caucasian (5,333 | 91.4%), Two or more Races (230 | 3.9%), and Asian (212 | 3.6%).
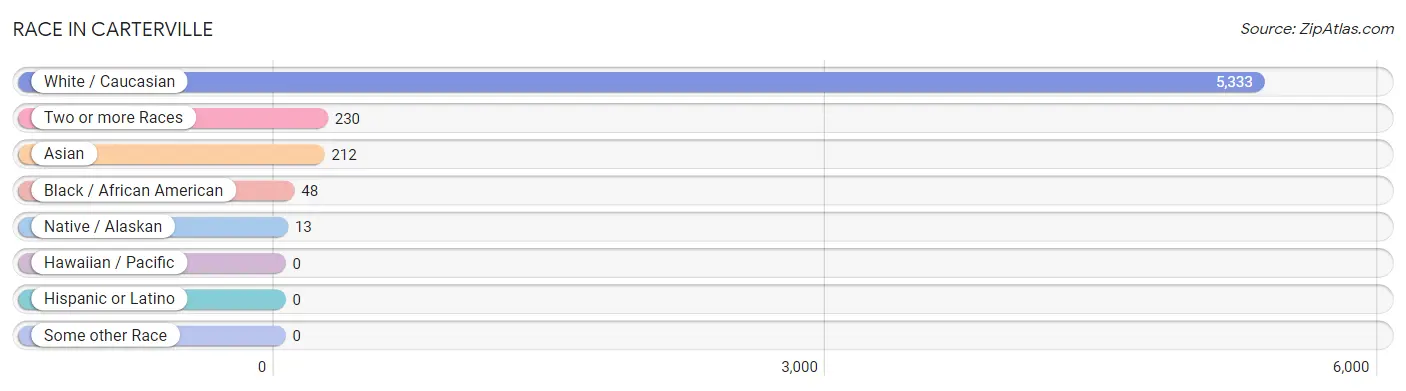
| Race | # Population | % Population |
| Asian | 212 | 3.6% |
| Black / African American | 48 | 0.8% |
| Hawaiian / Pacific | 0 | 0.0% |
| Hispanic or Latino | 0 | 0.0% |
| Native / Alaskan | 13 | 0.2% |
| White / Caucasian | 5,333 | 91.4% |
| Two or more Races | 230 | 3.9% |
| Some other Race | 0 | 0.0% |
| Total | 5,836 | 100.0% |
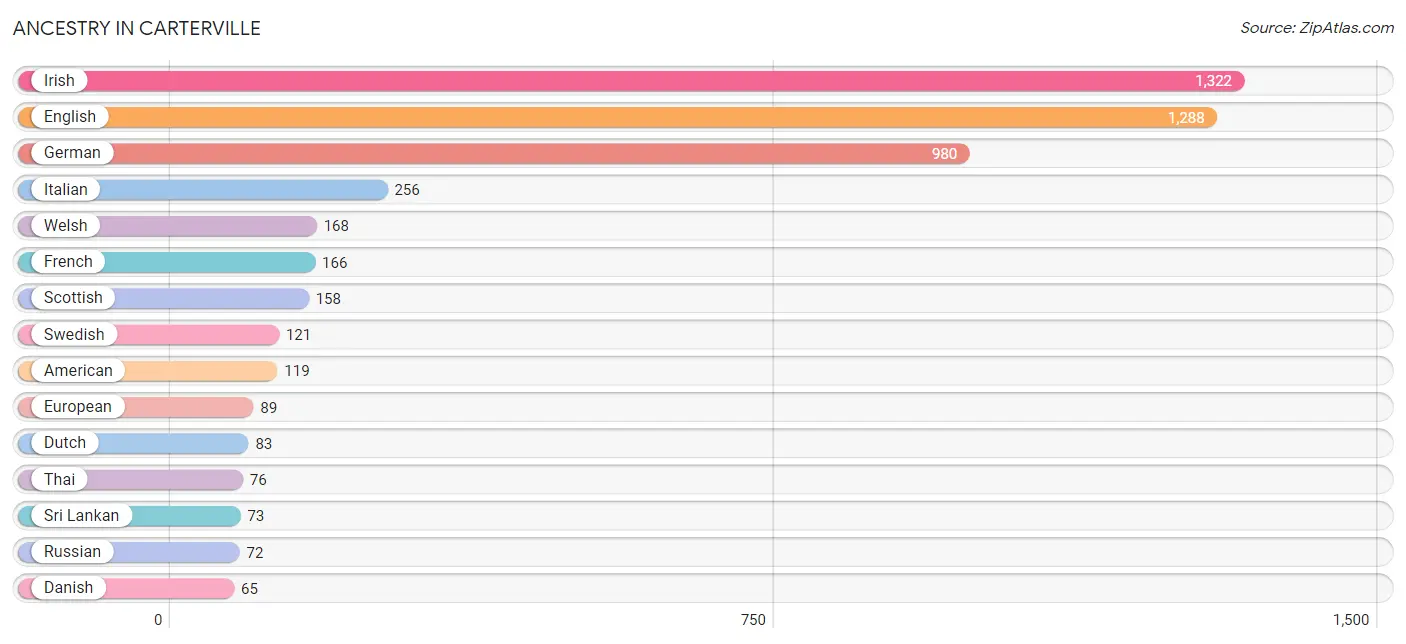
Ancestry in Carterville
The most populous ancestries reported in Carterville are Irish (1,322 | 22.7%), English (1,288 | 22.1%), German (980 | 16.8%), Italian (256 | 4.4%), and Welsh (168 | 2.9%), together accounting for 68.8% of all Carterville residents.
| Ancestry | # Population | % Population |
| American | 119 | 2.0% |
| Arab | 58 | 1.0% |
| Austrian | 18 | 0.3% |
| Canadian | 6 | 0.1% |
| Cherokee | 1 | 0.0% |
| Danish | 65 | 1.1% |
| Dutch | 83 | 1.4% |
| Eastern European | 34 | 0.6% |
| English | 1,288 | 22.1% |
| European | 89 | 1.5% |
| French | 166 | 2.8% |
| German | 980 | 16.8% |
| Greek | 15 | 0.3% |
| Hungarian | 17 | 0.3% |
| Inupiat | 13 | 0.2% |
| Irish | 1,322 | 22.7% |
| Italian | 256 | 4.4% |
| Korean | 20 | 0.3% |
| Lithuanian | 13 | 0.2% |
| Northern European | 49 | 0.8% |
| Norwegian | 25 | 0.4% |
| Polish | 7 | 0.1% |
| Russian | 72 | 1.2% |
| Scotch-Irish | 27 | 0.5% |
| Scottish | 158 | 2.7% |
| Sioux | 33 | 0.6% |
| Sri Lankan | 73 | 1.3% |
| Swedish | 121 | 2.1% |
| Swiss | 45 | 0.8% |
| Thai | 76 | 1.3% |
| Welsh | 168 | 2.9% | View All 31 Rows |
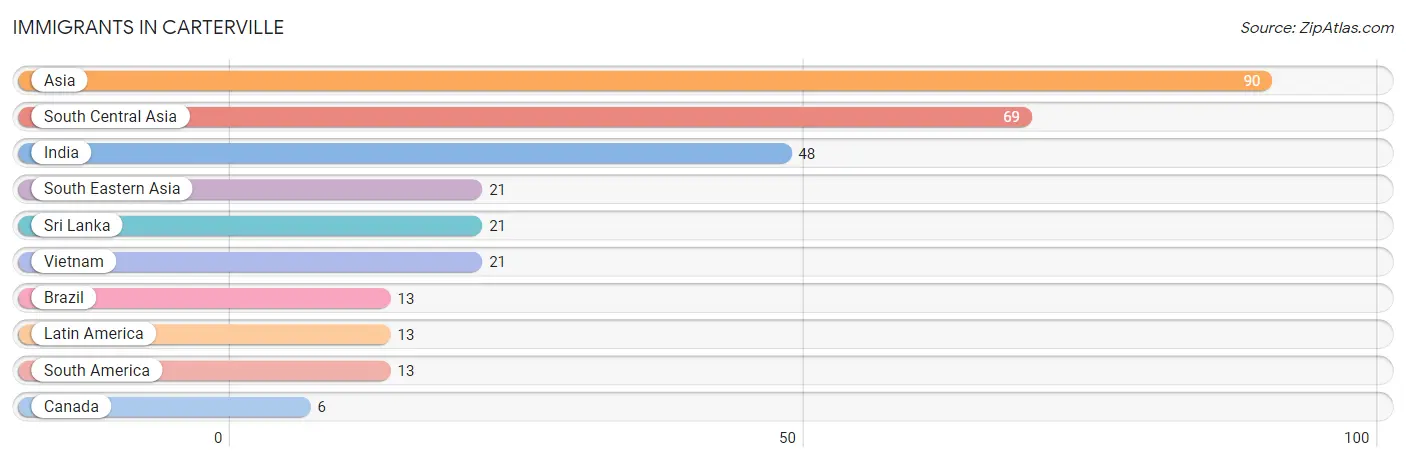
Immigrants in Carterville
The most numerous immigrant groups reported in Carterville came from Asia (90 | 1.5%), South Central Asia (69 | 1.2%), India (48 | 0.8%), South Eastern Asia (21 | 0.4%), and Sri Lanka (21 | 0.4%), together accounting for 4.3% of all Carterville residents.
| Immigration Origin | # Population | % Population |
| Asia | 90 | 1.5% |
| Brazil | 13 | 0.2% |
| Canada | 6 | 0.1% |
| India | 48 | 0.8% |
| Latin America | 13 | 0.2% |
| South America | 13 | 0.2% |
| South Central Asia | 69 | 1.2% |
| South Eastern Asia | 21 | 0.4% |
| Sri Lanka | 21 | 0.4% |
| Vietnam | 21 | 0.4% | View All 10 Rows |
Sex and Age in Carterville
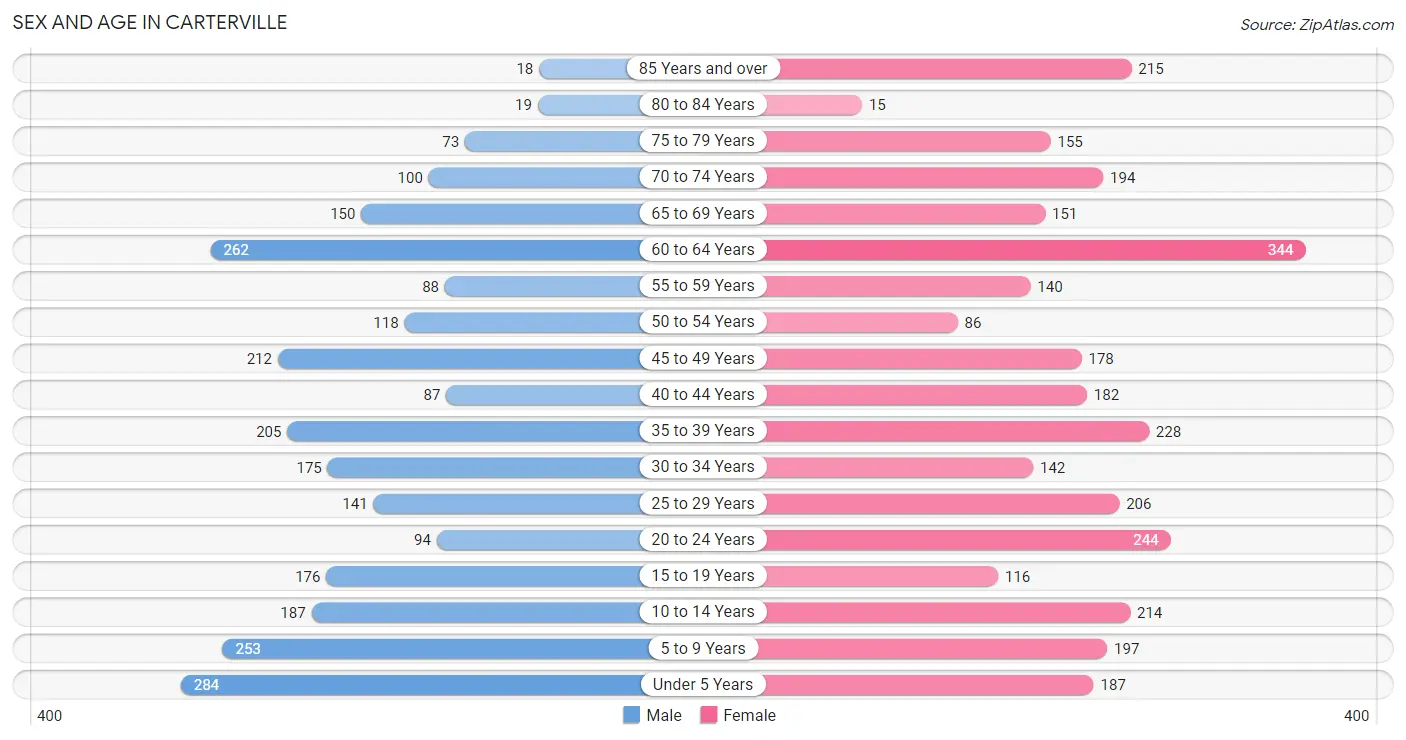
Sex and Age in Carterville
The most populous age groups in Carterville are Under 5 Years (284 | 10.7%) for men and 60 to 64 Years (344 | 10.8%) for women.
| Age Bracket | Male | Female |
| Under 5 Years | 284 (10.7%) | 187 (5.9%) |
| 5 to 9 Years | 253 (9.6%) | 197 (6.2%) |
| 10 to 14 Years | 187 (7.1%) | 214 (6.7%) |
| 15 to 19 Years | 176 (6.7%) | 116 (3.6%) |
| 20 to 24 Years | 94 (3.6%) | 244 (7.6%) |
| 25 to 29 Years | 141 (5.3%) | 206 (6.5%) |
| 30 to 34 Years | 175 (6.6%) | 142 (4.4%) |
| 35 to 39 Years | 205 (7.8%) | 228 (7.1%) |
| 40 to 44 Years | 87 (3.3%) | 182 (5.7%) |
| 45 to 49 Years | 212 (8.0%) | 178 (5.6%) |
| 50 to 54 Years | 118 (4.5%) | 86 (2.7%) |
| 55 to 59 Years | 88 (3.3%) | 140 (4.4%) |
| 60 to 64 Years | 262 (9.9%) | 344 (10.8%) |
| 65 to 69 Years | 150 (5.7%) | 151 (4.7%) |
| 70 to 74 Years | 100 (3.8%) | 194 (6.1%) |
| 75 to 79 Years | 73 (2.8%) | 155 (4.9%) |
| 80 to 84 Years | 19 (0.7%) | 15 (0.5%) |
| 85 Years and over | 18 (0.7%) | 215 (6.7%) |
| Total | 2,642 (100.0%) | 3,194 (100.0%) |
Families and Households in Carterville
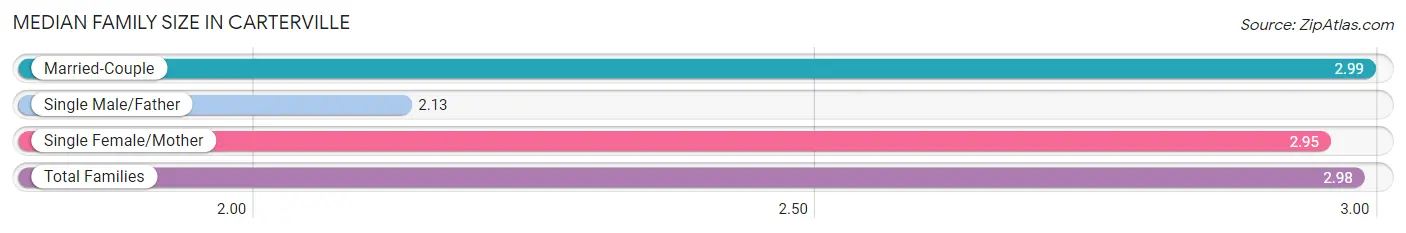
Median Family Size in Carterville
The median family size in Carterville is 2.98 persons per family, with married-couple families (1,236 | 76.8%) accounting for the largest median family size of 2.99 persons per family. On the other hand, single male/father families (8 | 0.5%) represent the smallest median family size with 2.13 persons per family.
| Family Type | # Families | Family Size |
| Married-Couple | 1,236 (76.8%) | 2.99 |
| Single Male/Father | 8 (0.5%) | 2.13 |
| Single Female/Mother | 365 (22.7%) | 2.95 |
| Total Families | 1,609 (100.0%) | 2.98 |
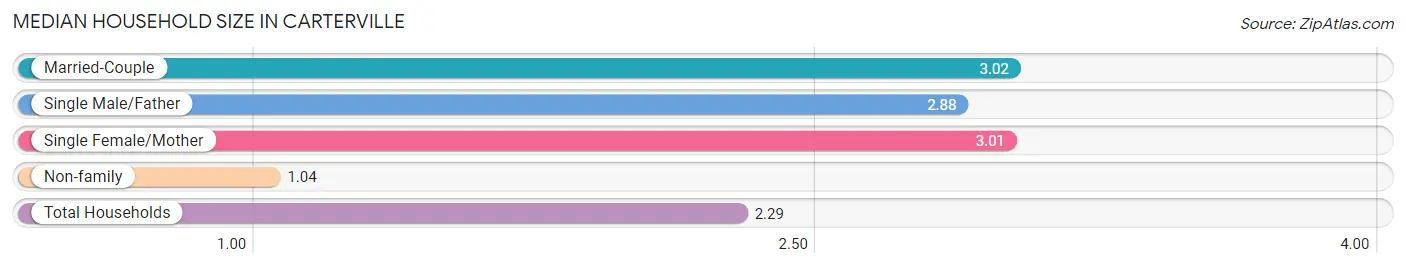
Median Household Size in Carterville
The median household size in Carterville is 2.29 persons per household, with married-couple households (1,236 | 48.6%) accounting for the largest median household size of 3.02 persons per household. non-family households (936 | 36.8%) represent the smallest median household size with 1.04 persons per household.
| Household Type | # Households | Household Size |
| Married-Couple | 1,236 (48.6%) | 3.02 |
| Single Male/Father | 8 (0.3%) | 2.88 |
| Single Female/Mother | 365 (14.3%) | 3.01 |
| Non-family | 936 (36.8%) | 1.04 |
| Total Households | 2,545 (100.0%) | 2.29 |
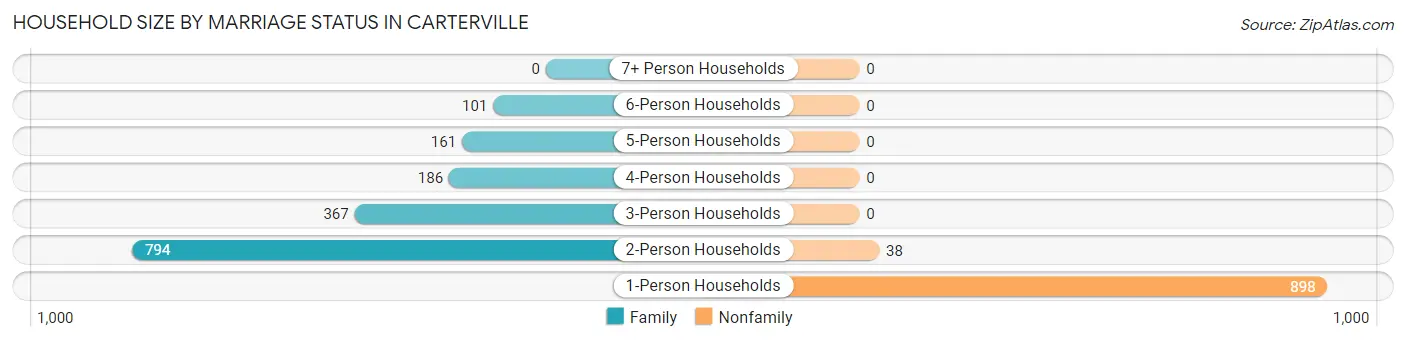
Household Size by Marriage Status in Carterville
Out of a total of 2,545 households in Carterville, 1,609 (63.2%) are family households, while 936 (36.8%) are nonfamily households. The most numerous type of family households are 2-person households, comprising 794, and the most common type of nonfamily households are 1-person households, comprising 898.
| Household Size | Family Households | Nonfamily Households |
| 1-Person Households | - | 898 (35.3%) |
| 2-Person Households | 794 (31.2%) | 38 (1.5%) |
| 3-Person Households | 367 (14.4%) | 0 (0.0%) |
| 4-Person Households | 186 (7.3%) | 0 (0.0%) |
| 5-Person Households | 161 (6.3%) | 0 (0.0%) |
| 6-Person Households | 101 (4.0%) | 0 (0.0%) |
| 7+ Person Households | 0 (0.0%) | 0 (0.0%) |
| Total | 1,609 (63.2%) | 936 (36.8%) |
Female Fertility in Carterville
Fertility by Age in Carterville
Average fertility rate in Carterville is 70.0 births per 1,000 women. Women in the age bracket of 20 to 34 years have the highest fertility rate with 139.0 births per 1,000 women. Women in the age bracket of 20 to 34 years acount for 90.1% of all women with births.
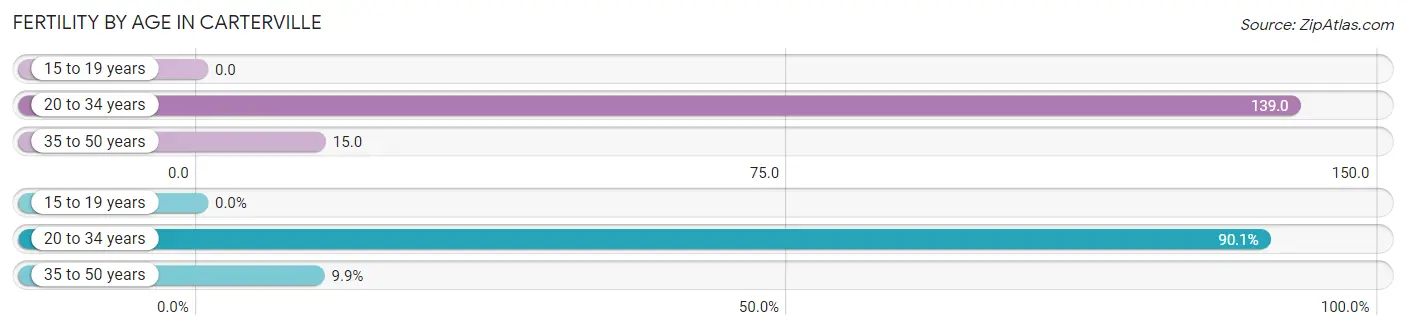
| Age Bracket | Women with Births | Births / 1,000 Women |
| 15 to 19 years | 0 (0.0%) | 0.0 |
| 20 to 34 years | 82 (90.1%) | 139.0 |
| 35 to 50 years | 9 (9.9%) | 15.0 |
| Total | 91 (100.0%) | 70.0 |
Fertility by Age by Marriage Status in Carterville
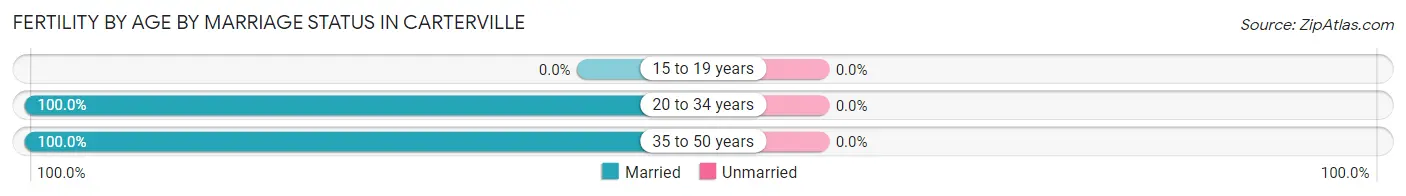
| Age Bracket | Married | Unmarried |
| 15 to 19 years | 0 (0.0%) | 0 (0.0%) |
| 20 to 34 years | 82 (100.0%) | 0 (0.0%) |
| 35 to 50 years | 9 (100.0%) | 0 (0.0%) |
| Total | 91 (100.0%) | 0 (0.0%) |
Fertility by Education in Carterville
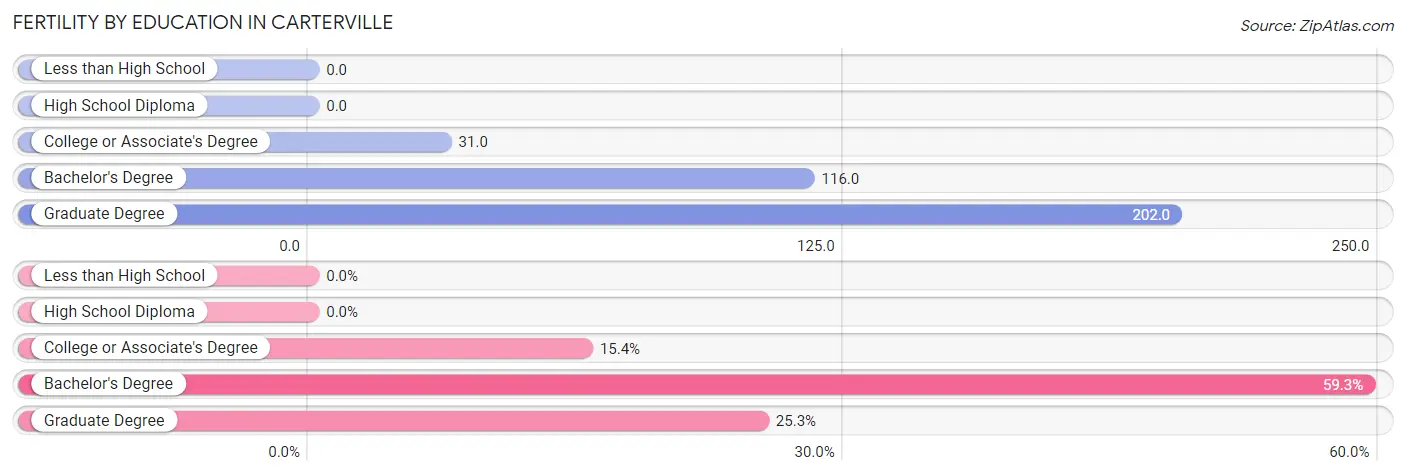
| Educational Attainment | Women with Births | Births / 1,000 Women |
| Less than High School | 0 (0.0%) | 0.0 |
| High School Diploma | 0 (0.0%) | 0.0 |
| College or Associate's Degree | 14 (15.4%) | 31.0 |
| Bachelor's Degree | 54 (59.3%) | 116.0 |
| Graduate Degree | 23 (25.3%) | 202.0 |
| Total | 91 (100.0%) | 70.0 |
Fertility by Education by Marriage Status in Carterville
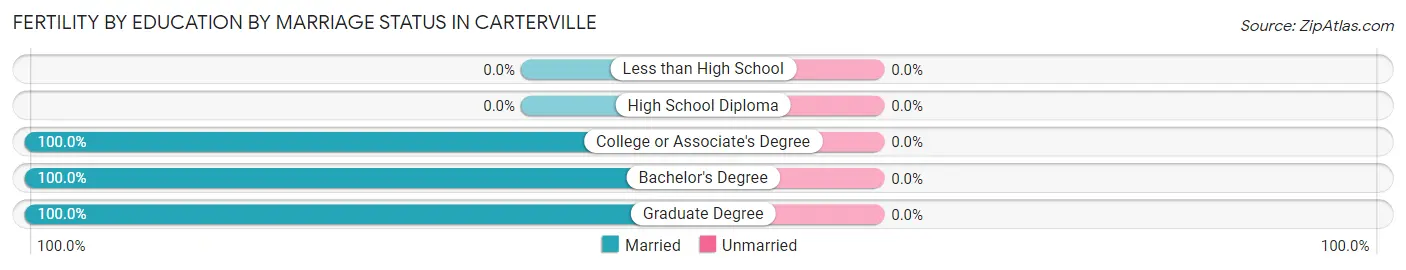
| Educational Attainment | Married | Unmarried |
| Less than High School | 0 (0.0%) | 0 (0.0%) |
| High School Diploma | 0 (0.0%) | 0 (0.0%) |
| College or Associate's Degree | 14 (100.0%) | 0 (0.0%) |
| Bachelor's Degree | 54 (100.0%) | 0 (0.0%) |
| Graduate Degree | 23 (100.0%) | 0 (0.0%) |
| Total | 91 (100.0%) | 0 (0.0%) |
Employment Characteristics in Carterville
Employment by Class of Employer in Carterville
Among the 2,504 employed individuals in Carterville, private company employees (1,164 | 46.5%), state government employees (388 | 15.5%), and not-for-profit organizations (381 | 15.2%) make up the most common classes of employment.
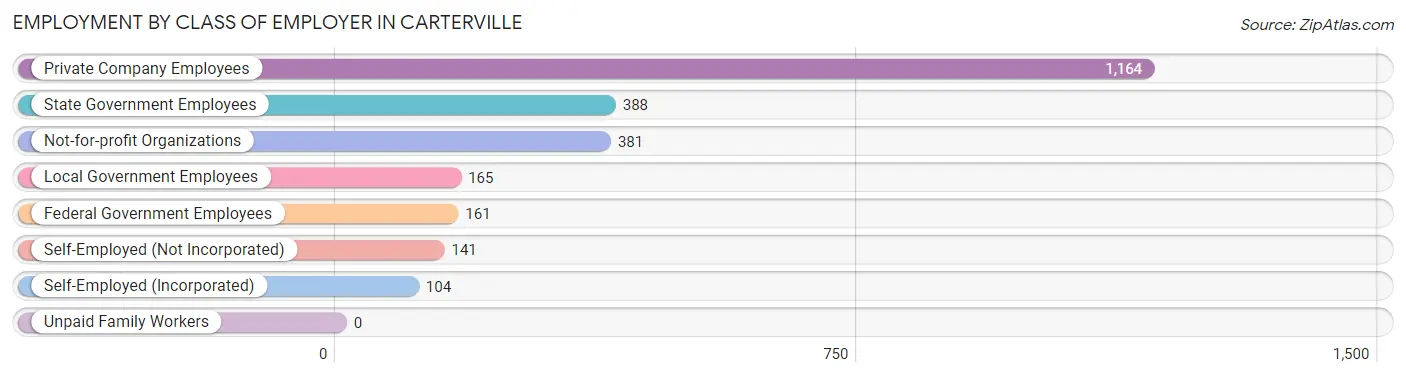
| Employer Class | # Employees | % Employees |
| Private Company Employees | 1,164 | 46.5% |
| Self-Employed (Incorporated) | 104 | 4.2% |
| Self-Employed (Not Incorporated) | 141 | 5.6% |
| Not-for-profit Organizations | 381 | 15.2% |
| Local Government Employees | 165 | 6.6% |
| State Government Employees | 388 | 15.5% |
| Federal Government Employees | 161 | 6.4% |
| Unpaid Family Workers | 0 | 0.0% |
| Total | 2,504 | 100.0% |
Employment Status by Age in Carterville
According to the labor force statistics for Carterville, out of the total population over 16 years of age (4,438), 58.8% or 2,610 individuals are in the labor force, with 2.7% or 70 of them unemployed. The age group with the highest labor force participation rate is 35 to 44 years, with 92.7% or 651 individuals in the labor force. Within the labor force, the 55 to 59 years age range has the highest percentage of unemployed individuals, with 12.7% or 20 of them being unemployed.
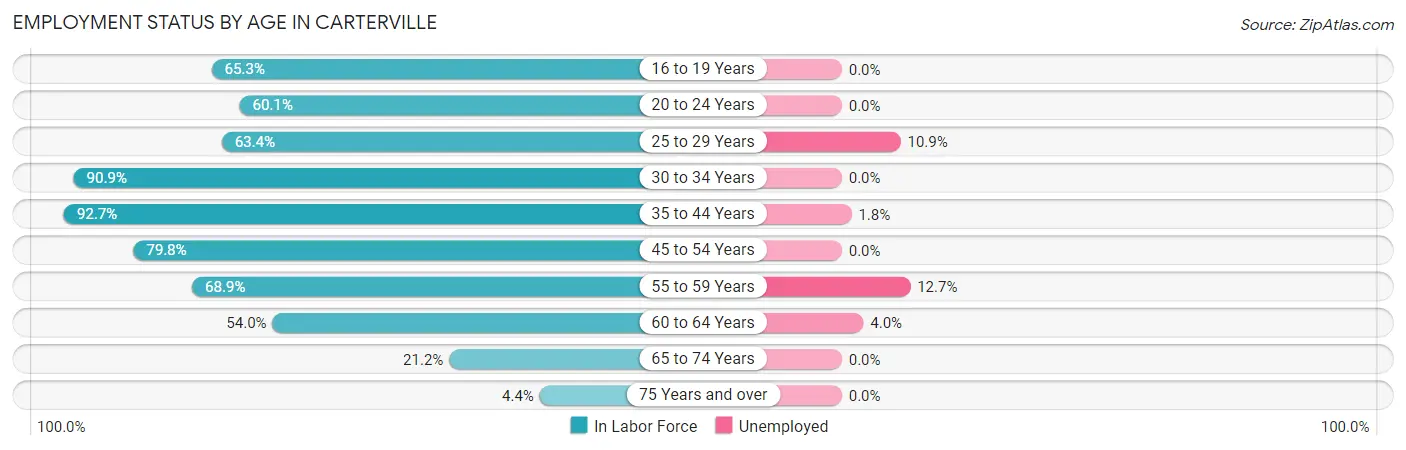
| Age Bracket | In Labor Force | Unemployed |
| 16 to 19 Years | 141 (65.3%) | 0 (0.0%) |
| 20 to 24 Years | 203 (60.1%) | 0 (0.0%) |
| 25 to 29 Years | 220 (63.4%) | 24 (10.9%) |
| 30 to 34 Years | 288 (90.9%) | 0 (0.0%) |
| 35 to 44 Years | 651 (92.7%) | 12 (1.8%) |
| 45 to 54 Years | 474 (79.8%) | 0 (0.0%) |
| 55 to 59 Years | 157 (68.9%) | 20 (12.7%) |
| 60 to 64 Years | 327 (54.0%) | 13 (4.0%) |
| 65 to 74 Years | 126 (21.2%) | 0 (0.0%) |
| 75 Years and over | 22 (4.4%) | 0 (0.0%) |
| Total | 2,610 (58.8%) | 70 (2.7%) |
Employment Status by Educational Attainment in Carterville
According to labor force statistics for Carterville, 75.8% of individuals (2,118) out of the total population between 25 and 64 years of age (2,794) are in the labor force, with 3.3% or 70 of them being unemployed. The group with the highest labor force participation rate are those with the educational attainment of bachelor's degree or higher, with 84.6% or 1,261 individuals in the labor force. Within the labor force, individuals with college / associate degree education have the highest percentage of unemployment, with 9.7% or 48 of them being unemployed.
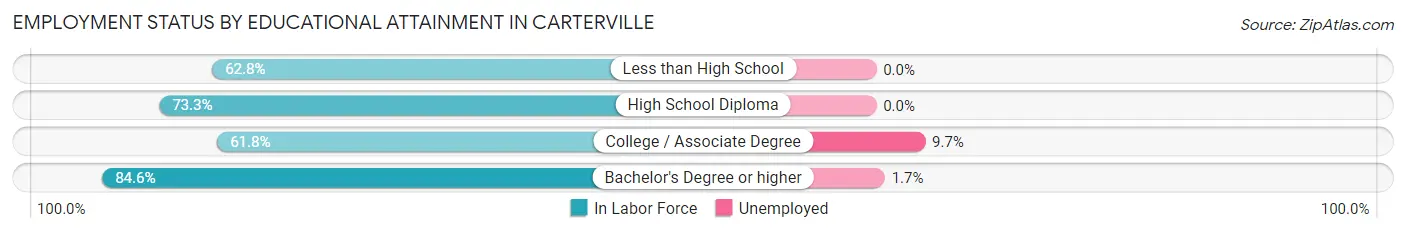
| Educational Attainment | In Labor Force | Unemployed |
| Less than High School | 49 (62.8%) | 0 (0.0%) |
| High School Diploma | 311 (73.3%) | 0 (0.0%) |
| College / Associate Degree | 496 (61.8%) | 78 (9.7%) |
| Bachelor's Degree or higher | 1,261 (84.6%) | 25 (1.7%) |
| Total | 2,118 (75.8%) | 92 (3.3%) |
Employment Occupations by Sex in Carterville
Management, Business, Science and Arts Occupations
The most common Management, Business, Science and Arts occupations in Carterville are Community & Social Service (332 | 13.3%), Management (299 | 12.0%), Education Instruction & Library (230 | 9.2%), Health Diagnosing & Treating (230 | 9.2%), and Business & Financial (198 | 8.0%).
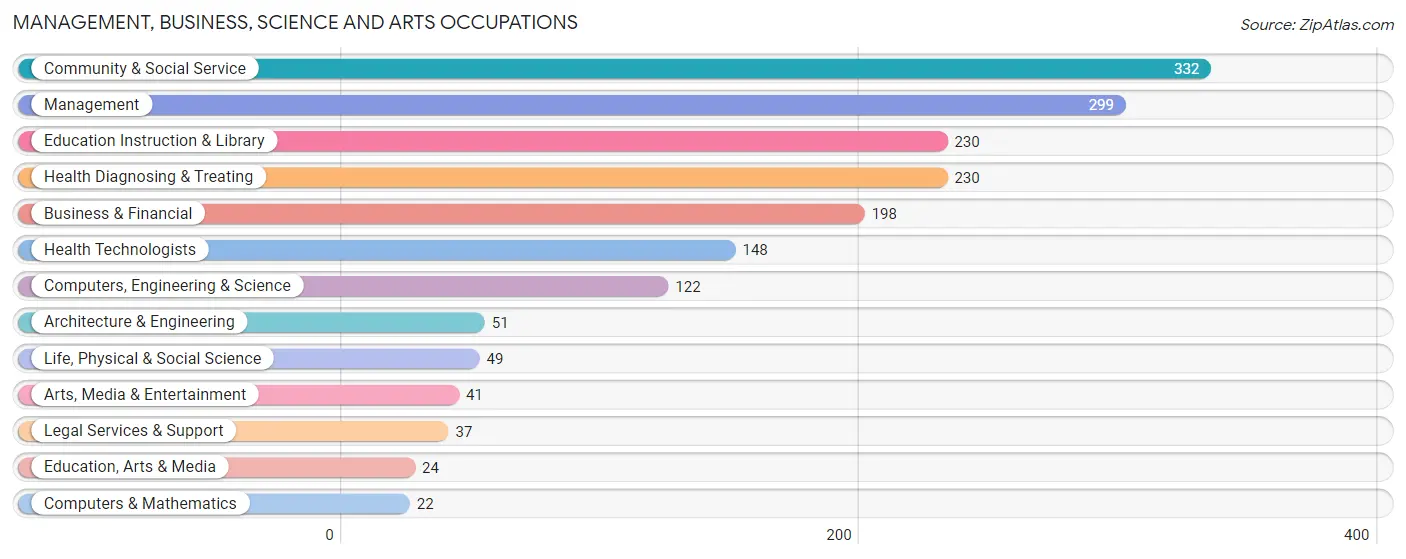
Management, Business, Science and Arts Occupations by Sex
Within the Management, Business, Science and Arts occupations in Carterville, the most male-oriented occupations are Computers, Engineering & Science (100.0%), Computers & Mathematics (100.0%), and Architecture & Engineering (100.0%), while the most female-oriented occupations are Education Instruction & Library (90.9%), Legal Services & Support (86.5%), and Community & Social Service (86.1%).
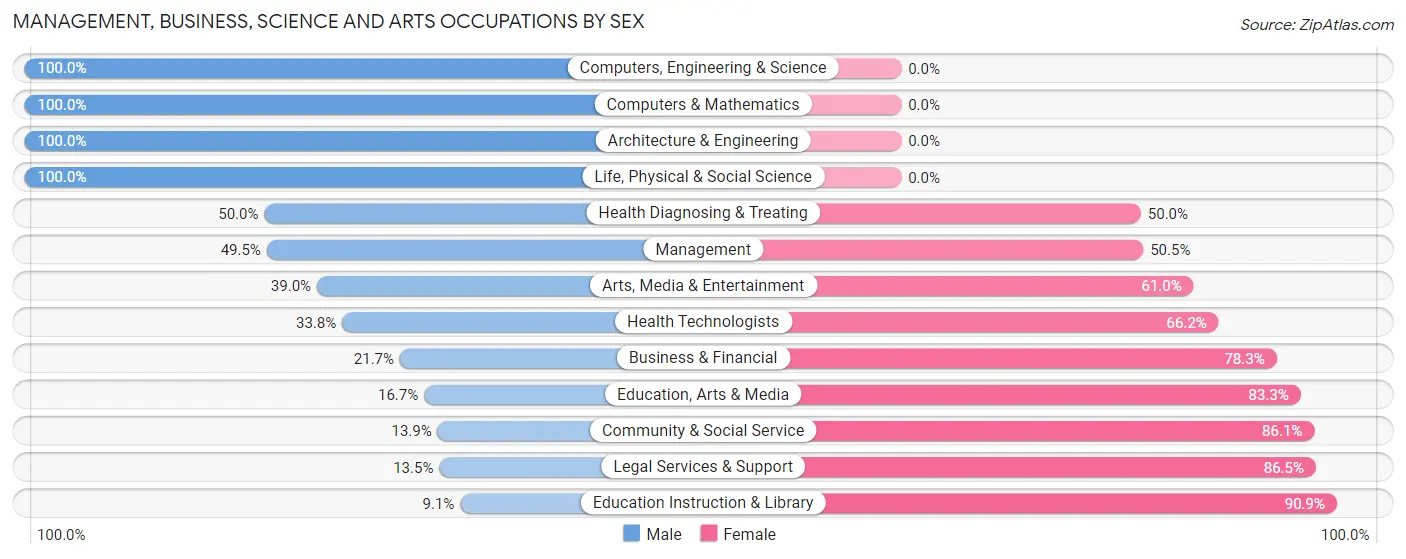
| Occupation | Male | Female |
| Management | 148 (49.5%) | 151 (50.5%) |
| Business & Financial | 43 (21.7%) | 155 (78.3%) |
| Computers, Engineering & Science | 122 (100.0%) | 0 (0.0%) |
| Computers & Mathematics | 22 (100.0%) | 0 (0.0%) |
| Architecture & Engineering | 51 (100.0%) | 0 (0.0%) |
| Life, Physical & Social Science | 49 (100.0%) | 0 (0.0%) |
| Community & Social Service | 46 (13.9%) | 286 (86.1%) |
| Education, Arts & Media | 4 (16.7%) | 20 (83.3%) |
| Legal Services & Support | 5 (13.5%) | 32 (86.5%) |
| Education Instruction & Library | 21 (9.1%) | 209 (90.9%) |
| Arts, Media & Entertainment | 16 (39.0%) | 25 (61.0%) |
| Health Diagnosing & Treating | 115 (50.0%) | 115 (50.0%) |
| Health Technologists | 50 (33.8%) | 98 (66.2%) |
| Total (Category) | 474 (40.1%) | 707 (59.9%) |
| Total (Overall) | 1,252 (50.3%) | 1,239 (49.7%) |
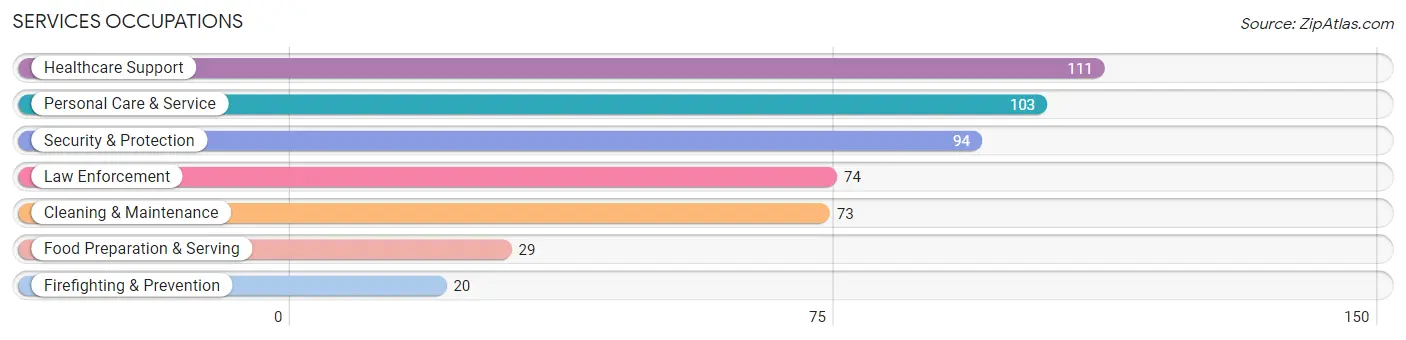
Services Occupations
The most common Services occupations in Carterville are Healthcare Support (111 | 4.5%), Personal Care & Service (103 | 4.1%), Security & Protection (94 | 3.8%), Law Enforcement (74 | 3.0%), and Cleaning & Maintenance (73 | 2.9%).
Services Occupations by Sex
Within the Services occupations in Carterville, the most male-oriented occupations are Law Enforcement (100.0%), Cleaning & Maintenance (100.0%), and Security & Protection (84.0%), while the most female-oriented occupations are Personal Care & Service (91.3%), Firefighting & Prevention (75.0%), and Healthcare Support (67.6%).
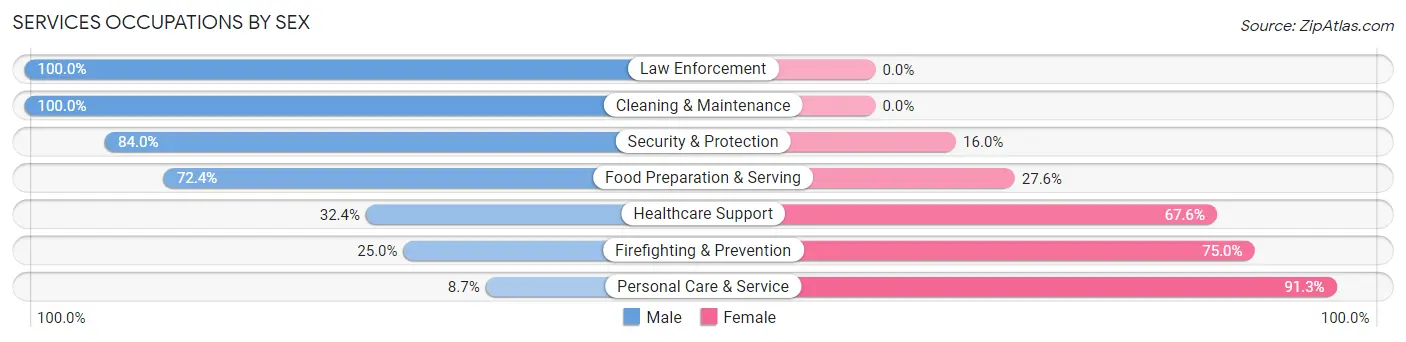
| Occupation | Male | Female |
| Healthcare Support | 36 (32.4%) | 75 (67.6%) |
| Security & Protection | 79 (84.0%) | 15 (16.0%) |
| Firefighting & Prevention | 5 (25.0%) | 15 (75.0%) |
| Law Enforcement | 74 (100.0%) | 0 (0.0%) |
| Food Preparation & Serving | 21 (72.4%) | 8 (27.6%) |
| Cleaning & Maintenance | 73 (100.0%) | 0 (0.0%) |
| Personal Care & Service | 9 (8.7%) | 94 (91.3%) |
| Total (Category) | 218 (53.2%) | 192 (46.8%) |
| Total (Overall) | 1,252 (50.3%) | 1,239 (49.7%) |
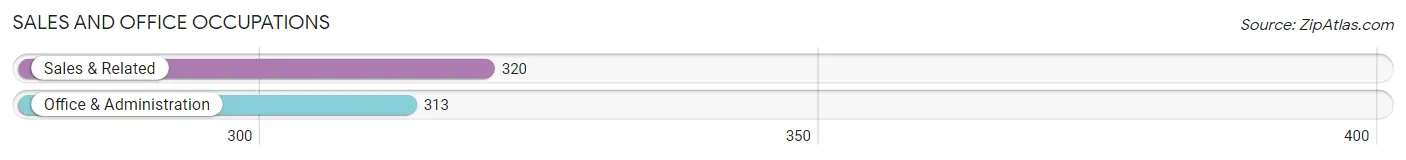
Sales and Office Occupations
The most common Sales and Office occupations in Carterville are Sales & Related (320 | 12.9%), and Office & Administration (313 | 12.6%).
Sales and Office Occupations by Sex
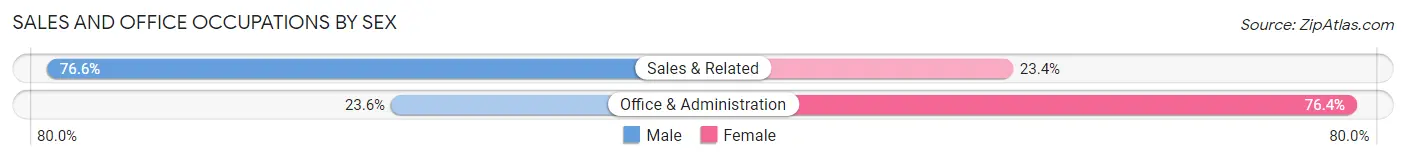
| Occupation | Male | Female |
| Sales & Related | 245 (76.6%) | 75 (23.4%) |
| Office & Administration | 74 (23.6%) | 239 (76.4%) |
| Total (Category) | 319 (50.4%) | 314 (49.6%) |
| Total (Overall) | 1,252 (50.3%) | 1,239 (49.7%) |
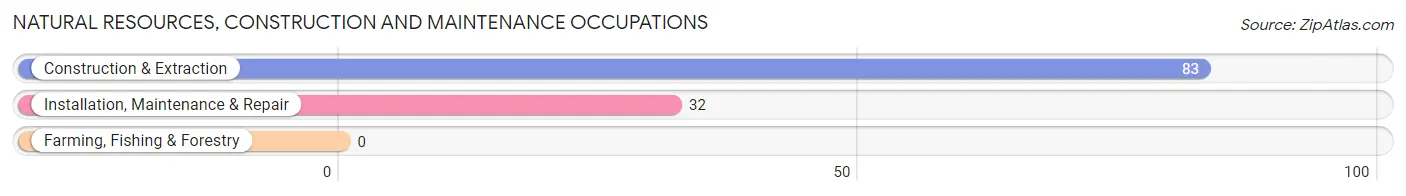
Natural Resources, Construction and Maintenance Occupations
The most common Natural Resources, Construction and Maintenance occupations in Carterville are Construction & Extraction (83 | 3.3%), and Installation, Maintenance & Repair (32 | 1.3%).
Natural Resources, Construction and Maintenance Occupations by Sex
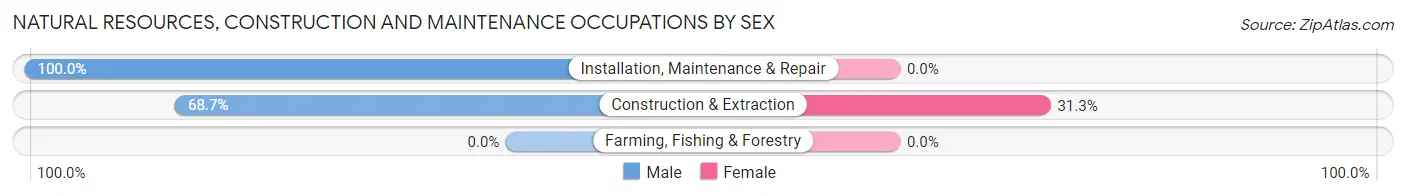
| Occupation | Male | Female |
| Farming, Fishing & Forestry | 0 (0.0%) | 0 (0.0%) |
| Construction & Extraction | 57 (68.7%) | 26 (31.3%) |
| Installation, Maintenance & Repair | 32 (100.0%) | 0 (0.0%) |
| Total (Category) | 89 (77.4%) | 26 (22.6%) |
| Total (Overall) | 1,252 (50.3%) | 1,239 (49.7%) |
Production, Transportation and Moving Occupations
The most common Production, Transportation and Moving occupations in Carterville are Production (75 | 3.0%), Transportation (56 | 2.2%), and Material Moving (21 | 0.8%).
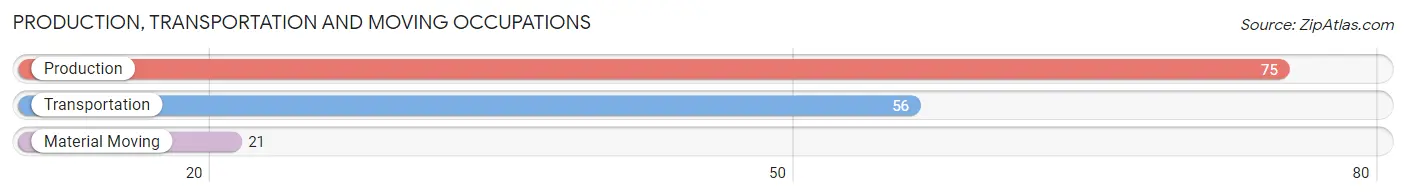
Production, Transportation and Moving Occupations by Sex
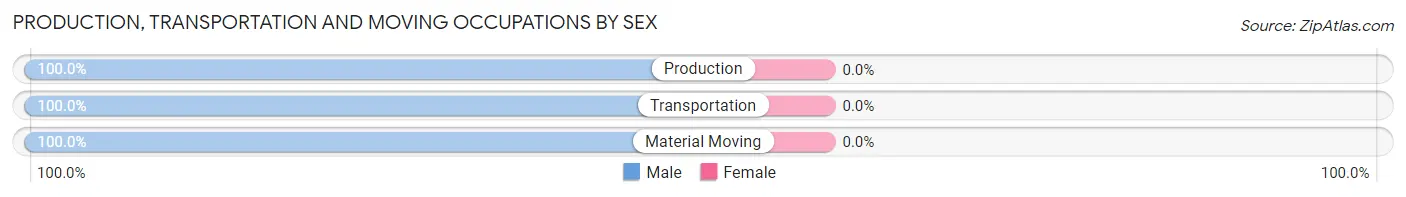
| Occupation | Male | Female |
| Production | 75 (100.0%) | 0 (0.0%) |
| Transportation | 56 (100.0%) | 0 (0.0%) |
| Material Moving | 21 (100.0%) | 0 (0.0%) |
| Total (Category) | 152 (100.0%) | 0 (0.0%) |
| Total (Overall) | 1,252 (50.3%) | 1,239 (49.7%) |
Employment Industries by Sex in Carterville
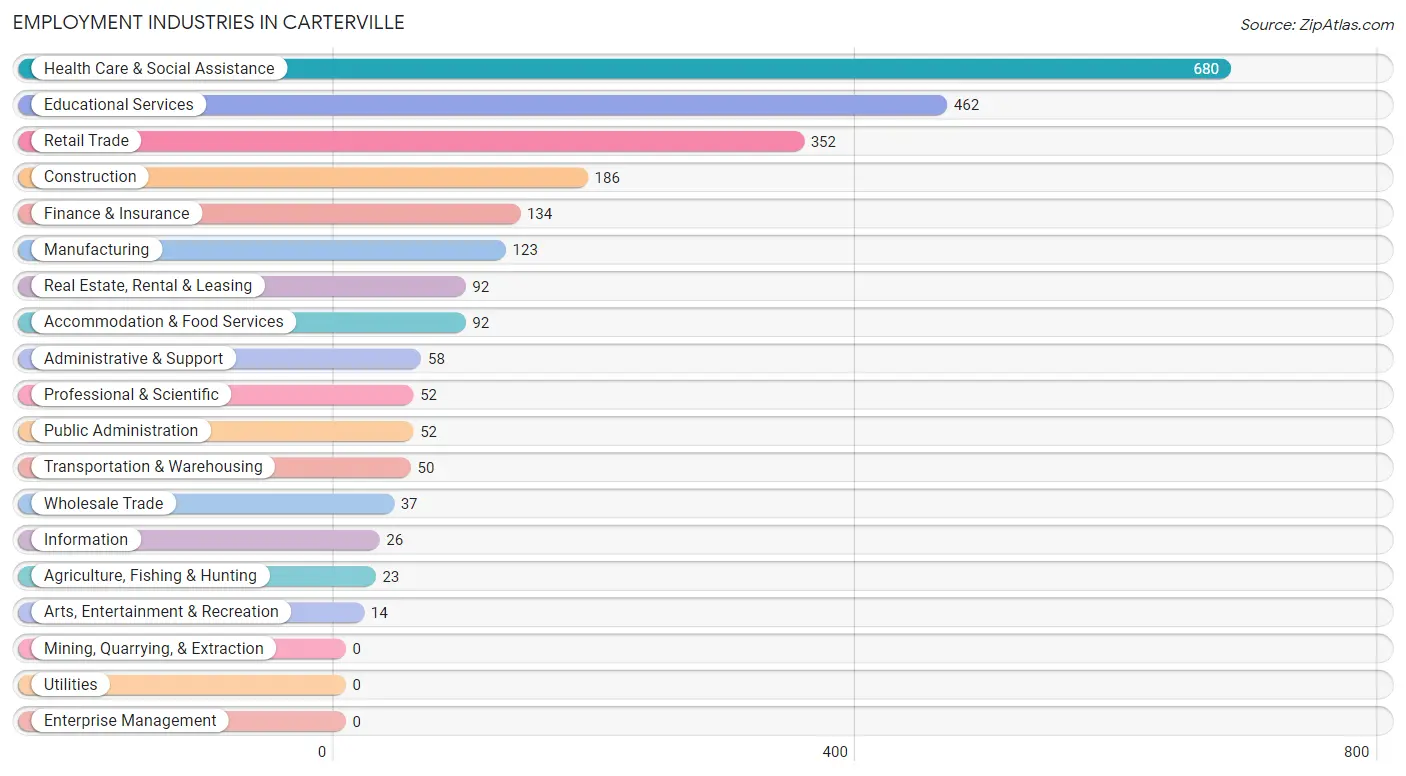
Employment Industries in Carterville
The major employment industries in Carterville include Health Care & Social Assistance (680 | 27.3%), Educational Services (462 | 18.5%), Retail Trade (352 | 14.1%), Construction (186 | 7.5%), and Finance & Insurance (134 | 5.4%).
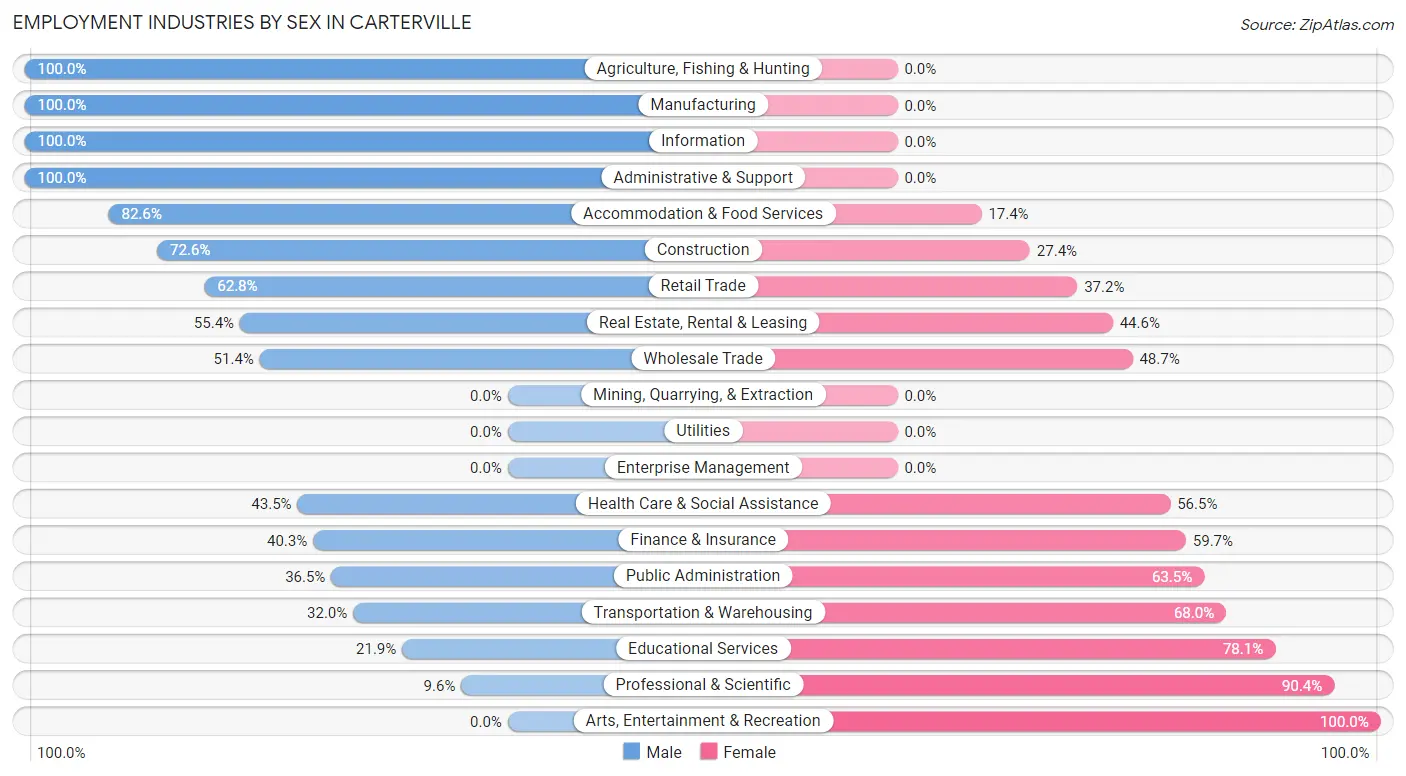
Employment Industries by Sex in Carterville
The Carterville industries that see more men than women are Agriculture, Fishing & Hunting (100.0%), Manufacturing (100.0%), and Information (100.0%), whereas the industries that tend to have a higher number of women are Arts, Entertainment & Recreation (100.0%), Professional & Scientific (90.4%), and Educational Services (78.1%).
| Industry | Male | Female |
| Agriculture, Fishing & Hunting | 23 (100.0%) | 0 (0.0%) |
| Mining, Quarrying, & Extraction | 0 (0.0%) | 0 (0.0%) |
| Construction | 135 (72.6%) | 51 (27.4%) |
| Manufacturing | 123 (100.0%) | 0 (0.0%) |
| Wholesale Trade | 19 (51.3%) | 18 (48.6%) |
| Retail Trade | 221 (62.8%) | 131 (37.2%) |
| Transportation & Warehousing | 16 (32.0%) | 34 (68.0%) |
| Utilities | 0 (0.0%) | 0 (0.0%) |
| Information | 26 (100.0%) | 0 (0.0%) |
| Finance & Insurance | 54 (40.3%) | 80 (59.7%) |
| Real Estate, Rental & Leasing | 51 (55.4%) | 41 (44.6%) |
| Professional & Scientific | 5 (9.6%) | 47 (90.4%) |
| Enterprise Management | 0 (0.0%) | 0 (0.0%) |
| Administrative & Support | 58 (100.0%) | 0 (0.0%) |
| Educational Services | 101 (21.9%) | 361 (78.1%) |
| Health Care & Social Assistance | 296 (43.5%) | 384 (56.5%) |
| Arts, Entertainment & Recreation | 0 (0.0%) | 14 (100.0%) |
| Accommodation & Food Services | 76 (82.6%) | 16 (17.4%) |
| Public Administration | 19 (36.5%) | 33 (63.5%) |
| Total | 1,252 (50.3%) | 1,239 (49.7%) |
Education in Carterville
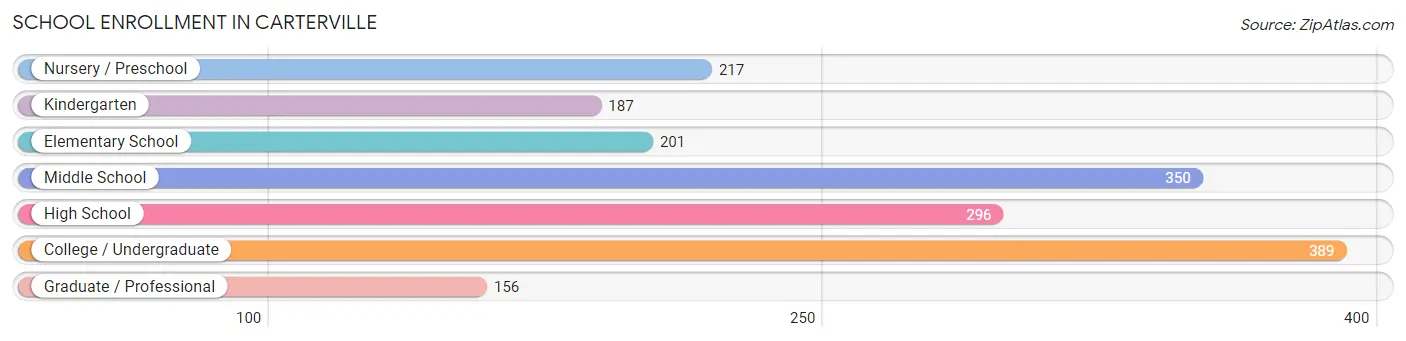
School Enrollment in Carterville
The most common levels of schooling among the 1,796 students in Carterville are college / undergraduate (389 | 21.7%), middle school (350 | 19.5%), and high school (296 | 16.5%).
| School Level | # Students | % Students |
| Nursery / Preschool | 217 | 12.1% |
| Kindergarten | 187 | 10.4% |
| Elementary School | 201 | 11.2% |
| Middle School | 350 | 19.5% |
| High School | 296 | 16.5% |
| College / Undergraduate | 389 | 21.7% |
| Graduate / Professional | 156 | 8.7% |
| Total | 1,796 | 100.0% |
School Enrollment by Age by Funding Source in Carterville
Out of a total of 1,796 students who are enrolled in schools in Carterville, 40 (2.2%) attend a private institution, while the remaining 1,756 (97.8%) are enrolled in public schools. The age group of 5 to 9 year old has the highest likelihood of being enrolled in private schools, with 23 (5.1% in the age bracket) enrolled. Conversely, the age group of 15 to 17 year olds has the lowest likelihood of being enrolled in a private school, with 174 (100.0% in the age bracket) attending a public institution.
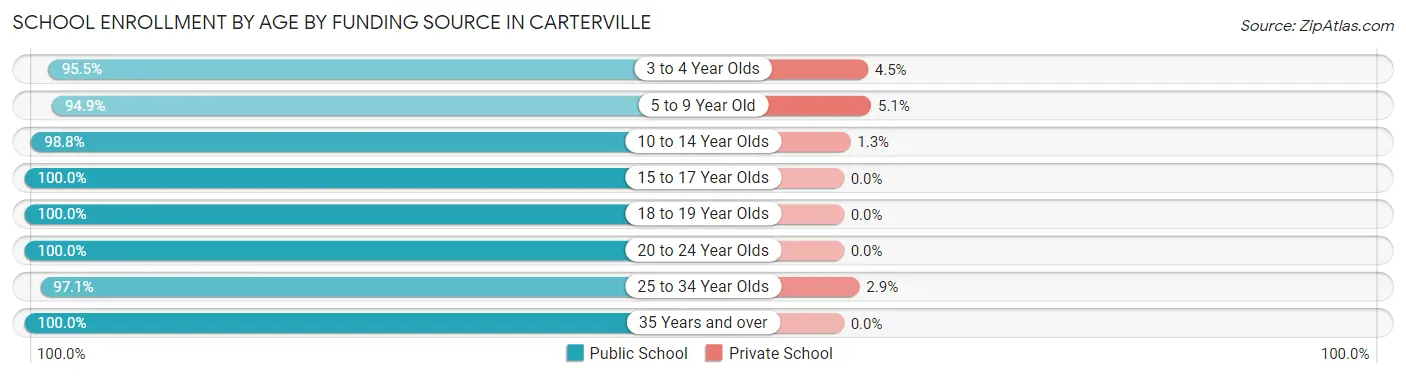
| Age Bracket | Public School | Private School |
| 3 to 4 Year Olds | 106 (95.5%) | 5 (4.5%) |
| 5 to 9 Year Old | 427 (94.9%) | 23 (5.1%) |
| 10 to 14 Year Olds | 396 (98.8%) | 5 (1.3%) |
| 15 to 17 Year Olds | 174 (100.0%) | 0 (0.0%) |
| 18 to 19 Year Olds | 118 (100.0%) | 0 (0.0%) |
| 20 to 24 Year Olds | 249 (100.0%) | 0 (0.0%) |
| 25 to 34 Year Olds | 232 (97.1%) | 7 (2.9%) |
| 35 Years and over | 54 (100.0%) | 0 (0.0%) |
| Total | 1,756 (97.8%) | 40 (2.2%) |
Educational Attainment by Field of Study in Carterville
Education (404 | 19.4%), business (382 | 18.4%), arts & humanities (299 | 14.4%), bio, nature & agricultural (182 | 8.7%), and science & technology (167 | 8.0%) are the most common fields of study among 2,079 individuals in Carterville who have obtained a bachelor's degree or higher.
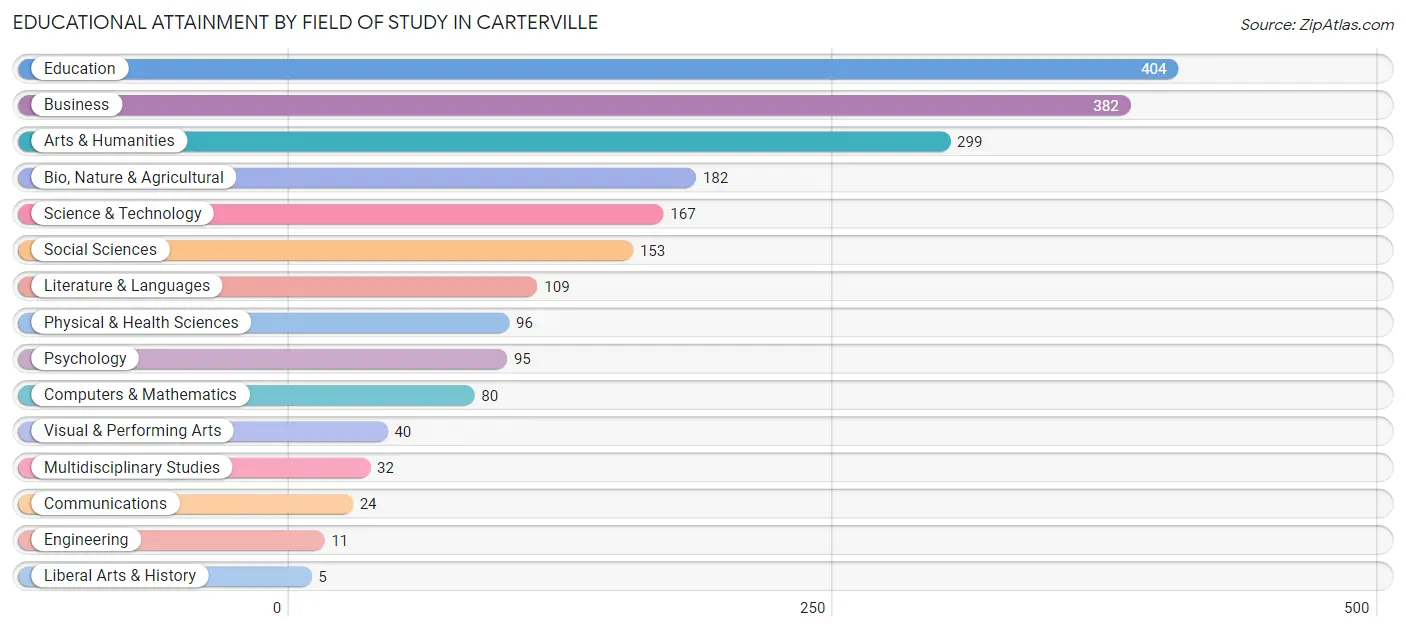
| Field of Study | # Graduates | % Graduates |
| Computers & Mathematics | 80 | 3.8% |
| Bio, Nature & Agricultural | 182 | 8.7% |
| Physical & Health Sciences | 96 | 4.6% |
| Psychology | 95 | 4.6% |
| Social Sciences | 153 | 7.4% |
| Engineering | 11 | 0.5% |
| Multidisciplinary Studies | 32 | 1.5% |
| Science & Technology | 167 | 8.0% |
| Business | 382 | 18.4% |
| Education | 404 | 19.4% |
| Literature & Languages | 109 | 5.2% |
| Liberal Arts & History | 5 | 0.2% |
| Visual & Performing Arts | 40 | 1.9% |
| Communications | 24 | 1.1% |
| Arts & Humanities | 299 | 14.4% |
| Total | 2,079 | 100.0% |
Transportation & Commute in Carterville
Vehicle Availability by Sex in Carterville
The most prevalent vehicle ownership categories in Carterville are males with 2 vehicles (573, accounting for 44.7%) and females with 2 vehicles (573, making up 46.9%).
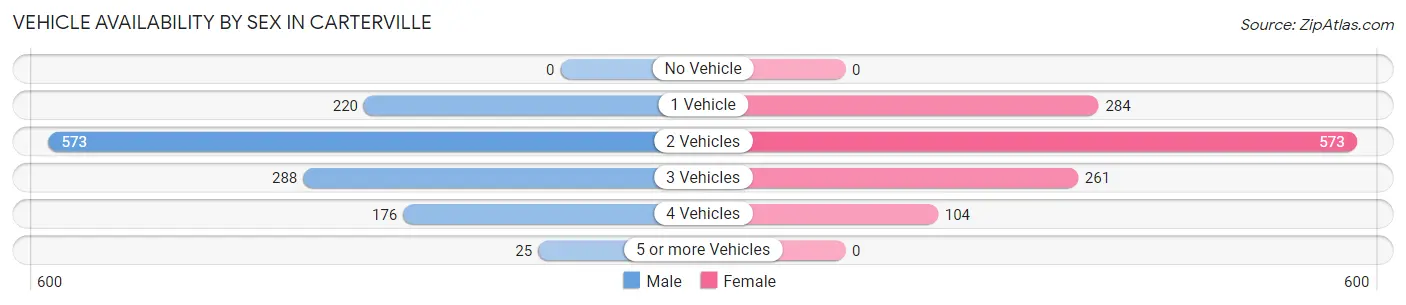
| Vehicles Available | Male | Female |
| No Vehicle | 0 (0.0%) | 0 (0.0%) |
| 1 Vehicle | 220 (17.2%) | 284 (23.2%) |
| 2 Vehicles | 573 (44.7%) | 573 (46.9%) |
| 3 Vehicles | 288 (22.5%) | 261 (21.4%) |
| 4 Vehicles | 176 (13.7%) | 104 (8.5%) |
| 5 or more Vehicles | 25 (1.9%) | 0 (0.0%) |
| Total | 1,282 (100.0%) | 1,222 (100.0%) |
Commute Time in Carterville
The most frequently occuring commute durations in Carterville are 15 to 19 minutes (793 commuters, 33.8%), 20 to 24 minutes (322 commuters, 13.7%), and 10 to 14 minutes (273 commuters, 11.6%).
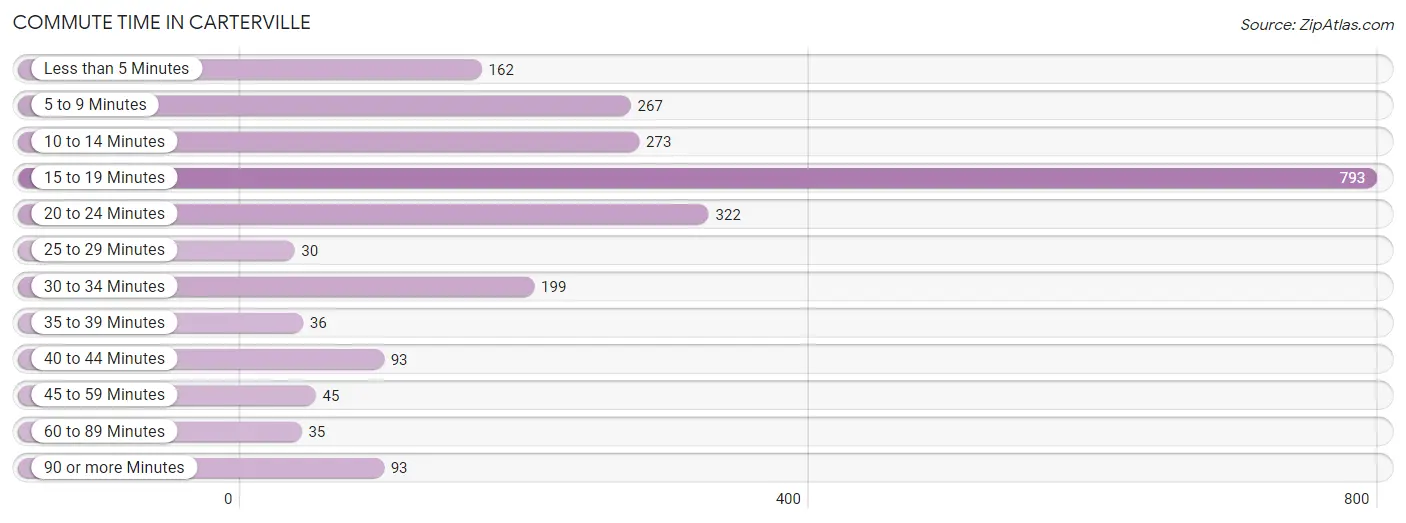
| Commute Time | # Commuters | % Commuters |
| Less than 5 Minutes | 162 | 6.9% |
| 5 to 9 Minutes | 267 | 11.4% |
| 10 to 14 Minutes | 273 | 11.6% |
| 15 to 19 Minutes | 793 | 33.8% |
| 20 to 24 Minutes | 322 | 13.7% |
| 25 to 29 Minutes | 30 | 1.3% |
| 30 to 34 Minutes | 199 | 8.5% |
| 35 to 39 Minutes | 36 | 1.5% |
| 40 to 44 Minutes | 93 | 4.0% |
| 45 to 59 Minutes | 45 | 1.9% |
| 60 to 89 Minutes | 35 | 1.5% |
| 90 or more Minutes | 93 | 4.0% |
Commute Time by Sex in Carterville
The most common commute times in Carterville are 15 to 19 minutes (470 commuters, 40.4%) for males and 15 to 19 minutes (323 commuters, 27.3%) for females.
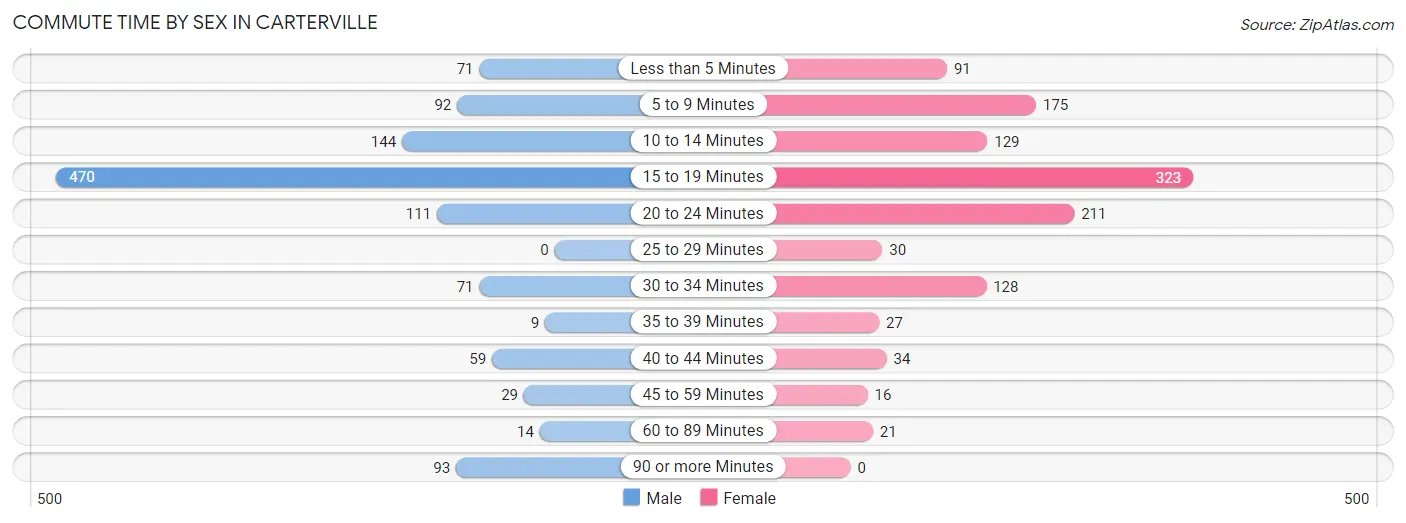
| Commute Time | Male | Female |
| Less than 5 Minutes | 71 (6.1%) | 91 (7.7%) |
| 5 to 9 Minutes | 92 (7.9%) | 175 (14.8%) |
| 10 to 14 Minutes | 144 (12.4%) | 129 (10.9%) |
| 15 to 19 Minutes | 470 (40.4%) | 323 (27.3%) |
| 20 to 24 Minutes | 111 (9.5%) | 211 (17.8%) |
| 25 to 29 Minutes | 0 (0.0%) | 30 (2.5%) |
| 30 to 34 Minutes | 71 (6.1%) | 128 (10.8%) |
| 35 to 39 Minutes | 9 (0.8%) | 27 (2.3%) |
| 40 to 44 Minutes | 59 (5.1%) | 34 (2.9%) |
| 45 to 59 Minutes | 29 (2.5%) | 16 (1.3%) |
| 60 to 89 Minutes | 14 (1.2%) | 21 (1.8%) |
| 90 or more Minutes | 93 (8.0%) | 0 (0.0%) |
Time of Departure to Work by Sex in Carterville
The most frequent times of departure to work in Carterville are 6:30 AM to 6:59 AM (225, 19.4%) for males and 7:30 AM to 7:59 AM (432, 36.5%) for females.
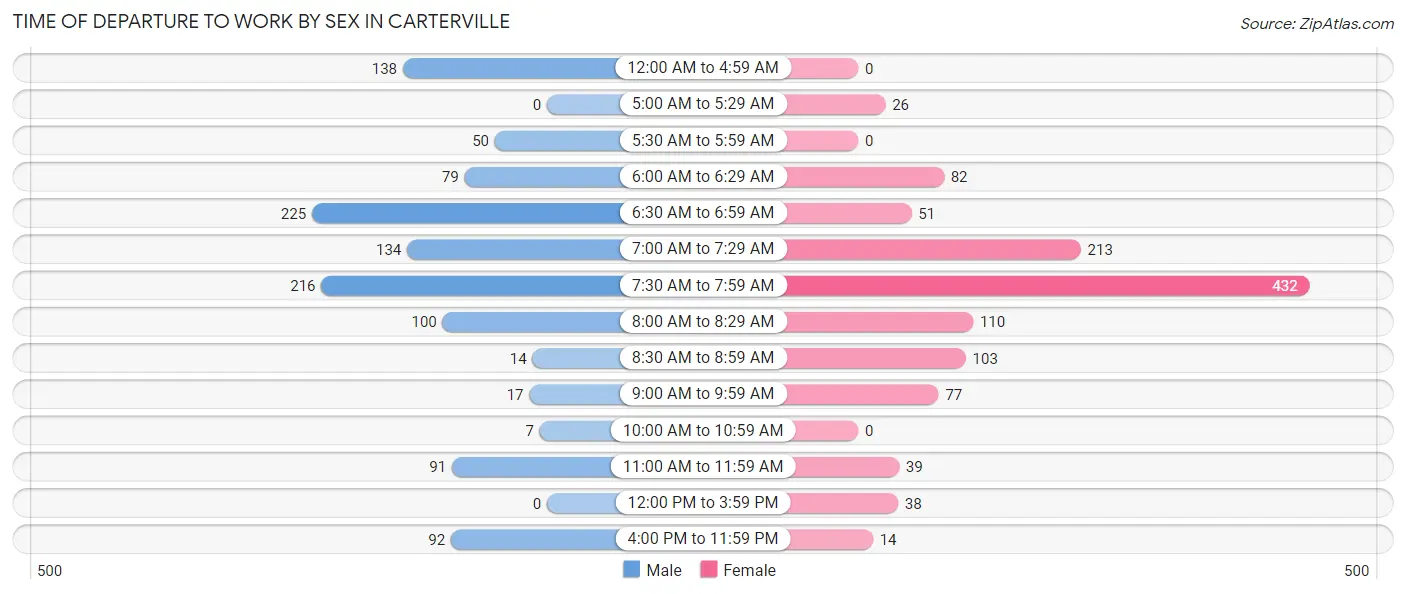
| Time of Departure | Male | Female |
| 12:00 AM to 4:59 AM | 138 (11.9%) | 0 (0.0%) |
| 5:00 AM to 5:29 AM | 0 (0.0%) | 26 (2.2%) |
| 5:30 AM to 5:59 AM | 50 (4.3%) | 0 (0.0%) |
| 6:00 AM to 6:29 AM | 79 (6.8%) | 82 (6.9%) |
| 6:30 AM to 6:59 AM | 225 (19.4%) | 51 (4.3%) |
| 7:00 AM to 7:29 AM | 134 (11.5%) | 213 (18.0%) |
| 7:30 AM to 7:59 AM | 216 (18.6%) | 432 (36.5%) |
| 8:00 AM to 8:29 AM | 100 (8.6%) | 110 (9.3%) |
| 8:30 AM to 8:59 AM | 14 (1.2%) | 103 (8.7%) |
| 9:00 AM to 9:59 AM | 17 (1.5%) | 77 (6.5%) |
| 10:00 AM to 10:59 AM | 7 (0.6%) | 0 (0.0%) |
| 11:00 AM to 11:59 AM | 91 (7.8%) | 39 (3.3%) |
| 12:00 PM to 3:59 PM | 0 (0.0%) | 38 (3.2%) |
| 4:00 PM to 11:59 PM | 92 (7.9%) | 14 (1.2%) |
| Total | 1,163 (100.0%) | 1,185 (100.0%) |
Housing Occupancy in Carterville
Occupancy by Ownership in Carterville
Of the total 2,545 dwellings in Carterville, owner-occupied units account for 1,800 (70.7%), while renter-occupied units make up 745 (29.3%).
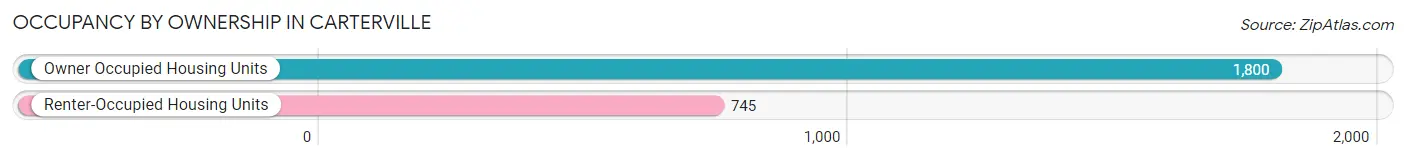
| Occupancy | # Housing Units | % Housing Units |
| Owner Occupied Housing Units | 1,800 | 70.7% |
| Renter-Occupied Housing Units | 745 | 29.3% |
| Total Occupied Housing Units | 2,545 | 100.0% |
Occupancy by Household Size in Carterville
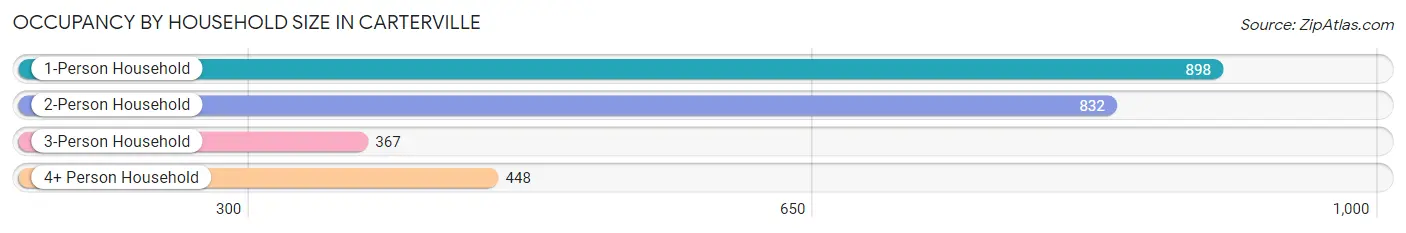
| Household Size | # Housing Units | % Housing Units |
| 1-Person Household | 898 | 35.3% |
| 2-Person Household | 832 | 32.7% |
| 3-Person Household | 367 | 14.4% |
| 4+ Person Household | 448 | 17.6% |
| Total Housing Units | 2,545 | 100.0% |
Occupancy by Ownership by Household Size in Carterville
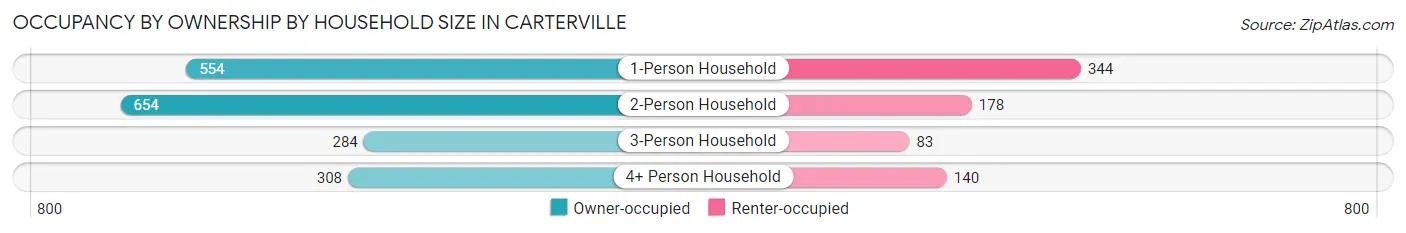
| Household Size | Owner-occupied | Renter-occupied |
| 1-Person Household | 554 (61.7%) | 344 (38.3%) |
| 2-Person Household | 654 (78.6%) | 178 (21.4%) |
| 3-Person Household | 284 (77.4%) | 83 (22.6%) |
| 4+ Person Household | 308 (68.8%) | 140 (31.2%) |
| Total Housing Units | 1,800 (70.7%) | 745 (29.3%) |
Occupancy by Educational Attainment in Carterville
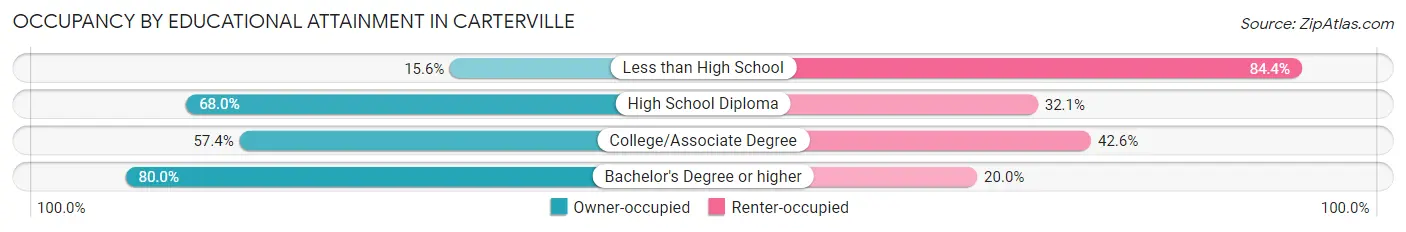
| Household Size | Owner-occupied | Renter-occupied |
| Less than High School | 5 (15.6%) | 27 (84.4%) |
| High School Diploma | 352 (67.9%) | 166 (32.1%) |
| College/Associate Degree | 388 (57.4%) | 288 (42.6%) |
| Bachelor's Degree or higher | 1,055 (80.0%) | 264 (20.0%) |
Occupancy by Age of Householder in Carterville
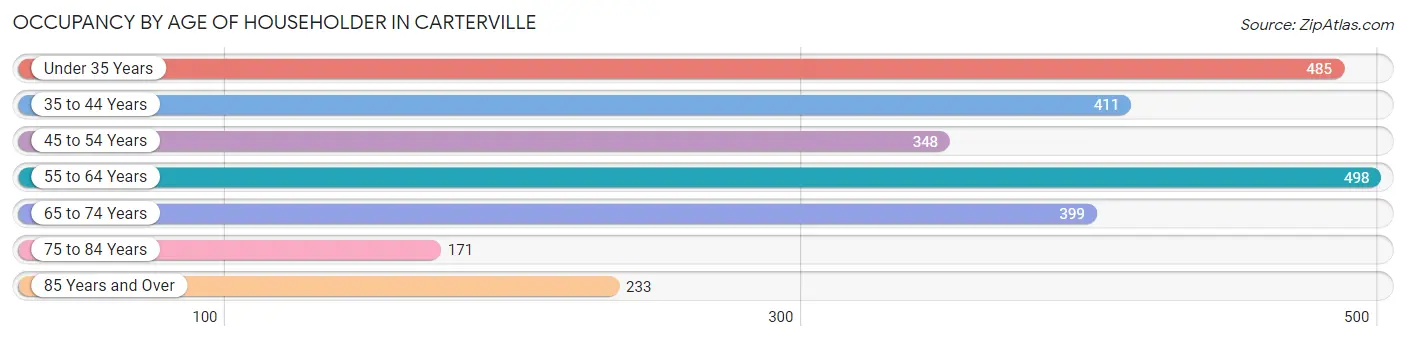
| Age Bracket | # Households | % Households |
| Under 35 Years | 485 | 19.1% |
| 35 to 44 Years | 411 | 16.2% |
| 45 to 54 Years | 348 | 13.7% |
| 55 to 64 Years | 498 | 19.6% |
| 65 to 74 Years | 399 | 15.7% |
| 75 to 84 Years | 171 | 6.7% |
| 85 Years and Over | 233 | 9.2% |
| Total | 2,545 | 100.0% |
Housing Finances in Carterville
Median Income by Occupancy in Carterville
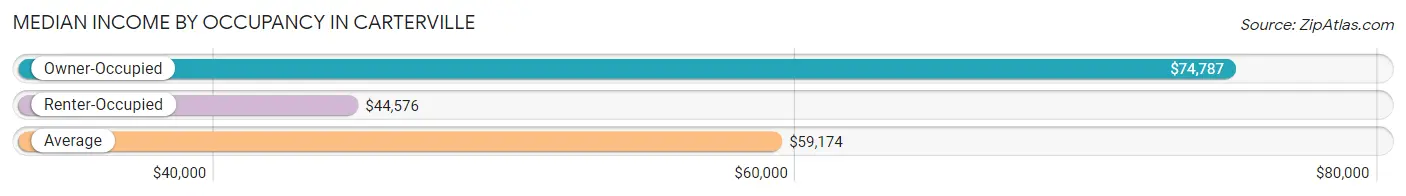
| Occupancy Type | # Households | Median Income |
| Owner-Occupied | 1,800 (70.7%) | $74,787 |
| Renter-Occupied | 745 (29.3%) | $44,576 |
| Average | 2,545 (100.0%) | $59,174 |
Occupancy by Householder Income Bracket in Carterville
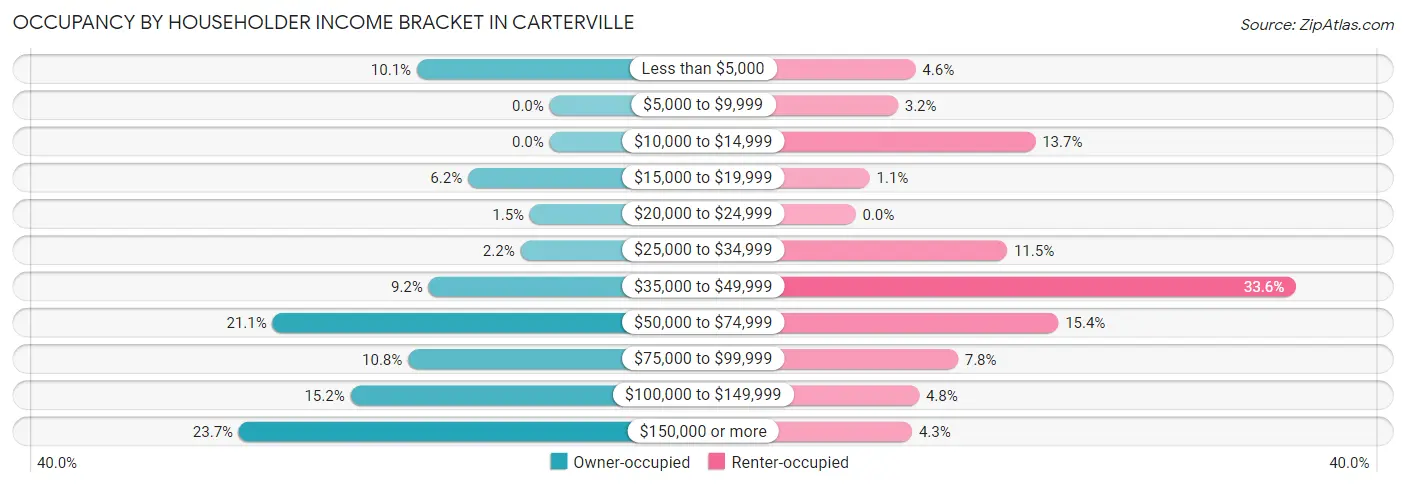
| Income Bracket | Owner-occupied | Renter-occupied |
| Less than $5,000 | 182 (10.1%) | 34 (4.6%) |
| $5,000 to $9,999 | 0 (0.0%) | 24 (3.2%) |
| $10,000 to $14,999 | 0 (0.0%) | 102 (13.7%) |
| $15,000 to $19,999 | 112 (6.2%) | 8 (1.1%) |
| $20,000 to $24,999 | 27 (1.5%) | 0 (0.0%) |
| $25,000 to $34,999 | 40 (2.2%) | 86 (11.5%) |
| $35,000 to $49,999 | 166 (9.2%) | 250 (33.6%) |
| $50,000 to $74,999 | 380 (21.1%) | 115 (15.4%) |
| $75,000 to $99,999 | 194 (10.8%) | 58 (7.8%) |
| $100,000 to $149,999 | 273 (15.2%) | 36 (4.8%) |
| $150,000 or more | 426 (23.7%) | 32 (4.3%) |
| Total | 1,800 (100.0%) | 745 (100.0%) |
Monthly Housing Cost Tiers in Carterville
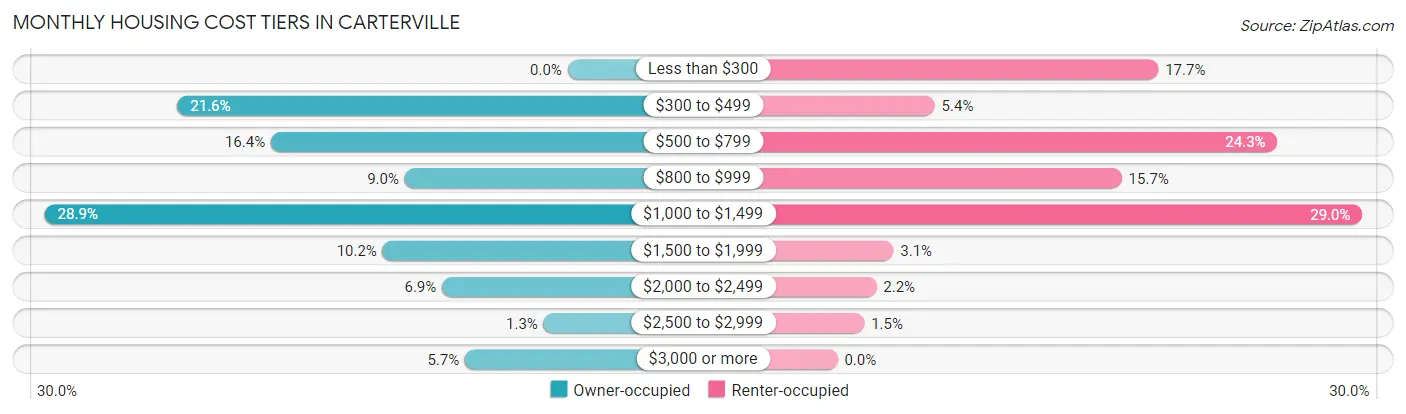
| Monthly Cost | Owner-occupied | Renter-occupied |
| Less than $300 | 0 (0.0%) | 132 (17.7%) |
| $300 to $499 | 388 (21.6%) | 40 (5.4%) |
| $500 to $799 | 295 (16.4%) | 181 (24.3%) |
| $800 to $999 | 162 (9.0%) | 117 (15.7%) |
| $1,000 to $1,499 | 520 (28.9%) | 216 (29.0%) |
| $1,500 to $1,999 | 184 (10.2%) | 23 (3.1%) |
| $2,000 to $2,499 | 125 (6.9%) | 16 (2.1%) |
| $2,500 to $2,999 | 24 (1.3%) | 11 (1.5%) |
| $3,000 or more | 102 (5.7%) | 0 (0.0%) |
| Total | 1,800 (100.0%) | 745 (100.0%) |
Physical Housing Characteristics in Carterville
Housing Structures in Carterville
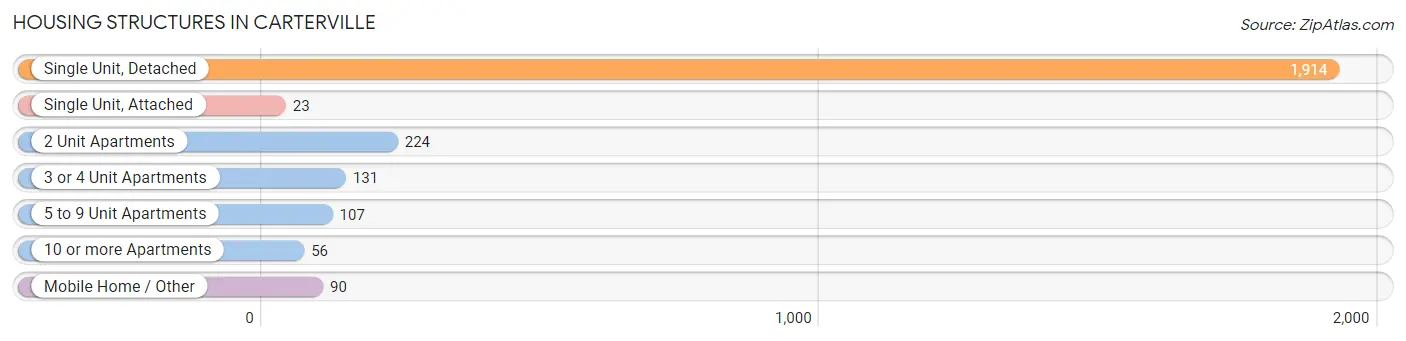
| Structure Type | # Housing Units | % Housing Units |
| Single Unit, Detached | 1,914 | 75.2% |
| Single Unit, Attached | 23 | 0.9% |
| 2 Unit Apartments | 224 | 8.8% |
| 3 or 4 Unit Apartments | 131 | 5.1% |
| 5 to 9 Unit Apartments | 107 | 4.2% |
| 10 or more Apartments | 56 | 2.2% |
| Mobile Home / Other | 90 | 3.5% |
| Total | 2,545 | 100.0% |
Housing Structures by Occupancy in Carterville
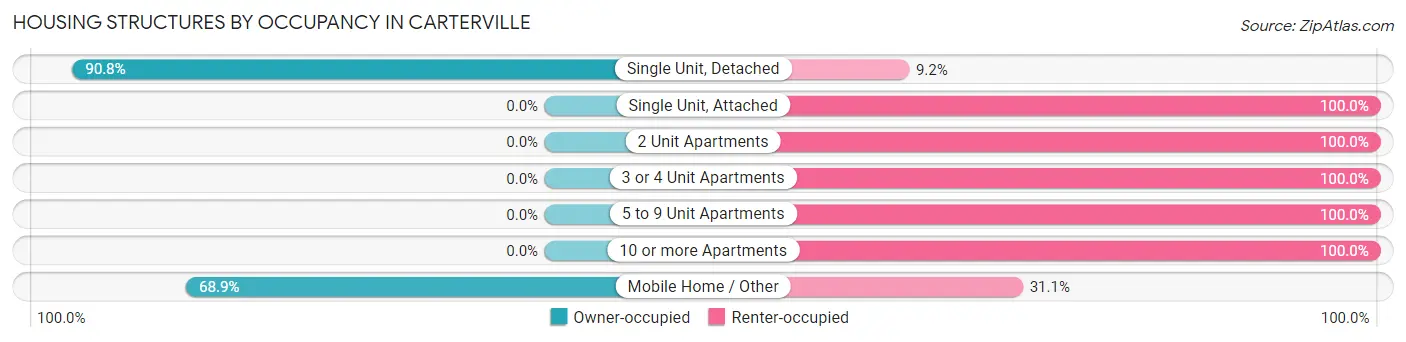
| Structure Type | Owner-occupied | Renter-occupied |
| Single Unit, Detached | 1,738 (90.8%) | 176 (9.2%) |
| Single Unit, Attached | 0 (0.0%) | 23 (100.0%) |
| 2 Unit Apartments | 0 (0.0%) | 224 (100.0%) |
| 3 or 4 Unit Apartments | 0 (0.0%) | 131 (100.0%) |
| 5 to 9 Unit Apartments | 0 (0.0%) | 107 (100.0%) |
| 10 or more Apartments | 0 (0.0%) | 56 (100.0%) |
| Mobile Home / Other | 62 (68.9%) | 28 (31.1%) |
| Total | 1,800 (70.7%) | 745 (29.3%) |
Housing Structures by Number of Rooms in Carterville
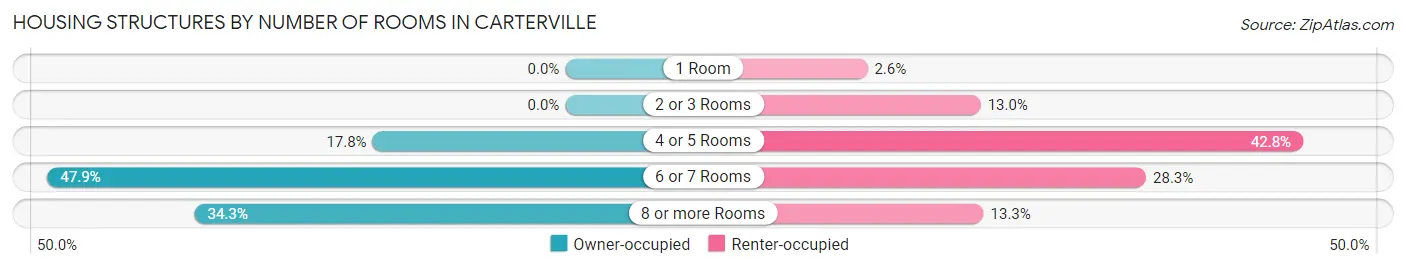
| Number of Rooms | Owner-occupied | Renter-occupied |
| 1 Room | 0 (0.0%) | 19 (2.5%) |
| 2 or 3 Rooms | 0 (0.0%) | 97 (13.0%) |
| 4 or 5 Rooms | 321 (17.8%) | 319 (42.8%) |
| 6 or 7 Rooms | 862 (47.9%) | 211 (28.3%) |
| 8 or more Rooms | 617 (34.3%) | 99 (13.3%) |
| Total | 1,800 (100.0%) | 745 (100.0%) |
Housing Structure by Heating Type in Carterville
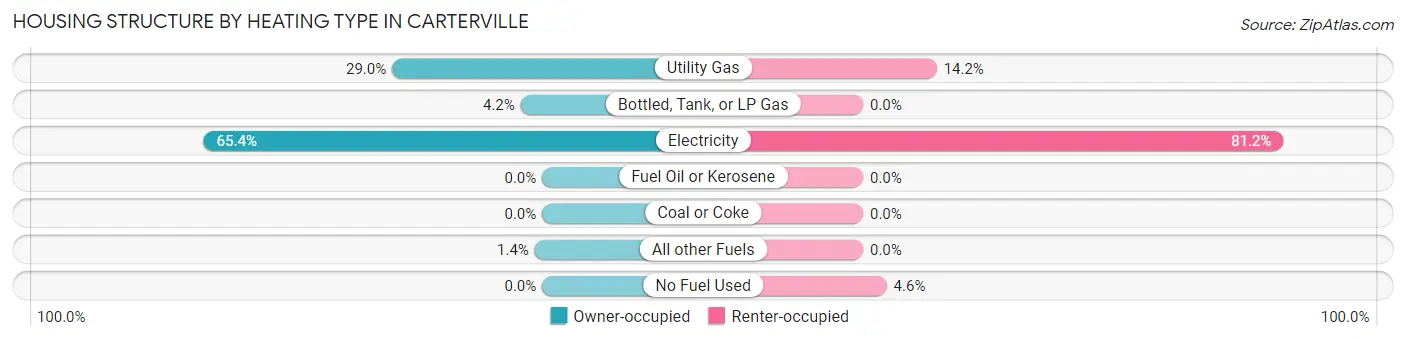
| Heating Type | Owner-occupied | Renter-occupied |
| Utility Gas | 522 (29.0%) | 106 (14.2%) |
| Bottled, Tank, or LP Gas | 75 (4.2%) | 0 (0.0%) |
| Electricity | 1,177 (65.4%) | 605 (81.2%) |
| Fuel Oil or Kerosene | 0 (0.0%) | 0 (0.0%) |
| Coal or Coke | 0 (0.0%) | 0 (0.0%) |
| All other Fuels | 26 (1.4%) | 0 (0.0%) |
| No Fuel Used | 0 (0.0%) | 34 (4.6%) |
| Total | 1,800 (100.0%) | 745 (100.0%) |
Household Vehicle Usage in Carterville
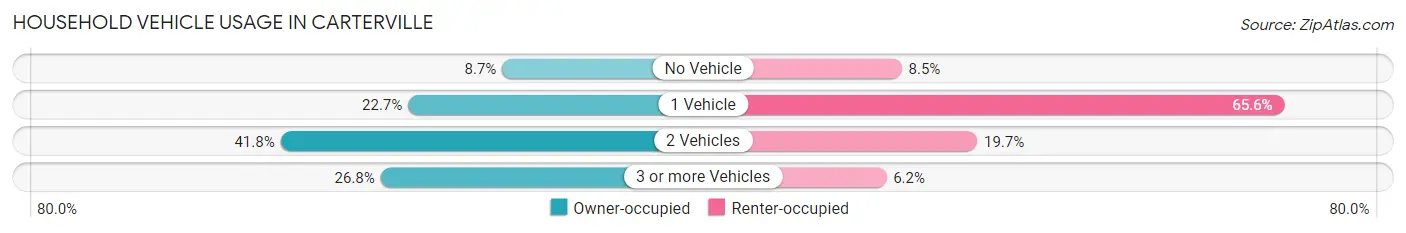
| Vehicles per Household | Owner-occupied | Renter-occupied |
| No Vehicle | 156 (8.7%) | 63 (8.5%) |
| 1 Vehicle | 409 (22.7%) | 489 (65.6%) |
| 2 Vehicles | 752 (41.8%) | 147 (19.7%) |
| 3 or more Vehicles | 483 (26.8%) | 46 (6.2%) |
| Total | 1,800 (100.0%) | 745 (100.0%) |
Real Estate & Mortgages in Carterville
Real Estate and Mortgage Overview in Carterville
| Characteristic | Without Mortgage | With Mortgage |
| Housing Units | 747 | 1,053 |
| Median Property Value | $140,600 | $188,100 |
| Median Household Income | $39,883 | $310 |
| Monthly Housing Costs | $495 | $102 |
| Real Estate Taxes | $2,142 | $30 |
Property Value by Mortgage Status in Carterville
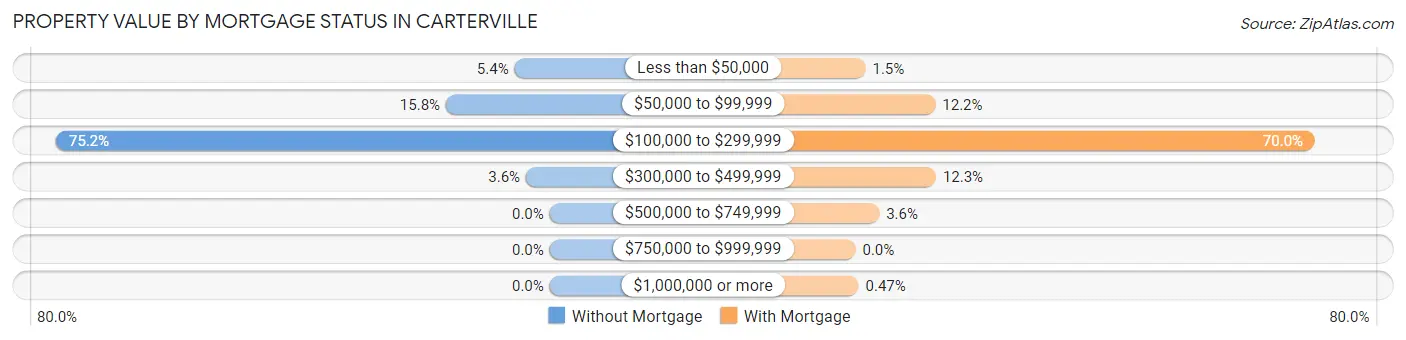
| Property Value | Without Mortgage | With Mortgage |
| Less than $50,000 | 40 (5.3%) | 16 (1.5%) |
| $50,000 to $99,999 | 118 (15.8%) | 128 (12.2%) |
| $100,000 to $299,999 | 562 (75.2%) | 737 (70.0%) |
| $300,000 to $499,999 | 27 (3.6%) | 129 (12.2%) |
| $500,000 to $749,999 | 0 (0.0%) | 38 (3.6%) |
| $750,000 to $999,999 | 0 (0.0%) | 0 (0.0%) |
| $1,000,000 or more | 0 (0.0%) | 5 (0.5%) |
| Total | 747 (100.0%) | 1,053 (100.0%) |
Household Income by Mortgage Status in Carterville
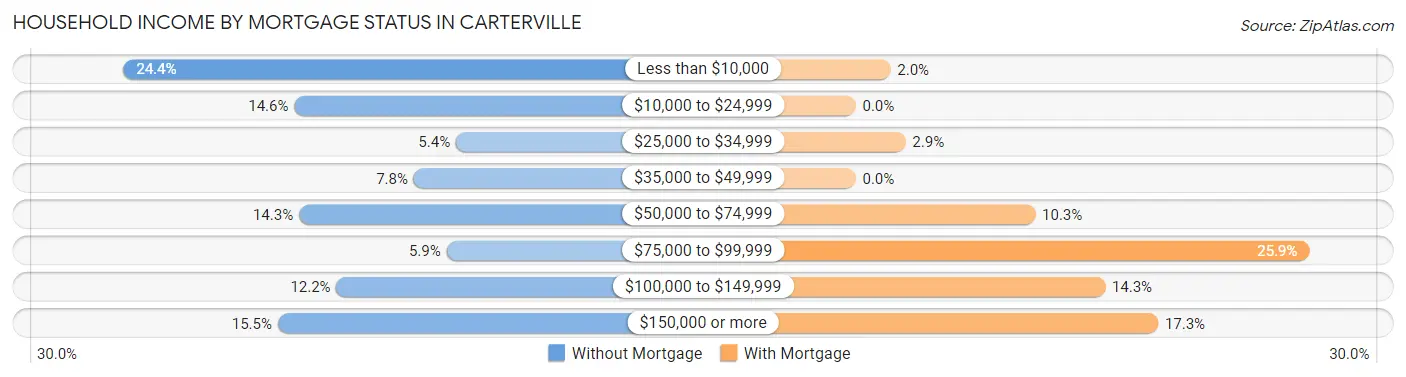
| Household Income | Without Mortgage | With Mortgage |
| Less than $10,000 | 182 (24.4%) | 21 (2.0%) |
| $10,000 to $24,999 | 109 (14.6%) | 0 (0.0%) |
| $25,000 to $34,999 | 40 (5.3%) | 30 (2.9%) |
| $35,000 to $49,999 | 58 (7.8%) | 0 (0.0%) |
| $50,000 to $74,999 | 107 (14.3%) | 108 (10.3%) |
| $75,000 to $99,999 | 44 (5.9%) | 273 (25.9%) |
| $100,000 to $149,999 | 91 (12.2%) | 150 (14.2%) |
| $150,000 or more | 116 (15.5%) | 182 (17.3%) |
| Total | 747 (100.0%) | 1,053 (100.0%) |
Property Value to Household Income Ratio in Carterville
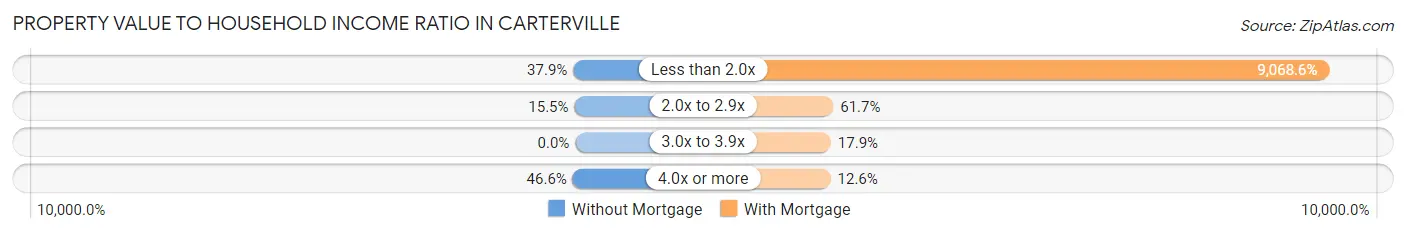
| Value-to-Income Ratio | Without Mortgage | With Mortgage |
| Less than 2.0x | 283 (37.9%) | 95,492 (9,068.6%) |
| 2.0x to 2.9x | 116 (15.5%) | 650 (61.7%) |
| 3.0x to 3.9x | 0 (0.0%) | 188 (17.8%) |
| 4.0x or more | 348 (46.6%) | 133 (12.6%) |
| Total | 747 (100.0%) | 1,053 (100.0%) |
Real Estate Taxes by Mortgage Status in Carterville
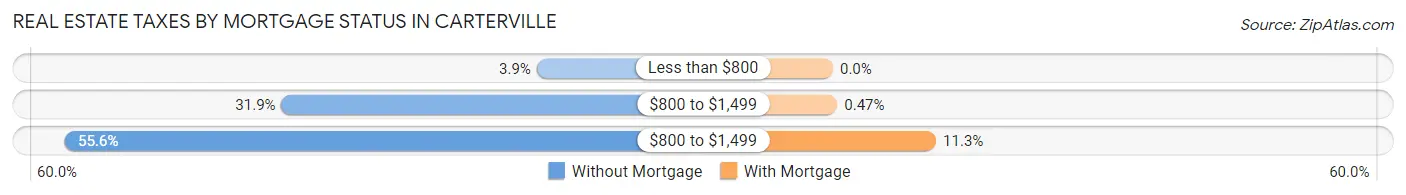
| Property Taxes | Without Mortgage | With Mortgage |
| Less than $800 | 29 (3.9%) | 0 (0.0%) |
| $800 to $1,499 | 238 (31.9%) | 5 (0.5%) |
| $800 to $1,499 | 415 (55.6%) | 119 (11.3%) |
| Total | 747 (100.0%) | 1,053 (100.0%) |
Health & Disability in Carterville
Health Insurance Coverage by Age in Carterville
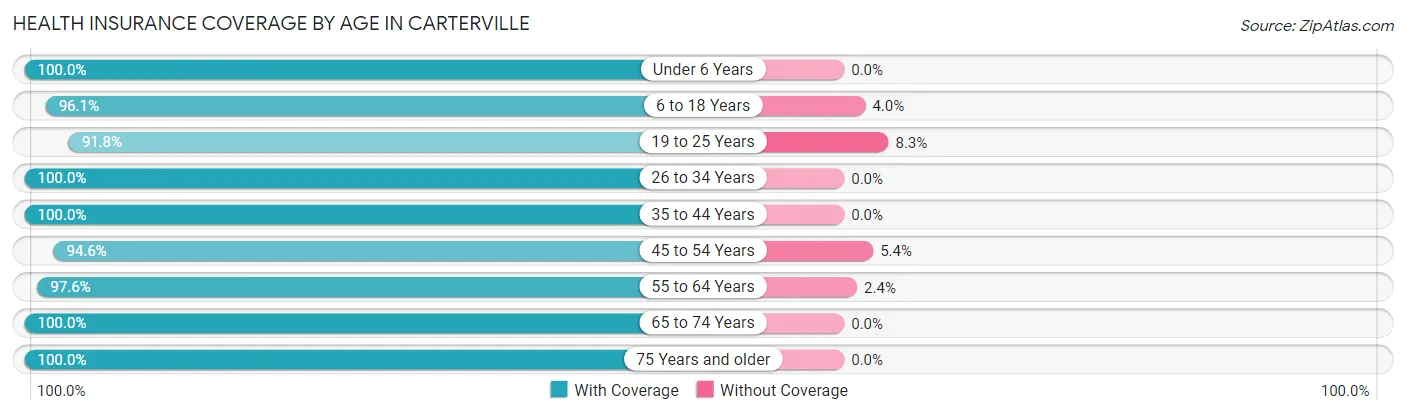
| Age Bracket | With Coverage | Without Coverage |
| Under 6 Years | 691 (100.0%) | 0 (0.0%) |
| 6 to 18 Years | 827 (96.1%) | 34 (4.0%) |
| 19 to 25 Years | 367 (91.7%) | 33 (8.3%) |
| 26 to 34 Years | 664 (100.0%) | 0 (0.0%) |
| 35 to 44 Years | 652 (100.0%) | 0 (0.0%) |
| 45 to 54 Years | 562 (94.6%) | 32 (5.4%) |
| 55 to 64 Years | 814 (97.6%) | 20 (2.4%) |
| 65 to 74 Years | 595 (100.0%) | 0 (0.0%) |
| 75 Years and older | 495 (100.0%) | 0 (0.0%) |
| Total | 5,667 (97.9%) | 119 (2.1%) |
Health Insurance Coverage by Citizenship Status in Carterville
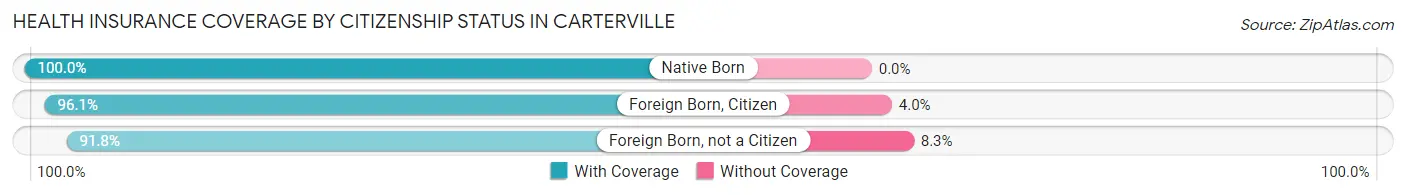
| Citizenship Status | With Coverage | Without Coverage |
| Native Born | 691 (100.0%) | 0 (0.0%) |
| Foreign Born, Citizen | 827 (96.1%) | 34 (4.0%) |
| Foreign Born, not a Citizen | 367 (91.7%) | 33 (8.3%) |
Health Insurance Coverage by Household Income in Carterville
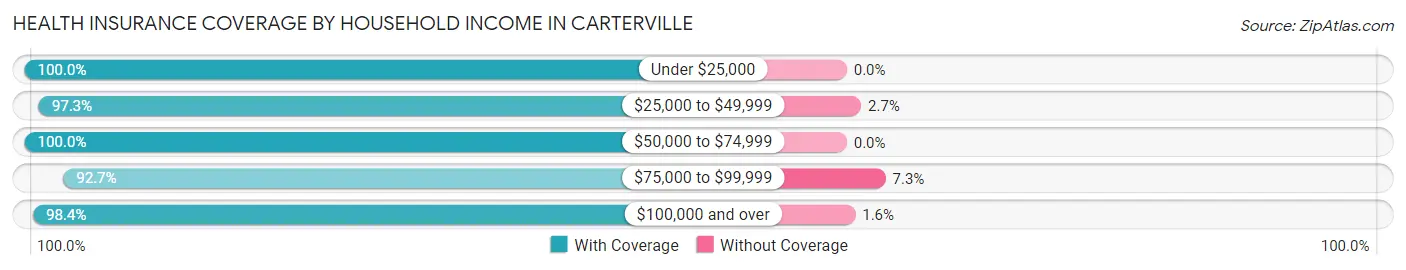
| Household Income | With Coverage | Without Coverage |
| Under $25,000 | 959 (100.0%) | 0 (0.0%) |
| $25,000 to $49,999 | 1,053 (97.3%) | 29 (2.7%) |
| $50,000 to $74,999 | 880 (100.0%) | 0 (0.0%) |
| $75,000 to $99,999 | 727 (92.7%) | 57 (7.3%) |
| $100,000 and over | 2,048 (98.4%) | 33 (1.6%) |
Public vs Private Health Insurance Coverage by Age in Carterville
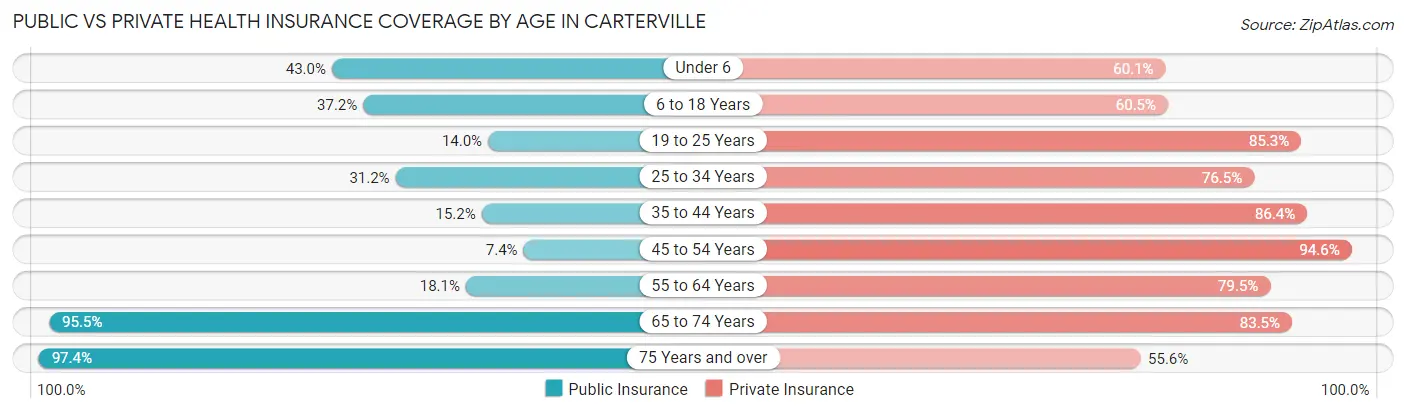
| Age Bracket | Public Insurance | Private Insurance |
| Under 6 | 297 (43.0%) | 415 (60.1%) |
| 6 to 18 Years | 320 (37.2%) | 521 (60.5%) |
| 19 to 25 Years | 56 (14.0%) | 341 (85.3%) |
| 25 to 34 Years | 207 (31.2%) | 508 (76.5%) |
| 35 to 44 Years | 99 (15.2%) | 563 (86.4%) |
| 45 to 54 Years | 44 (7.4%) | 562 (94.6%) |
| 55 to 64 Years | 151 (18.1%) | 663 (79.5%) |
| 65 to 74 Years | 568 (95.5%) | 497 (83.5%) |
| 75 Years and over | 482 (97.4%) | 275 (55.6%) |
| Total | 2,224 (38.4%) | 4,345 (75.1%) |
Disability Status by Sex by Age in Carterville
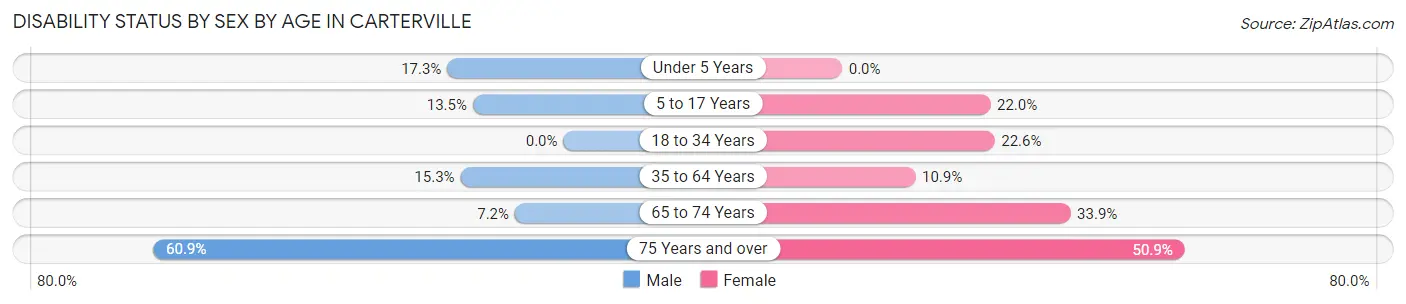
| Age Bracket | Male | Female |
| Under 5 Years | 49 (17.2%) | 0 (0.0%) |
| 5 to 17 Years | 67 (13.5%) | 116 (22.0%) |
| 18 to 34 Years | 0 (0.0%) | 134 (22.6%) |
| 35 to 64 Years | 141 (15.3%) | 126 (10.9%) |
| 65 to 74 Years | 18 (7.2%) | 117 (33.9%) |
| 75 Years and over | 67 (60.9%) | 196 (50.9%) |
Disability Class by Sex by Age in Carterville
Disability Class: Hearing Difficulty
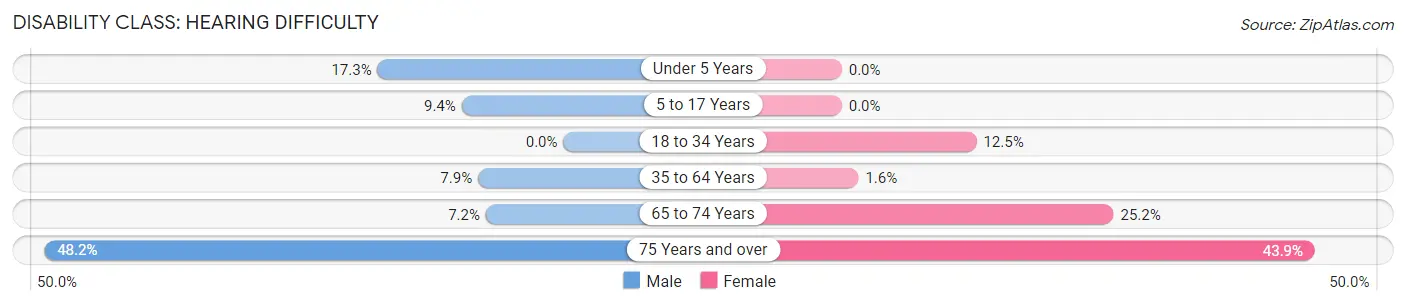
| Age Bracket | Male | Female |
| Under 5 Years | 49 (17.2%) | 0 (0.0%) |
| 5 to 17 Years | 47 (9.4%) | 0 (0.0%) |
| 18 to 34 Years | 0 (0.0%) | 74 (12.5%) |
| 35 to 64 Years | 73 (7.9%) | 18 (1.5%) |
| 65 to 74 Years | 18 (7.2%) | 87 (25.2%) |
| 75 Years and over | 53 (48.2%) | 169 (43.9%) |
Disability Class: Vision Difficulty
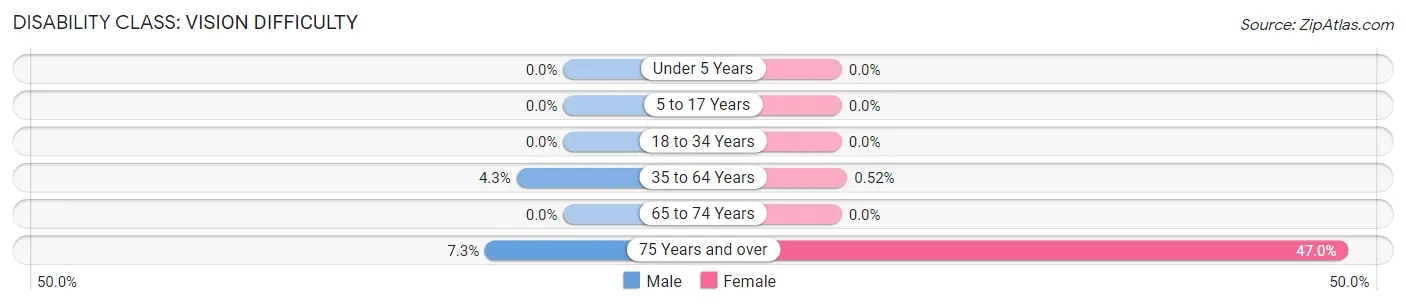
| Age Bracket | Male | Female |
| Under 5 Years | 0 (0.0%) | 0 (0.0%) |
| 5 to 17 Years | 0 (0.0%) | 0 (0.0%) |
| 18 to 34 Years | 0 (0.0%) | 0 (0.0%) |
| 35 to 64 Years | 40 (4.3%) | 6 (0.5%) |
| 65 to 74 Years | 0 (0.0%) | 0 (0.0%) |
| 75 Years and over | 8 (7.3%) | 181 (47.0%) |
Disability Class: Cognitive Difficulty
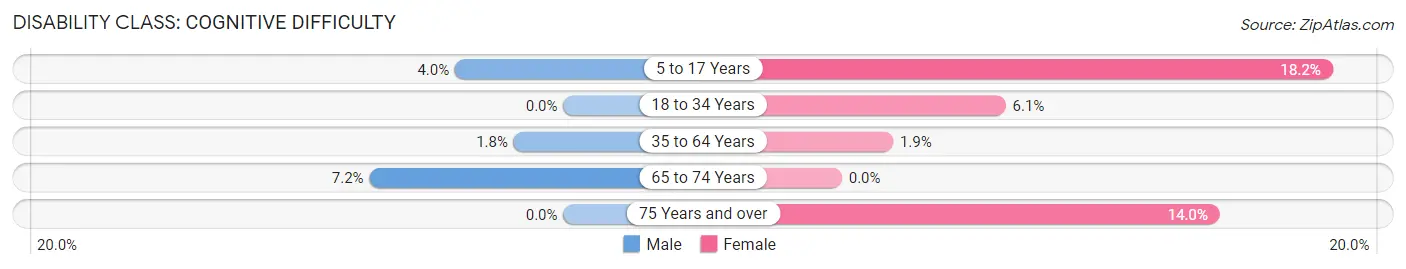
| Age Bracket | Male | Female |
| 5 to 17 Years | 20 (4.0%) | 96 (18.2%) |
| 18 to 34 Years | 0 (0.0%) | 36 (6.1%) |
| 35 to 64 Years | 17 (1.8%) | 22 (1.9%) |
| 65 to 74 Years | 18 (7.2%) | 0 (0.0%) |
| 75 Years and over | 0 (0.0%) | 54 (14.0%) |
Disability Class: Ambulatory Difficulty
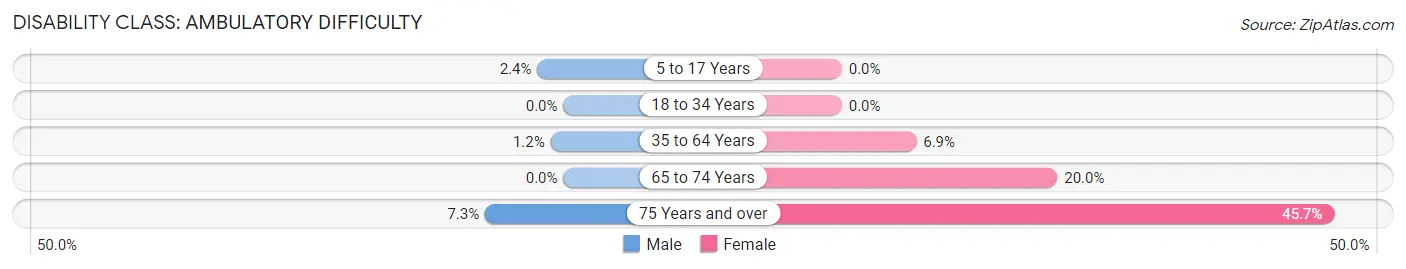
| Age Bracket | Male | Female |
| 5 to 17 Years | 12 (2.4%) | 0 (0.0%) |
| 18 to 34 Years | 0 (0.0%) | 0 (0.0%) |
| 35 to 64 Years | 11 (1.2%) | 80 (6.9%) |
| 65 to 74 Years | 0 (0.0%) | 69 (20.0%) |
| 75 Years and over | 8 (7.3%) | 176 (45.7%) |
Disability Class: Self-Care Difficulty
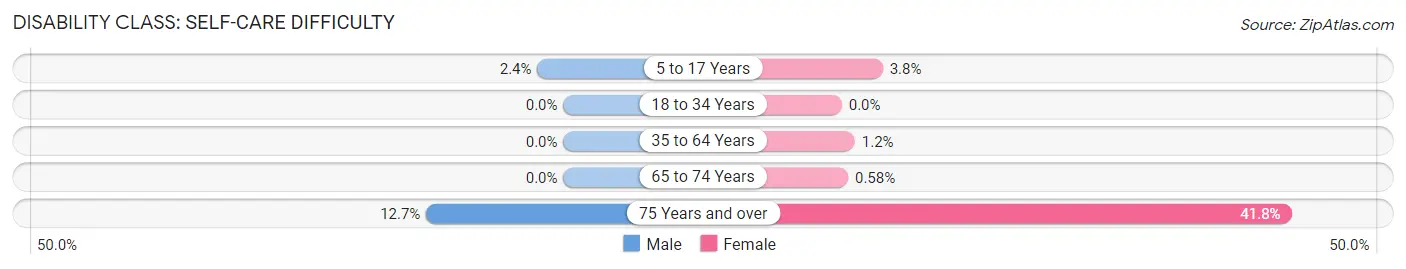
| Age Bracket | Male | Female |
| 5 to 17 Years | 12 (2.4%) | 20 (3.8%) |
| 18 to 34 Years | 0 (0.0%) | 0 (0.0%) |
| 35 to 64 Years | 0 (0.0%) | 14 (1.2%) |
| 65 to 74 Years | 0 (0.0%) | 2 (0.6%) |
| 75 Years and over | 14 (12.7%) | 161 (41.8%) |
Technology Access in Carterville
Computing Device Access in Carterville
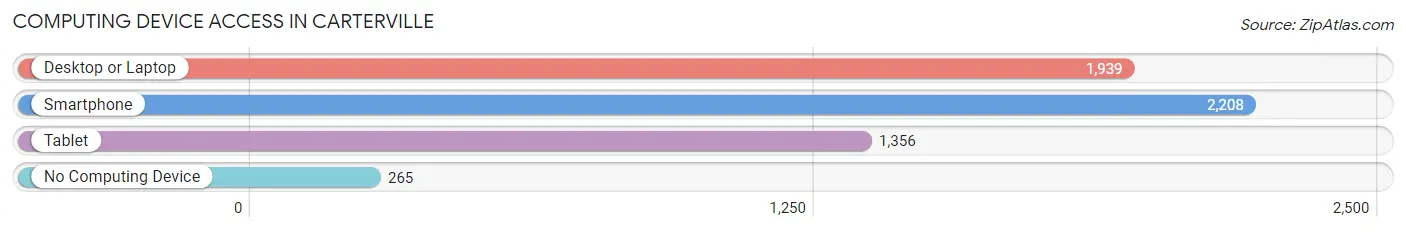
| Device Type | # Households | % Households |
| Desktop or Laptop | 1,939 | 76.2% |
| Smartphone | 2,208 | 86.8% |
| Tablet | 1,356 | 53.3% |
| No Computing Device | 265 | 10.4% |
| Total | 2,545 | 100.0% |
Internet Access in Carterville
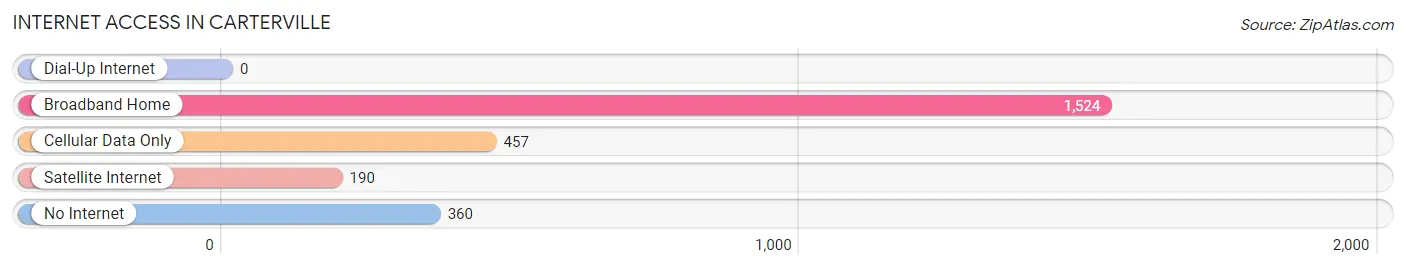
| Internet Type | # Households | % Households |
| Dial-Up Internet | 0 | 0.0% |
| Broadband Home | 1,524 | 59.9% |
| Cellular Data Only | 457 | 18.0% |
| Satellite Internet | 190 | 7.5% |
| No Internet | 360 | 14.1% |
| Total | 2,545 | 100.0% |
Carterville Summary
Carbondale, Illinois is a city located in Jackson County, Illinois, United States. The population was 13,914 at the 2010 census. It is the county seat of Jackson County. The city is part of the Carbondale-Marion-Herrin, IL Metropolitan Statistical Area.
History
Carbondale was founded in 1852 by Daniel Harmon Brush, a lawyer from New York. He named the city after the coal deposits in the area, which were known as "Carbondale coal." The city was incorporated in 1855.
In the late 19th century, Carbondale was a major coal mining center. The city was home to several coal mines, including the Carbondale Mine, which was the largest coal mine in the state. The city was also home to several other industries, including a brickyard, a glass factory, and a paper mill.
In the early 20th century, Carbondale was a major center for the Illinois Central Railroad. The city was also home to several large manufacturing plants, including a steel mill and a paper mill.
Geography
Carbondale is located at 37°44′N 89°17′W (37.735, -89.283). According to the 2010 census, the city has a total area of 8.9 square miles (23.1 km2), of which 8.8 square miles (22.8 km2) is land and 0.1 square miles (0.3 km2) is water.
Carbondale is located in the southern part of Illinois, about 100 miles (160 km) southeast of St. Louis, Missouri. The city is situated in the Shawnee Hills, a region of rolling hills and forests. The city is located near the confluence of the Big Muddy River and the Little Muddy River.
Economy
Carbondale is the economic hub of Jackson County. The city is home to several large employers, including Southern Illinois University, the largest employer in the city. Other major employers include the Carbondale Memorial Hospital, the Carbondale Public School District, and the City of Carbondale.
The city is also home to several small businesses, including restaurants, retail stores, and service providers. The city is also home to several industrial parks, which are home to a variety of manufacturing and distribution companies.
Demographics
As of the 2010 census, there were 13,914 people, 5,845 households, and 2,945 families residing in the city. The population density was 1,569.3 people per square mile (606.2/km2). There were 6,521 housing units at an average density of 735.2 per square mile (284.2/km2). The racial makeup of the city was 68.2% White, 24.3% African American, 0.3% Native American, 2.2% Asian, 0.1% Pacific Islander, 2.2% from other races, and 2.9% from two or more races. Hispanic or Latino of any race were 5.7% of the population.
There were 5,845 households, out of which 20.2% had children under the age of 18 living with them, 33.2% were married couples living together, 13.3% had a female householder with no husband present, and 49.2% were non-families. 36.2% of all households were made up of individuals, and 11.2% had someone living alone who was 65 years of age or older. The average household size was 2.20 and the average family size was 2.89.
In the city, the population was spread out, with 18.2% under the age of 18, 24.2% from 18 to 24, 24.7% from 25 to 44, 20.3% from 45 to 64, and 12.6% who were 65 years of age or older. The median age was 30 years. For every 100 females, there were 91.2 males. For every 100 females age 18 and over, there were 88.3 males.
The median income for a household in the city was $27,917, and the median income for a family was $37,917. Males had a median income of $30,917 versus $22,917 for females. The per capita income for the city was $17,917. About 16.2% of families and 24.2% of the population were below the poverty line, including 28.2% of those under age 18 and 10.2% of those age 65 or over.
Common Questions
What is Per Capita Income in Carterville?
Per Capita income in Carterville is $40,352.
What is the Median Family Income in Carterville?
Median Family Income in Carterville is $90,146.
What is the Median Household income in Carterville?
Median Household Income in Carterville is $59,174.
What is Income or Wage Gap in Carterville?
Income or Wage Gap in Carterville is 15.7%.
Women in Carterville earn 84.3 cents for every dollar earned by a man.
What is Inequality or Gini Index in Carterville?
Inequality or Gini Index in Carterville is 0.49.
What is the Total Population of Carterville?
Total Population of Carterville is 5,836.
What is the Total Male Population of Carterville?
Total Male Population of Carterville is 2,642.
What is the Total Female Population of Carterville?
Total Female Population of Carterville is 3,194.
What is the Ratio of Males per 100 Females in Carterville?
There are 82.72 Males per 100 Females in Carterville.
What is the Ratio of Females per 100 Males in Carterville?
There are 120.89 Females per 100 Males in Carterville.
What is the Median Population Age in Carterville?
Median Population Age in Carterville is 38.6 Years.
What is the Average Family Size in Carterville
Average Family Size in Carterville is 3.0 People.
What is the Average Household Size in Carterville
Average Household Size in Carterville is 2.3 People.
How Large is the Labor Force in Carterville?
There are 2,610 People in the Labor Forcein in Carterville.
What is the Percentage of People in the Labor Force in Carterville?
58.8% of People are in the Labor Force in Carterville.
What is the Unemployment Rate in Carterville?
Unemployment Rate in Carterville is 2.7%.