La Prairie, IL Map & Demographics
La Prairie Map
La Prairie Overview
$20,904
PER CAPITA INCOME
$78,750
AVG FAMILY INCOME
$78,333
AVG HOUSEHOLD INCOME
0.27
INEQUALITY / GINI INDEX
51
TOTAL POPULATION
26
MALE POPULATION
25
FEMALE POPULATION
104.00
MALES / 100 FEMALES
96.15
FEMALES / 100 MALES
40.8
MEDIAN AGE
2.8
AVG FAMILY SIZE
2.5
AVG HOUSEHOLD SIZE
20
LABOR FORCE [ PEOPLE ]
39.2%
PERCENT IN LABOR FORCE
20.0%
UNEMPLOYMENT RATE
La Prairie Zip Codes
La Prairie Area Codes
Income in La Prairie
Income Overview in La Prairie
Per Capita Income in La Prairie is $20,904, while median incomes of families and households are $78,750 and $78,333 respectively.
| Characteristic | Number | Measure |
| Per Capita Income | 51 | $20,904 |
| Median Family Income | 17 | $78,750 |
| Mean Family Income | 17 | $72,853 |
| Median Household Income | 20 | $78,333 |
| Mean Household Income | 20 | $64,805 |
| Income Deficit | 17 | $0 |
| Wage / Income Gap (%) | 51 | 0.00% |
| Wage / Income Gap ($) | 51 | 100.00¢ per $1 |
| Gini / Inequality Index | 51 | 0.27 |
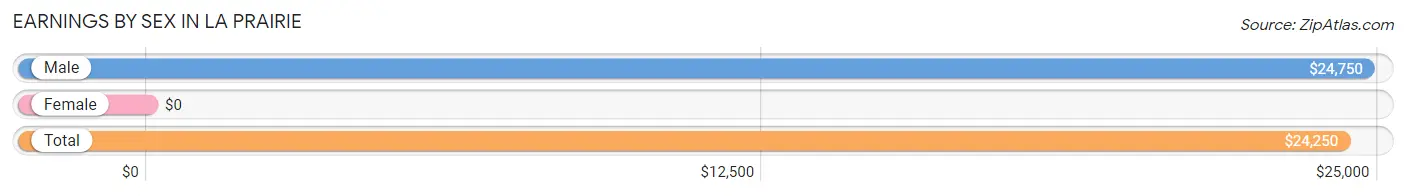
Earnings by Sex in La Prairie
| Sex | Number | Average Earnings |
| Male | 11 (37.9%) | $24,750 |
| Female | 18 (62.1%) | $0 |
| Total | 29 (100.0%) | $24,250 |
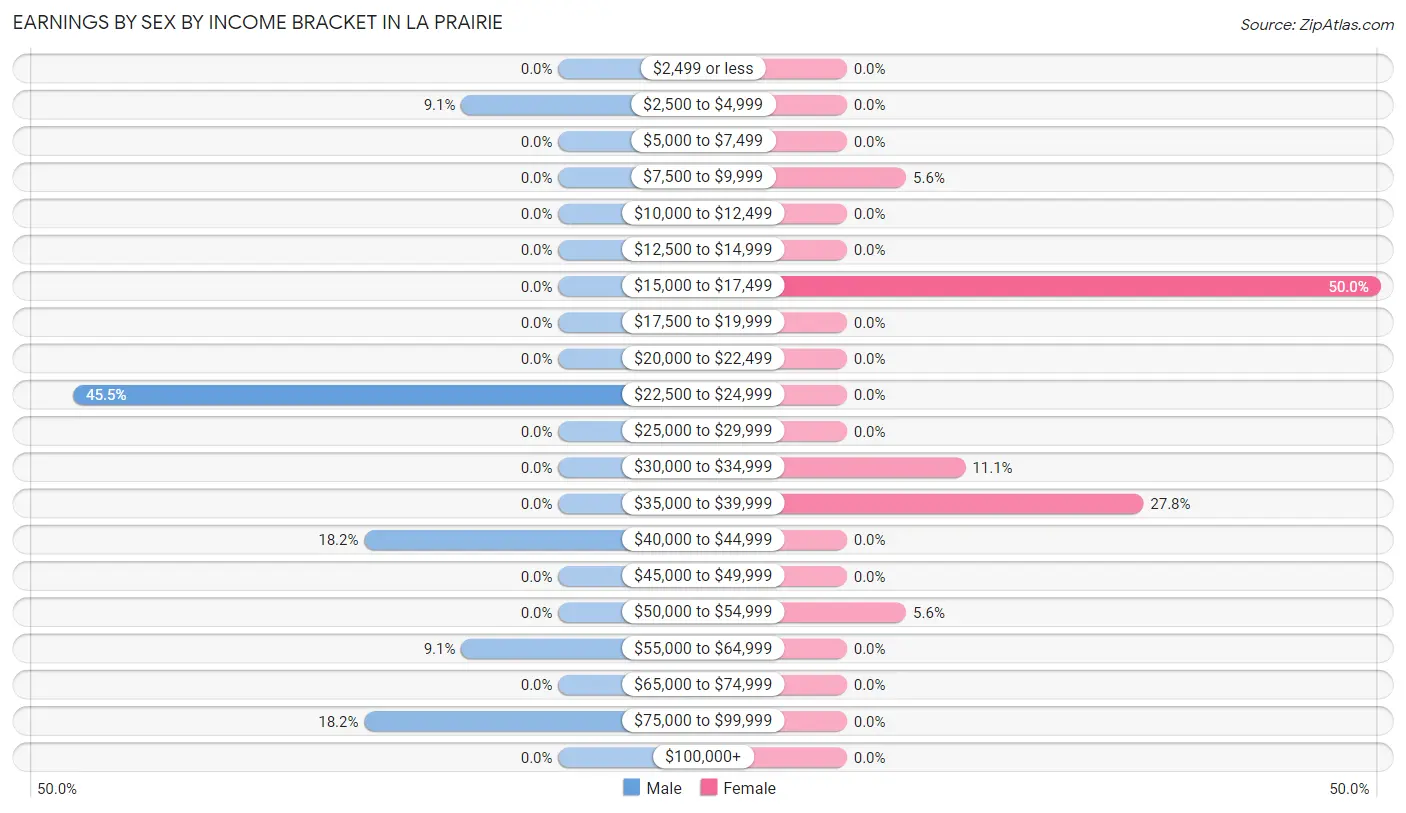
Earnings by Sex by Income Bracket in La Prairie
The most common earnings brackets in La Prairie are $22,500 to $24,999 for men (5 | 45.5%) and $15,000 to $17,499 for women (9 | 50.0%).
| Income | Male | Female |
| $2,499 or less | 0 (0.0%) | 0 (0.0%) |
| $2,500 to $4,999 | 1 (9.1%) | 0 (0.0%) |
| $5,000 to $7,499 | 0 (0.0%) | 0 (0.0%) |
| $7,500 to $9,999 | 0 (0.0%) | 1 (5.6%) |
| $10,000 to $12,499 | 0 (0.0%) | 0 (0.0%) |
| $12,500 to $14,999 | 0 (0.0%) | 0 (0.0%) |
| $15,000 to $17,499 | 0 (0.0%) | 9 (50.0%) |
| $17,500 to $19,999 | 0 (0.0%) | 0 (0.0%) |
| $20,000 to $22,499 | 0 (0.0%) | 0 (0.0%) |
| $22,500 to $24,999 | 5 (45.5%) | 0 (0.0%) |
| $25,000 to $29,999 | 0 (0.0%) | 0 (0.0%) |
| $30,000 to $34,999 | 0 (0.0%) | 2 (11.1%) |
| $35,000 to $39,999 | 0 (0.0%) | 5 (27.8%) |
| $40,000 to $44,999 | 2 (18.2%) | 0 (0.0%) |
| $45,000 to $49,999 | 0 (0.0%) | 0 (0.0%) |
| $50,000 to $54,999 | 0 (0.0%) | 1 (5.6%) |
| $55,000 to $64,999 | 1 (9.1%) | 0 (0.0%) |
| $65,000 to $74,999 | 0 (0.0%) | 0 (0.0%) |
| $75,000 to $99,999 | 2 (18.2%) | 0 (0.0%) |
| $100,000+ | 0 (0.0%) | 0 (0.0%) |
| Total | 11 (100.0%) | 18 (100.0%) |
Earnings by Sex by Educational Attainment in La Prairie
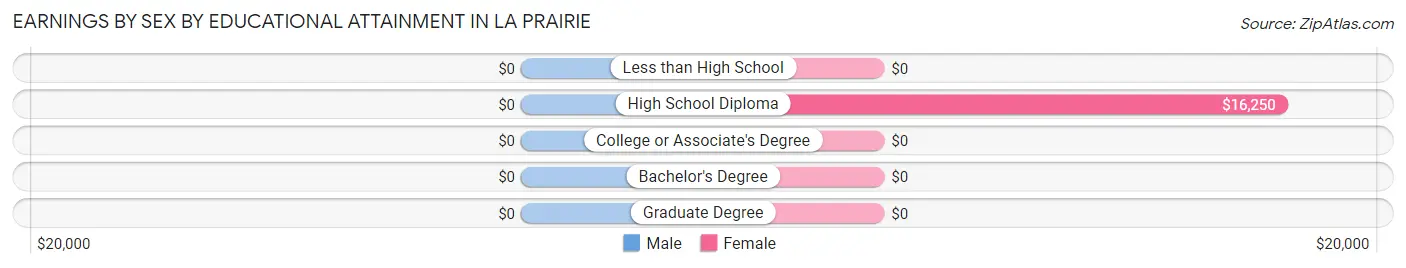
| Educational Attainment | Male Income | Female Income |
| Less than High School | - | - |
| High School Diploma | - | - |
| College or Associate's Degree | - | - |
| Bachelor's Degree | - | - |
| Graduate Degree | - | - |
| Total | - | - |
Family Income in La Prairie
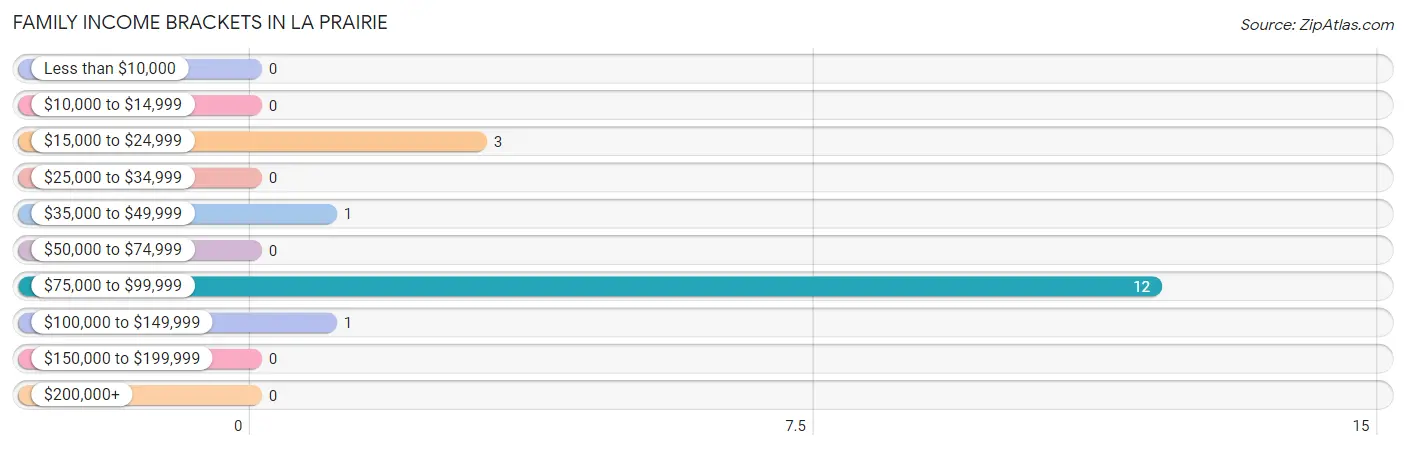
Family Income Brackets in La Prairie
According to the La Prairie family income data, there are 12 families falling into the $75,000 to $99,999 income range, which is the most common income bracket and makes up 70.6% of all families.
| Income Bracket | # Families | % Families |
| Less than $10,000 | 0 | 0.0% |
| $10,000 to $14,999 | 0 | 0.0% |
| $15,000 to $24,999 | 3 | 17.6% |
| $25,000 to $34,999 | 0 | 0.0% |
| $35,000 to $49,999 | 1 | 5.9% |
| $50,000 to $74,999 | 0 | 0.0% |
| $75,000 to $99,999 | 12 | 70.6% |
| $100,000 to $149,999 | 1 | 5.9% |
| $150,000 to $199,999 | 0 | 0.0% |
| $200,000+ | 0 | 0.0% |
Family Income by Famaliy Size in La Prairie
| Income Bracket | # Families | Median Income |
| 2-Person Families | 6 (35.3%) | $0 |
| 3-Person Families | 2 (11.8%) | $0 |
| 4-Person Families | 9 (52.9%) | $0 |
| 5-Person Families | 0 (0.0%) | $0 |
| 6-Person Families | 0 (0.0%) | $0 |
| 7+ Person Families | 0 (0.0%) | $0 |
| Total | 17 (100.0%) | $78,750 |
Family Income by Number of Earners in La Prairie
| Number of Earners | # Families | Median Income |
| No Earners | 3 (17.6%) | $0 |
| 1 Earner | 2 (11.8%) | $0 |
| 2 Earners | 2 (11.8%) | $0 |
| 3+ Earners | 10 (58.8%) | $0 |
| Total | 17 (100.0%) | $78,750 |
Household Income in La Prairie
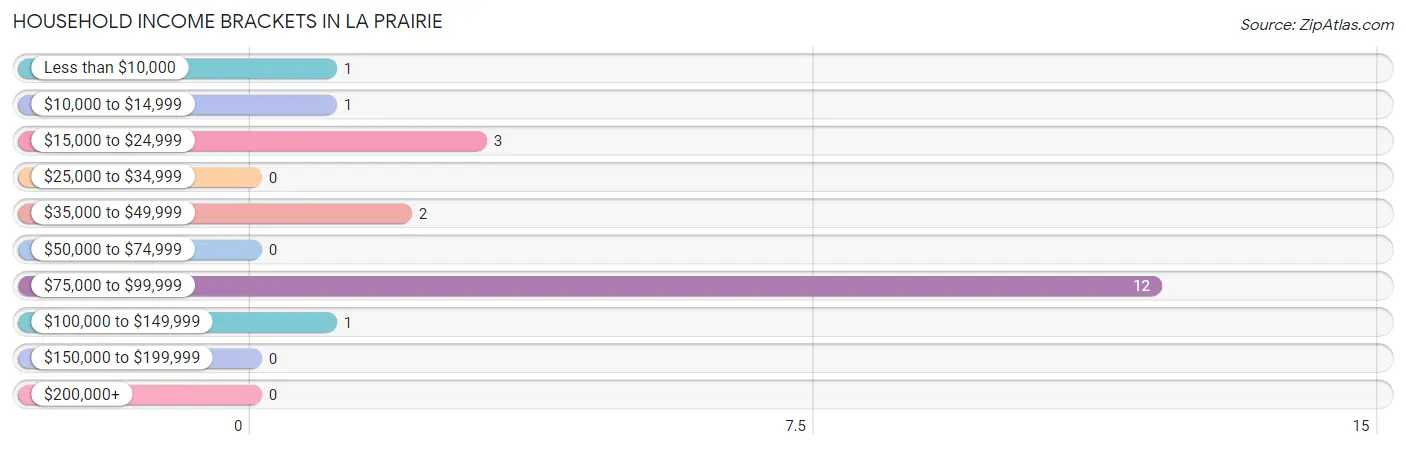
Household Income Brackets in La Prairie
With 12 households falling in the category, the $75,000 to $99,999 income range is the most frequent in La Prairie, accounting for 60.0% of all households.
| Income Bracket | # Households | % Households |
| Less than $10,000 | 1 | 5.0% |
| $10,000 to $14,999 | 1 | 5.0% |
| $15,000 to $24,999 | 3 | 15.0% |
| $25,000 to $34,999 | 0 | 0.0% |
| $35,000 to $49,999 | 2 | 10.0% |
| $50,000 to $74,999 | 0 | 0.0% |
| $75,000 to $99,999 | 12 | 60.0% |
| $100,000 to $149,999 | 1 | 5.0% |
| $150,000 to $199,999 | 0 | 0.0% |
| $200,000+ | 0 | 0.0% |
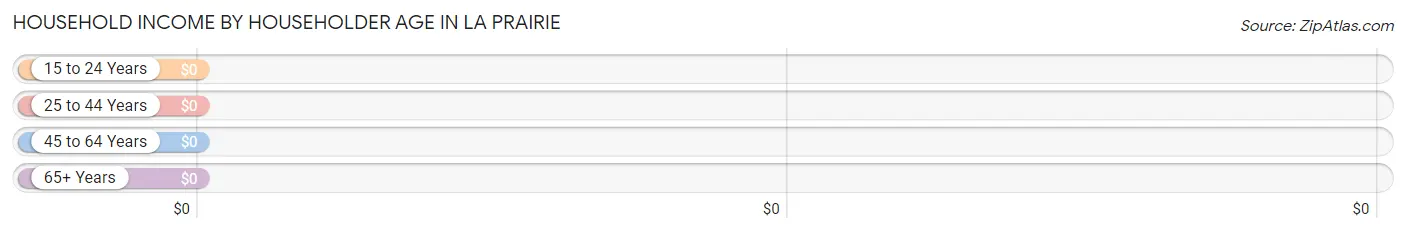
Household Income by Householder Age in La Prairie
| Income Bracket | # Households | Median Income |
| 15 to 24 Years | 0 (0.0%) | $0 |
| 25 to 44 Years | 9 (45.0%) | $0 |
| 45 to 64 Years | 7 (35.0%) | $0 |
| 65+ Years | 4 (20.0%) | $0 |
| Total | 20 (100.0%) | $78,333 |
Poverty in La Prairie
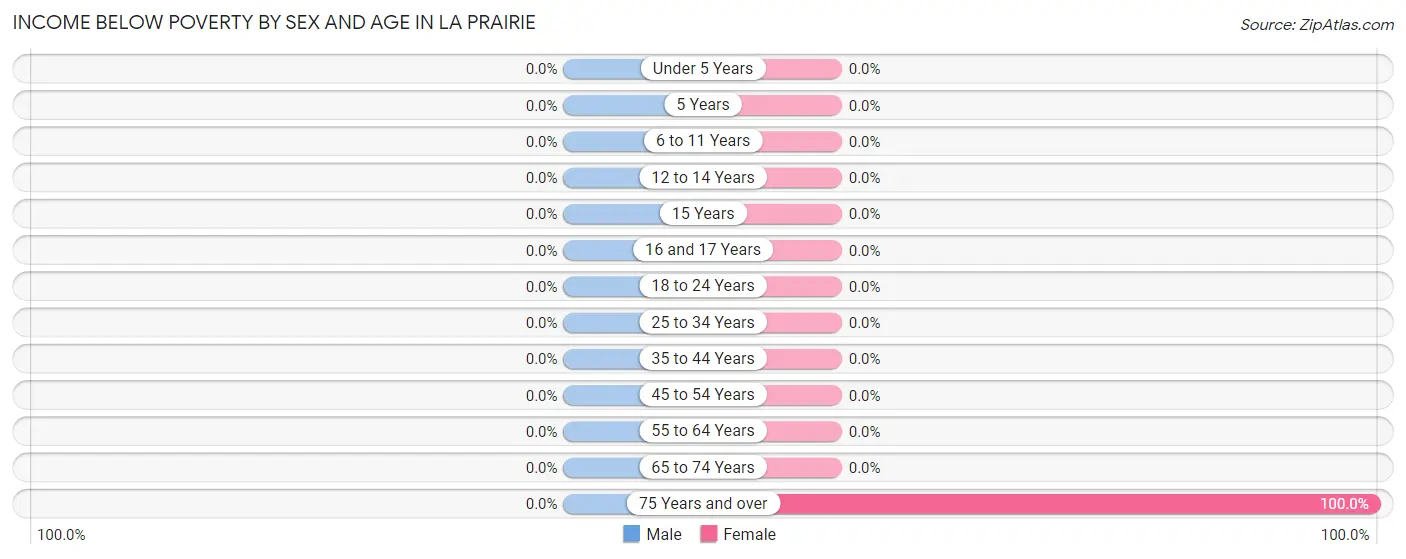
Income Below Poverty by Sex and Age in La Prairie
| Age Bracket | Male | Female |
| Under 5 Years | 0 (0.0%) | 0 (0.0%) |
| 5 Years | 0 (0.0%) | 0 (0.0%) |
| 6 to 11 Years | 0 (0.0%) | 0 (0.0%) |
| 12 to 14 Years | 0 (0.0%) | 0 (0.0%) |
| 15 Years | 0 (0.0%) | 0 (0.0%) |
| 16 and 17 Years | 0 (0.0%) | 0 (0.0%) |
| 18 to 24 Years | 0 (0.0%) | 0 (0.0%) |
| 25 to 34 Years | 0 (0.0%) | 0 (0.0%) |
| 35 to 44 Years | 0 (0.0%) | 0 (0.0%) |
| 45 to 54 Years | 0 (0.0%) | 0 (0.0%) |
| 55 to 64 Years | 0 (0.0%) | 0 (0.0%) |
| 65 to 74 Years | 0 (0.0%) | 0 (0.0%) |
| 75 Years and over | 0 (0.0%) | 1 (100.0%) |
| Total | 0 (0.0%) | 1 (4.0%) |
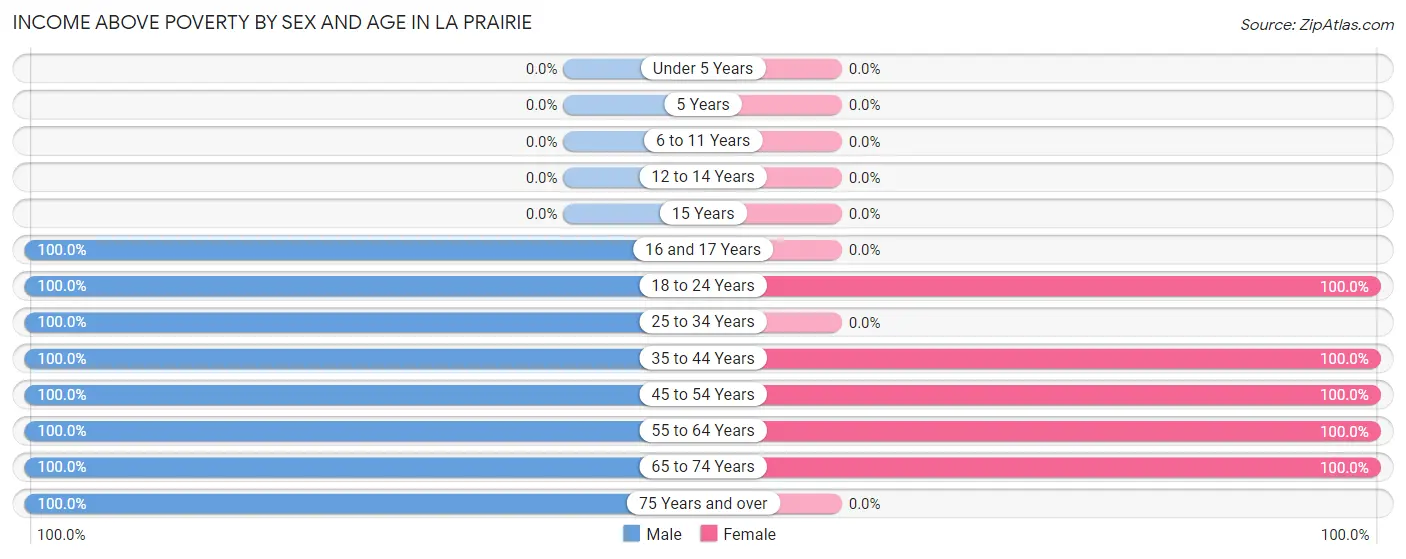
Income Above Poverty by Sex and Age in La Prairie
According to the poverty statistics in La Prairie, males aged 16 and 17 years and females aged 18 to 24 years are the age groups that are most secure financially, with 100.0% of males and 100.0% of females in these age groups living above the poverty line.
| Age Bracket | Male | Female |
| Under 5 Years | 0 (0.0%) | 0 (0.0%) |
| 5 Years | 0 (0.0%) | 0 (0.0%) |
| 6 to 11 Years | 0 (0.0%) | 0 (0.0%) |
| 12 to 14 Years | 0 (0.0%) | 0 (0.0%) |
| 15 Years | 0 (0.0%) | 0 (0.0%) |
| 16 and 17 Years | 11 (100.0%) | 0 (0.0%) |
| 18 to 24 Years | 1 (100.0%) | 5 (100.0%) |
| 25 to 34 Years | 1 (100.0%) | 0 (0.0%) |
| 35 to 44 Years | 4 (100.0%) | 9 (100.0%) |
| 45 to 54 Years | 5 (100.0%) | 6 (100.0%) |
| 55 to 64 Years | 2 (100.0%) | 2 (100.0%) |
| 65 to 74 Years | 1 (100.0%) | 2 (100.0%) |
| 75 Years and over | 1 (100.0%) | 0 (0.0%) |
| Total | 26 (100.0%) | 24 (96.0%) |
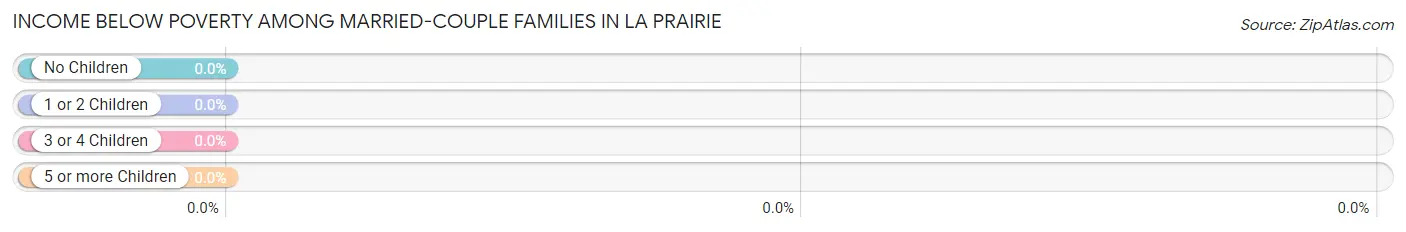
Income Below Poverty Among Married-Couple Families in La Prairie
| Children | Above Poverty | Below Poverty |
| No Children | 8 (100.0%) | 0 (0.0%) |
| 1 or 2 Children | 9 (100.0%) | 0 (0.0%) |
| 3 or 4 Children | 0 (0.0%) | 0 (0.0%) |
| 5 or more Children | 0 (0.0%) | 0 (0.0%) |
| Total | 17 (100.0%) | 0 (0.0%) |
Income Below Poverty Among Single-Parent Households in La Prairie
| Children | Single Father | Single Mother |
| No Children | 0 (0.0%) | 0 (0.0%) |
| 1 or 2 Children | 0 (0.0%) | 0 (0.0%) |
| 3 or 4 Children | 0 (0.0%) | 0 (0.0%) |
| 5 or more Children | 0 (0.0%) | 0 (0.0%) |
| Total | 0 (0.0%) | 0 (0.0%) |
Income Below Poverty Among Married-Couple vs Single-Parent Households in La Prairie
| Children | Married-Couple Families | Single-Parent Households |
| No Children | 0 (0.0%) | 0 (0.0%) |
| 1 or 2 Children | 0 (0.0%) | 0 (0.0%) |
| 3 or 4 Children | 0 (0.0%) | 0 (0.0%) |
| 5 or more Children | 0 (0.0%) | 0 (0.0%) |
| Total | 0 (0.0%) | 0 (0.0%) |
Race in La Prairie
The most populous races in La Prairie are White / Caucasian (50 | 98.0%), and Two or more Races (1 | 2.0%).
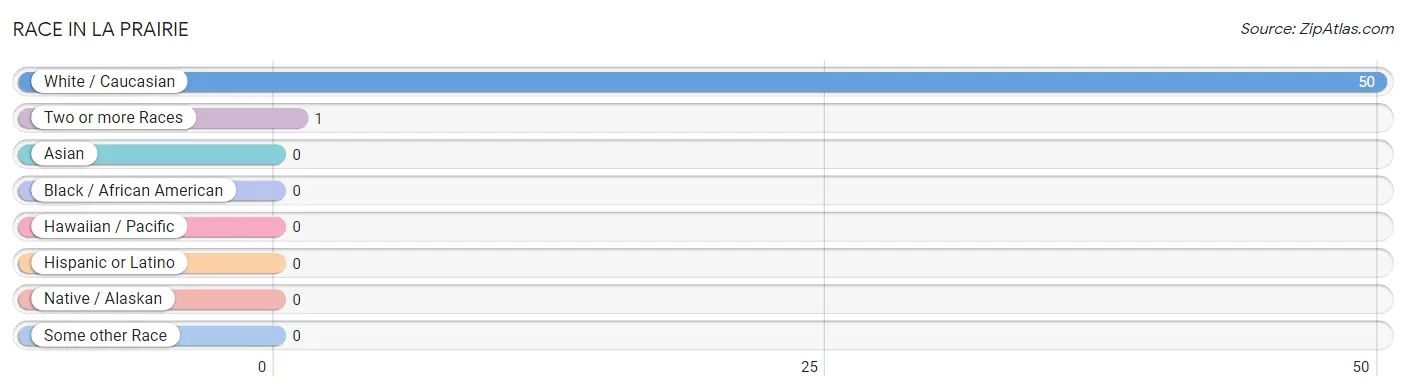
| Race | # Population | % Population |
| Asian | 0 | 0.0% |
| Black / African American | 0 | 0.0% |
| Hawaiian / Pacific | 0 | 0.0% |
| Hispanic or Latino | 0 | 0.0% |
| Native / Alaskan | 0 | 0.0% |
| White / Caucasian | 50 | 98.0% |
| Two or more Races | 1 | 2.0% |
| Some other Race | 0 | 0.0% |
| Total | 51 | 100.0% |
Ancestry in La Prairie
The most populous ancestries reported in La Prairie are German (5 | 9.8%), Dutch (2 | 3.9%), Irish (2 | 3.9%), Scotch-Irish (2 | 3.9%), and Creek (1 | 2.0%), together accounting for 23.5% of all La Prairie residents.
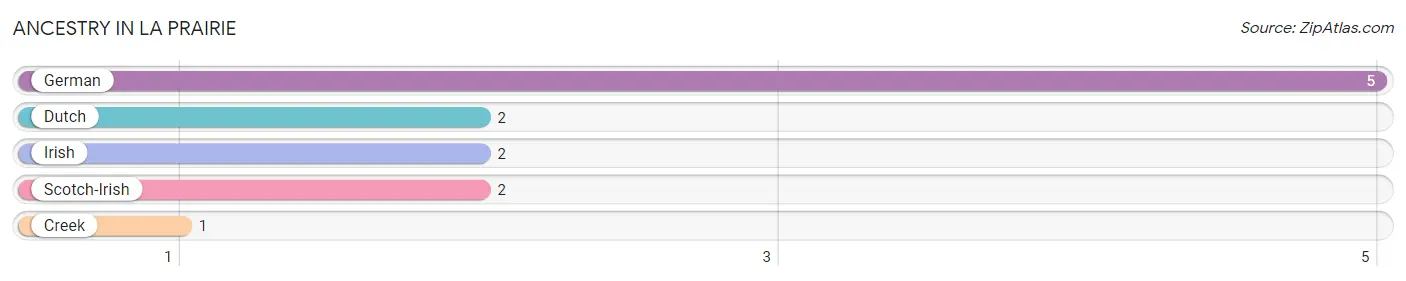
| Ancestry | # Population | % Population |
| Creek | 1 | 2.0% |
| Dutch | 2 | 3.9% |
| German | 5 | 9.8% |
| Irish | 2 | 3.9% |
| Scotch-Irish | 2 | 3.9% | View All 5 Rows |
Immigrants in La Prairie

| Immigration Origin | # Population | % Population | View All 0 Rows |
Sex and Age in La Prairie
Sex and Age in La Prairie
The most populous age groups in La Prairie are 15 to 19 Years (11 | 42.3%) for men and 40 to 44 Years (9 | 36.0%) for women.
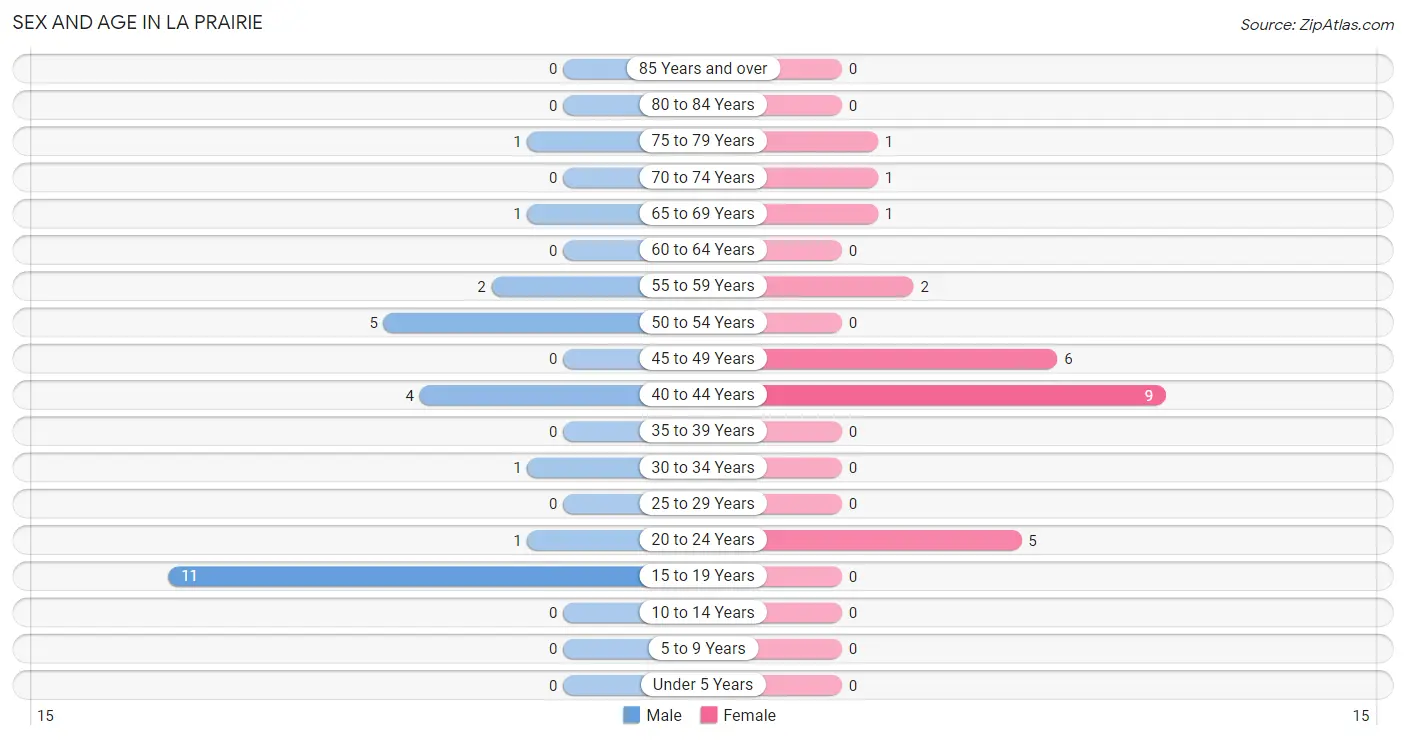
| Age Bracket | Male | Female |
| Under 5 Years | 0 (0.0%) | 0 (0.0%) |
| 5 to 9 Years | 0 (0.0%) | 0 (0.0%) |
| 10 to 14 Years | 0 (0.0%) | 0 (0.0%) |
| 15 to 19 Years | 11 (42.3%) | 0 (0.0%) |
| 20 to 24 Years | 1 (3.8%) | 5 (20.0%) |
| 25 to 29 Years | 0 (0.0%) | 0 (0.0%) |
| 30 to 34 Years | 1 (3.8%) | 0 (0.0%) |
| 35 to 39 Years | 0 (0.0%) | 0 (0.0%) |
| 40 to 44 Years | 4 (15.4%) | 9 (36.0%) |
| 45 to 49 Years | 0 (0.0%) | 6 (24.0%) |
| 50 to 54 Years | 5 (19.2%) | 0 (0.0%) |
| 55 to 59 Years | 2 (7.7%) | 2 (8.0%) |
| 60 to 64 Years | 0 (0.0%) | 0 (0.0%) |
| 65 to 69 Years | 1 (3.8%) | 1 (4.0%) |
| 70 to 74 Years | 0 (0.0%) | 1 (4.0%) |
| 75 to 79 Years | 1 (3.8%) | 1 (4.0%) |
| 80 to 84 Years | 0 (0.0%) | 0 (0.0%) |
| 85 Years and over | 0 (0.0%) | 0 (0.0%) |
| Total | 26 (100.0%) | 25 (100.0%) |
Families and Households in La Prairie
Median Family Size in La Prairie
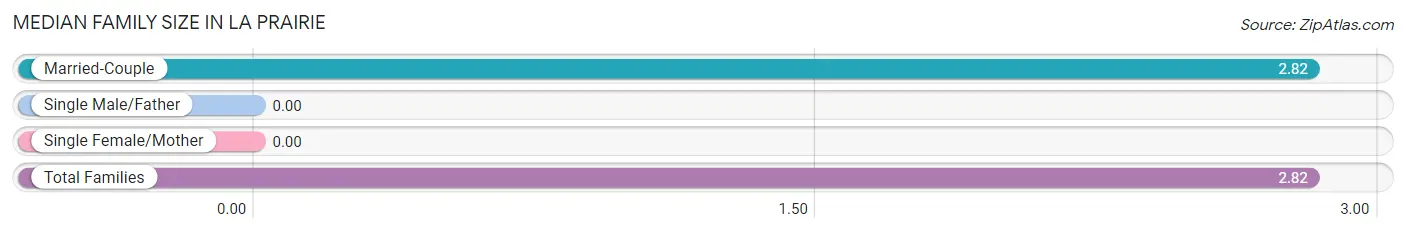
| Family Type | # Families | Family Size |
| Married-Couple | 17 (100.0%) | 2.82 |
| Single Male/Father | 0 (0.0%) | - |
| Single Female/Mother | 0 (0.0%) | - |
| Total Families | 17 (100.0%) | 2.82 |
Median Household Size in La Prairie
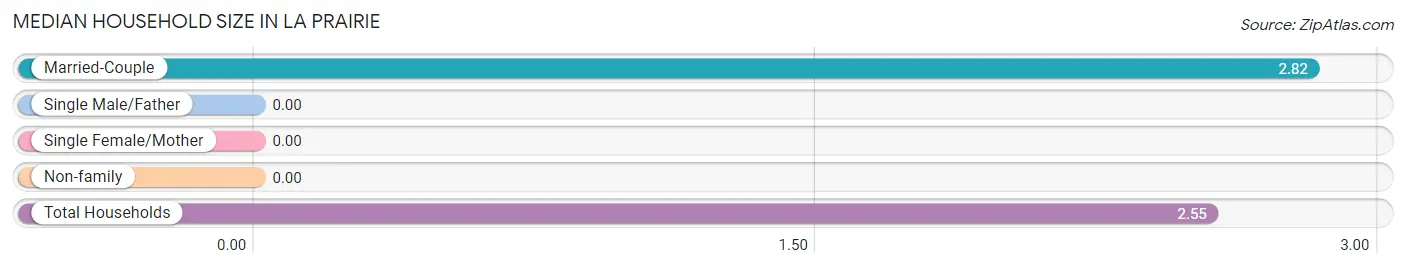
| Household Type | # Households | Household Size |
| Married-Couple | 17 (85.0%) | 2.82 |
| Single Male/Father | 0 (0.0%) | - |
| Single Female/Mother | 0 (0.0%) | - |
| Non-family | 3 (15.0%) | - |
| Total Households | 20 (100.0%) | 2.55 |
Household Size by Marriage Status in La Prairie
Out of a total of 20 households in La Prairie, 17 (85.0%) are family households, while 3 (15.0%) are nonfamily households. The most numerous type of family households are 4-person households, comprising 9, and the most common type of nonfamily households are 1-person households, comprising 3.
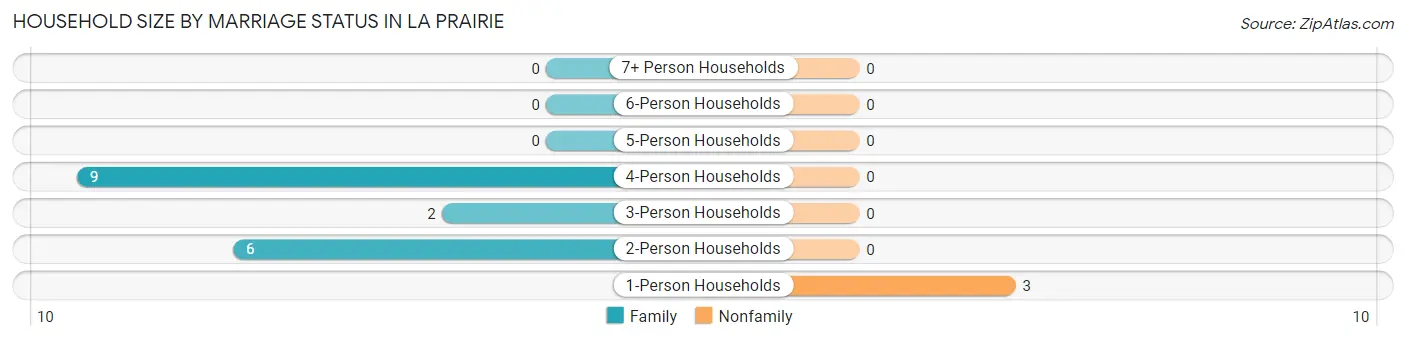
| Household Size | Family Households | Nonfamily Households |
| 1-Person Households | - | 3 (15.0%) |
| 2-Person Households | 6 (30.0%) | 0 (0.0%) |
| 3-Person Households | 2 (10.0%) | 0 (0.0%) |
| 4-Person Households | 9 (45.0%) | 0 (0.0%) |
| 5-Person Households | 0 (0.0%) | 0 (0.0%) |
| 6-Person Households | 0 (0.0%) | 0 (0.0%) |
| 7+ Person Households | 0 (0.0%) | 0 (0.0%) |
| Total | 17 (85.0%) | 3 (15.0%) |
Female Fertility in La Prairie
Fertility by Age in La Prairie
| Age Bracket | Women with Births | Births / 1,000 Women |
| 15 to 19 years | 0 (0.0%) | 0.0 |
| 20 to 34 years | 0 (0.0%) | 0.0 |
| 35 to 50 years | 0 (0.0%) | 0.0 |
| Total | 0 (0.0%) | 0.0 |
Fertility by Age by Marriage Status in La Prairie
| Age Bracket | Married | Unmarried |
| 15 to 19 years | 0 (0.0%) | 0 (0.0%) |
| 20 to 34 years | 0 (0.0%) | 0 (0.0%) |
| 35 to 50 years | 0 (0.0%) | 0 (0.0%) |
| Total | 0 (0.0%) | 0 (0.0%) |
Fertility by Education in La Prairie
| Educational Attainment | Women with Births | Births / 1,000 Women |
| Less than High School | 0 (0.0%) | 0.0 |
| High School Diploma | 0 (0.0%) | 0.0 |
| College or Associate's Degree | 0 (0.0%) | 0.0 |
| Bachelor's Degree | 0 (0.0%) | 0.0 |
| Graduate Degree | 0 (0.0%) | 0.0 |
| Total | 0 (0.0%) | 0.0 |
Fertility by Education by Marriage Status in La Prairie
| Educational Attainment | Married | Unmarried |
| Less than High School | 0 (0.0%) | 0 (0.0%) |
| High School Diploma | 0 (0.0%) | 0 (0.0%) |
| College or Associate's Degree | 0 (0.0%) | 0 (0.0%) |
| Bachelor's Degree | 0 (0.0%) | 0 (0.0%) |
| Graduate Degree | 0 (0.0%) | 0 (0.0%) |
| Total | 0 (0.0%) | 0 (0.0%) |
Employment Characteristics in La Prairie
Employment by Class of Employer in La Prairie
Among the 16 employed individuals in La Prairie, private company employees (8 | 50.0%), not-for-profit organizations (6 | 37.5%), and state government employees (1 | 6.2%) make up the most common classes of employment.
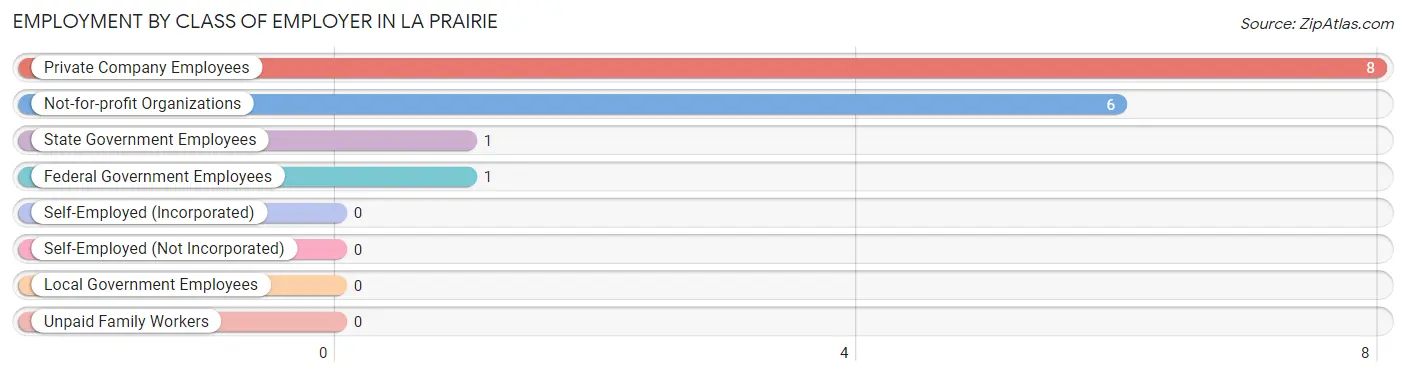
| Employer Class | # Employees | % Employees |
| Private Company Employees | 8 | 50.0% |
| Self-Employed (Incorporated) | 0 | 0.0% |
| Self-Employed (Not Incorporated) | 0 | 0.0% |
| Not-for-profit Organizations | 6 | 37.5% |
| Local Government Employees | 0 | 0.0% |
| State Government Employees | 1 | 6.2% |
| Federal Government Employees | 1 | 6.2% |
| Unpaid Family Workers | 0 | 0.0% |
| Total | 16 | 100.0% |
Employment Status by Age in La Prairie
According to the labor force statistics for La Prairie, out of the total population over 16 years of age (51), 39.2% or 20 individuals are in the labor force, with 20.0% or 4 of them unemployed. The age group with the highest labor force participation rate is 20 to 24 years, with 100.0% or 6 individuals in the labor force. Within the labor force, the 35 to 44 years age range has the highest percentage of unemployed individuals, with 100.0% or 4 of them being unemployed.
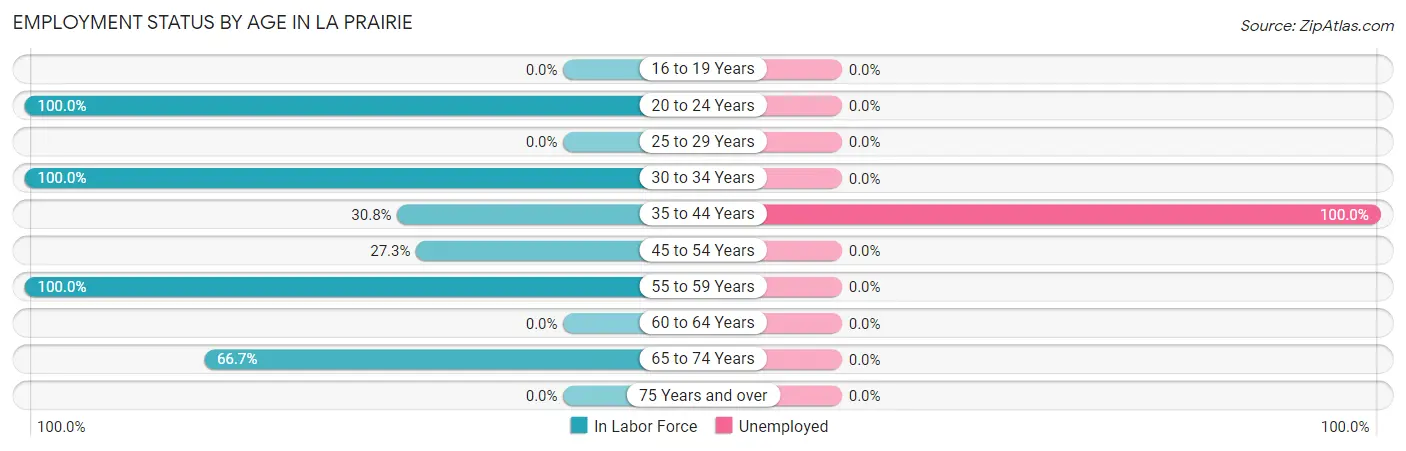
| Age Bracket | In Labor Force | Unemployed |
| 16 to 19 Years | 0 (0.0%) | 0 (0.0%) |
| 20 to 24 Years | 6 (100.0%) | 0 (0.0%) |
| 25 to 29 Years | 0 (0.0%) | 0 (0.0%) |
| 30 to 34 Years | 1 (100.0%) | 0 (0.0%) |
| 35 to 44 Years | 4 (30.8%) | 4 (100.0%) |
| 45 to 54 Years | 3 (27.3%) | 0 (0.0%) |
| 55 to 59 Years | 4 (100.0%) | 0 (0.0%) |
| 60 to 64 Years | 0 (0.0%) | 0 (0.0%) |
| 65 to 74 Years | 2 (66.7%) | 0 (0.0%) |
| 75 Years and over | 0 (0.0%) | 0 (0.0%) |
| Total | 20 (39.2%) | 4 (20.0%) |
Employment Status by Educational Attainment in La Prairie
According to labor force statistics for La Prairie, 41.4% of individuals (12) out of the total population between 25 and 64 years of age (29) are in the labor force, with 33.3% or 4 of them being unemployed. The group with the highest labor force participation rate are those with the educational attainment of less than high school, with 61.5% or 8 individuals in the labor force. Within the labor force, individuals with less than high school education have the highest percentage of unemployment, with 50.0% or 4 of them being unemployed.
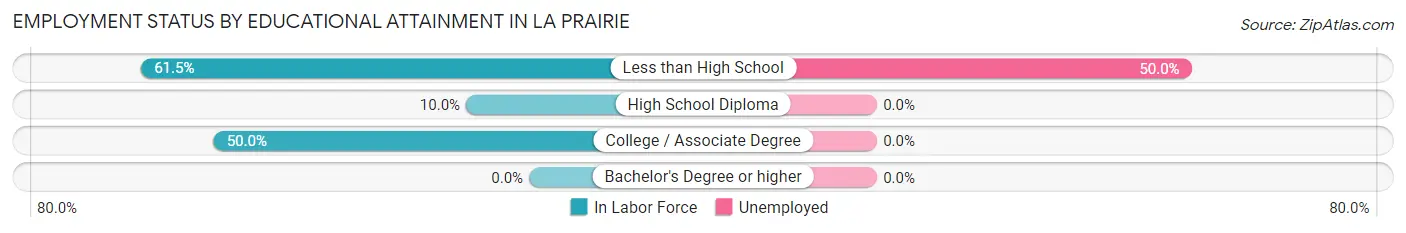
| Educational Attainment | In Labor Force | Unemployed |
| Less than High School | 8 (61.5%) | 6 (50.0%) |
| High School Diploma | 1 (10.0%) | 0 (0.0%) |
| College / Associate Degree | 3 (50.0%) | 0 (0.0%) |
| Bachelor's Degree or higher | 0 (0.0%) | 0 (0.0%) |
| Total | 12 (41.4%) | 10 (33.3%) |
Employment Occupations by Sex in La Prairie
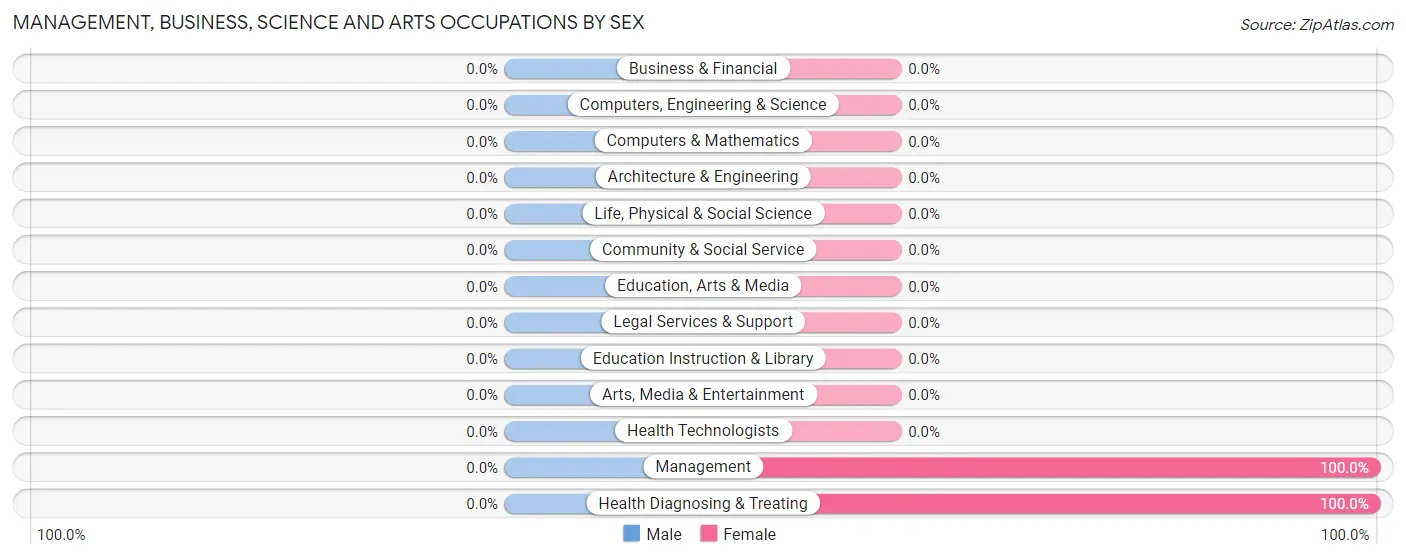
Management, Business, Science and Arts Occupations
The most common Management, Business, Science and Arts occupations in La Prairie are Management (5 | 31.2%), and Health Diagnosing & Treating (3 | 18.8%).
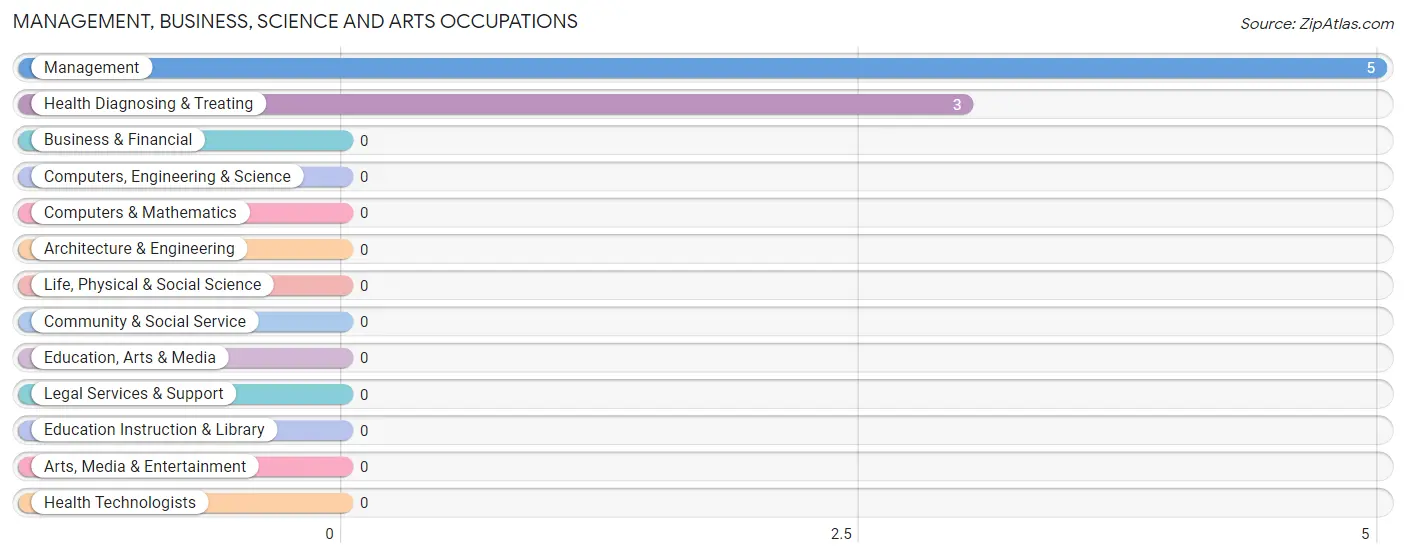
Management, Business, Science and Arts Occupations by Sex
| Occupation | Male | Female |
| Management | 0 (0.0%) | 5 (100.0%) |
| Business & Financial | 0 (0.0%) | 0 (0.0%) |
| Computers, Engineering & Science | 0 (0.0%) | 0 (0.0%) |
| Computers & Mathematics | 0 (0.0%) | 0 (0.0%) |
| Architecture & Engineering | 0 (0.0%) | 0 (0.0%) |
| Life, Physical & Social Science | 0 (0.0%) | 0 (0.0%) |
| Community & Social Service | 0 (0.0%) | 0 (0.0%) |
| Education, Arts & Media | 0 (0.0%) | 0 (0.0%) |
| Legal Services & Support | 0 (0.0%) | 0 (0.0%) |
| Education Instruction & Library | 0 (0.0%) | 0 (0.0%) |
| Arts, Media & Entertainment | 0 (0.0%) | 0 (0.0%) |
| Health Diagnosing & Treating | 0 (0.0%) | 3 (100.0%) |
| Health Technologists | 0 (0.0%) | 0 (0.0%) |
| Total (Category) | 0 (0.0%) | 8 (100.0%) |
| Total (Overall) | 7 (43.8%) | 9 (56.2%) |
Services Occupations
Services Occupations by Sex
| Occupation | Male | Female |
| Healthcare Support | 0 (0.0%) | 0 (0.0%) |
| Security & Protection | 0 (0.0%) | 0 (0.0%) |
| Firefighting & Prevention | 0 (0.0%) | 0 (0.0%) |
| Law Enforcement | 0 (0.0%) | 0 (0.0%) |
| Food Preparation & Serving | 0 (0.0%) | 0 (0.0%) |
| Cleaning & Maintenance | 0 (0.0%) | 0 (0.0%) |
| Personal Care & Service | 0 (0.0%) | 0 (0.0%) |
| Total (Category) | 0 (0.0%) | 0 (0.0%) |
| Total (Overall) | 7 (43.8%) | 9 (56.2%) |
Sales and Office Occupations
The most common Sales and Office occupations in La Prairie are Sales & Related (1 | 6.2%), and Office & Administration (1 | 6.2%).

Sales and Office Occupations by Sex

| Occupation | Male | Female |
| Sales & Related | 0 (0.0%) | 1 (100.0%) |
| Office & Administration | 1 (100.0%) | 0 (0.0%) |
| Total (Category) | 1 (50.0%) | 1 (50.0%) |
| Total (Overall) | 7 (43.8%) | 9 (56.2%) |
Natural Resources, Construction and Maintenance Occupations
The most common Natural Resources, Construction and Maintenance occupations in La Prairie are Installation, Maintenance & Repair (2 | 12.5%), and Construction & Extraction (1 | 6.2%).
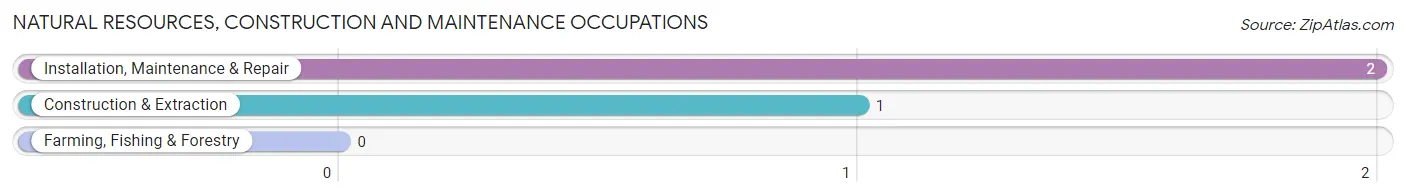
Natural Resources, Construction and Maintenance Occupations by Sex
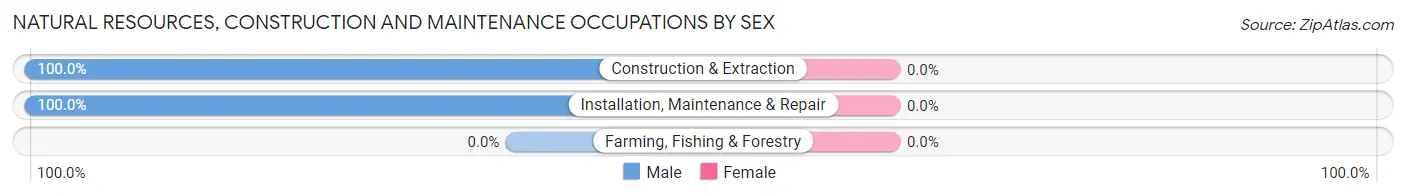
| Occupation | Male | Female |
| Farming, Fishing & Forestry | 0 (0.0%) | 0 (0.0%) |
| Construction & Extraction | 1 (100.0%) | 0 (0.0%) |
| Installation, Maintenance & Repair | 2 (100.0%) | 0 (0.0%) |
| Total (Category) | 3 (100.0%) | 0 (0.0%) |
| Total (Overall) | 7 (43.8%) | 9 (56.2%) |
Production, Transportation and Moving Occupations
The most common Production, Transportation and Moving occupations in La Prairie are Transportation (2 | 12.5%), and Material Moving (1 | 6.2%).
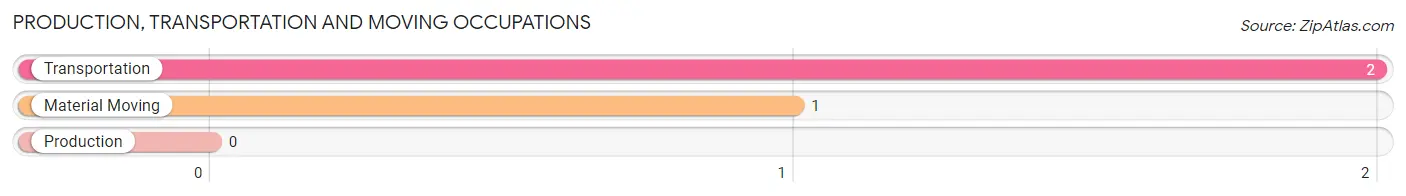
Production, Transportation and Moving Occupations by Sex
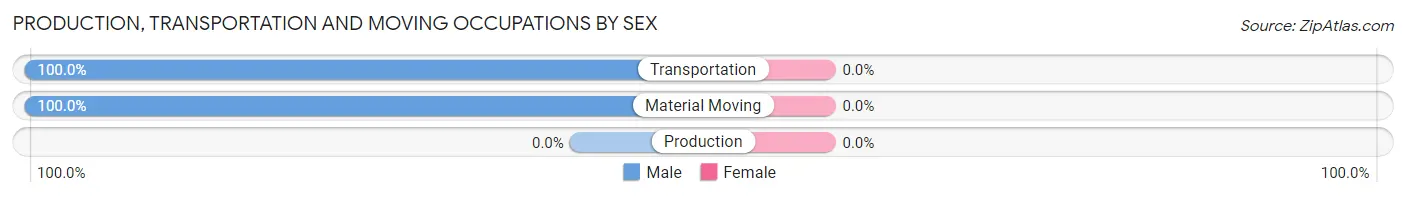
| Occupation | Male | Female |
| Production | 0 (0.0%) | 0 (0.0%) |
| Transportation | 2 (100.0%) | 0 (0.0%) |
| Material Moving | 1 (100.0%) | 0 (0.0%) |
| Total (Category) | 3 (100.0%) | 0 (0.0%) |
| Total (Overall) | 7 (43.8%) | 9 (56.2%) |
Employment Industries by Sex in La Prairie
Employment Industries in La Prairie
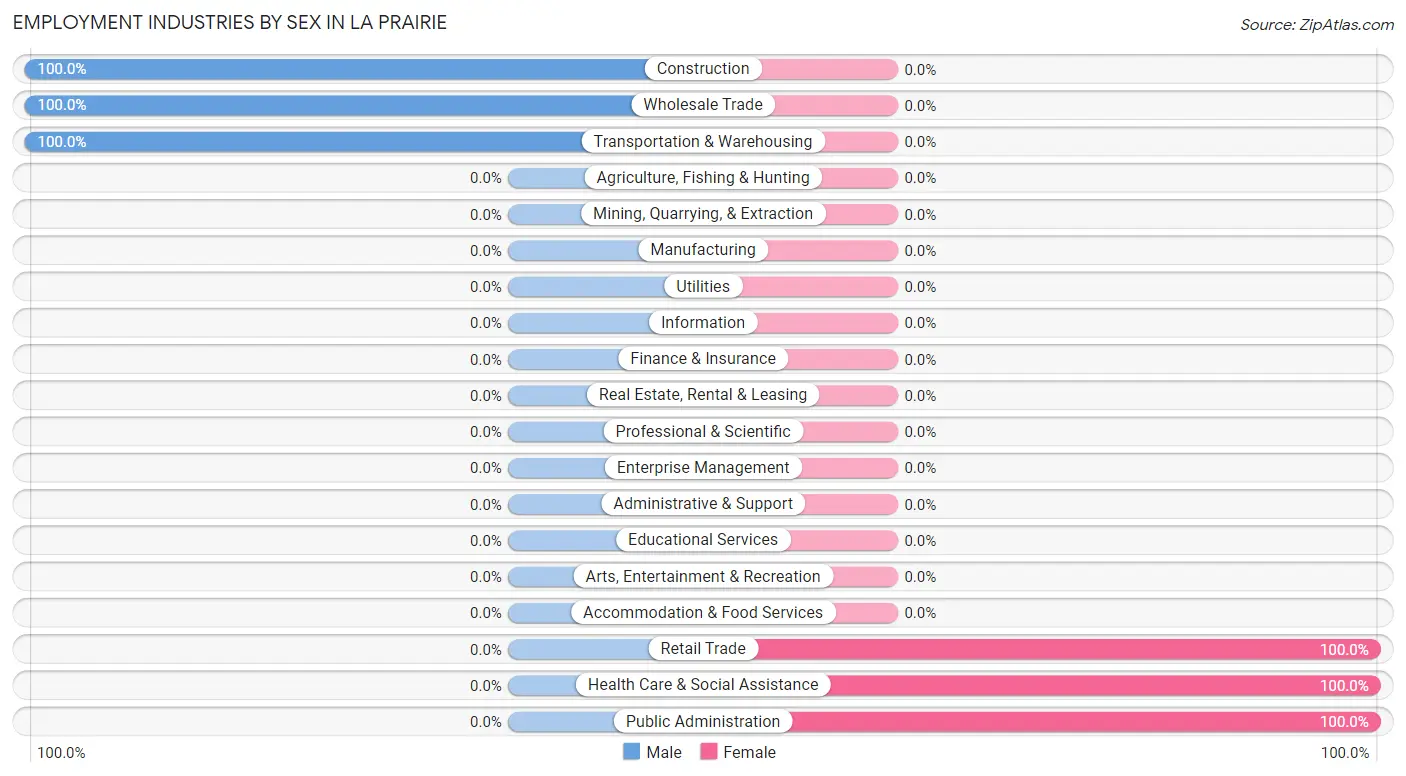
The major employment industries in La Prairie include Wholesale Trade (3 | 18.8%), Health Care & Social Assistance (2 | 12.5%), Construction (1 | 6.2%), Retail Trade (1 | 6.2%), and Transportation & Warehousing (1 | 6.2%).
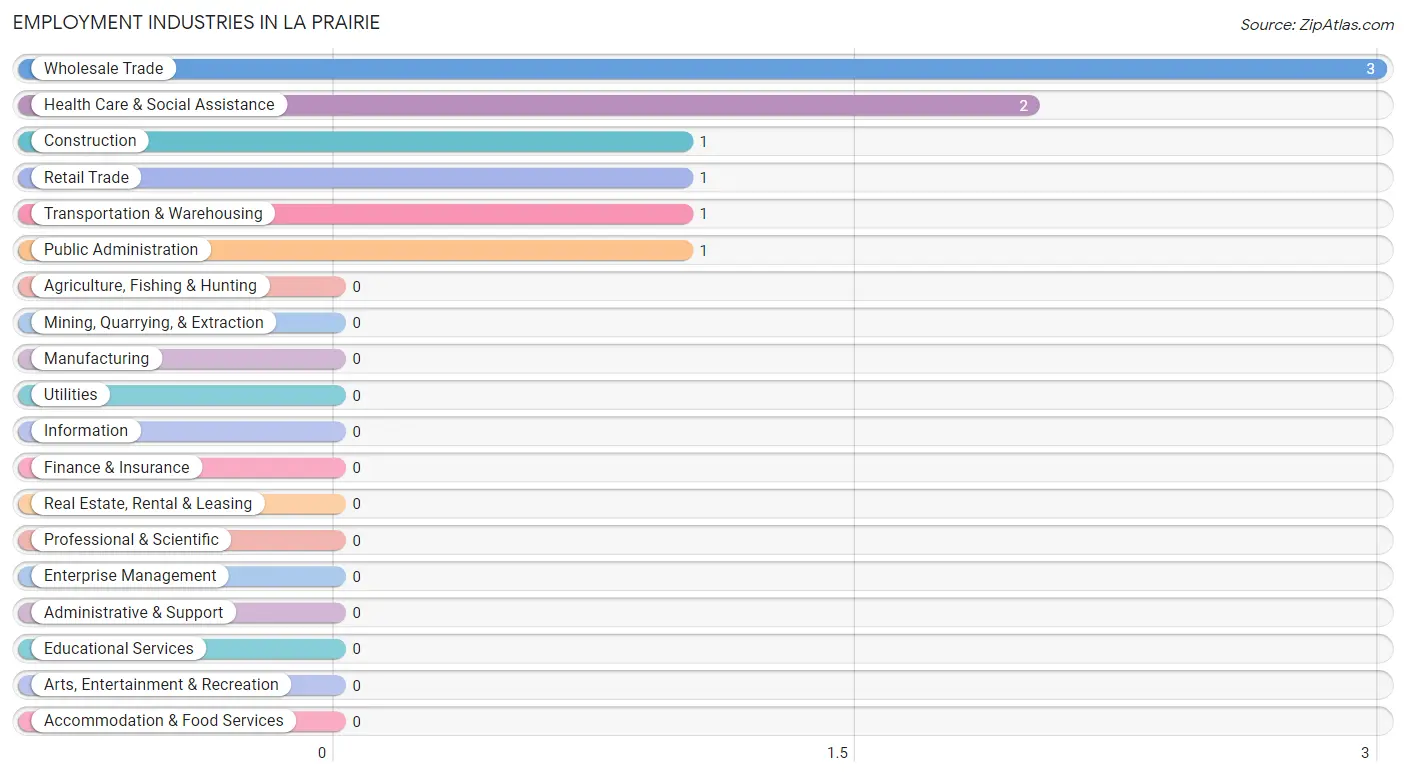
Employment Industries by Sex in La Prairie
The La Prairie industries that see more men than women are Construction (100.0%), Wholesale Trade (100.0%), and Transportation & Warehousing (100.0%), whereas the industries that tend to have a higher number of women are Retail Trade (100.0%), Health Care & Social Assistance (100.0%), and Public Administration (100.0%).
| Industry | Male | Female |
| Agriculture, Fishing & Hunting | 0 (0.0%) | 0 (0.0%) |
| Mining, Quarrying, & Extraction | 0 (0.0%) | 0 (0.0%) |
| Construction | 1 (100.0%) | 0 (0.0%) |
| Manufacturing | 0 (0.0%) | 0 (0.0%) |
| Wholesale Trade | 3 (100.0%) | 0 (0.0%) |
| Retail Trade | 0 (0.0%) | 1 (100.0%) |
| Transportation & Warehousing | 1 (100.0%) | 0 (0.0%) |
| Utilities | 0 (0.0%) | 0 (0.0%) |
| Information | 0 (0.0%) | 0 (0.0%) |
| Finance & Insurance | 0 (0.0%) | 0 (0.0%) |
| Real Estate, Rental & Leasing | 0 (0.0%) | 0 (0.0%) |
| Professional & Scientific | 0 (0.0%) | 0 (0.0%) |
| Enterprise Management | 0 (0.0%) | 0 (0.0%) |
| Administrative & Support | 0 (0.0%) | 0 (0.0%) |
| Educational Services | 0 (0.0%) | 0 (0.0%) |
| Health Care & Social Assistance | 0 (0.0%) | 2 (100.0%) |
| Arts, Entertainment & Recreation | 0 (0.0%) | 0 (0.0%) |
| Accommodation & Food Services | 0 (0.0%) | 0 (0.0%) |
| Public Administration | 0 (0.0%) | 1 (100.0%) |
| Total | 7 (43.8%) | 9 (56.2%) |
Education in La Prairie
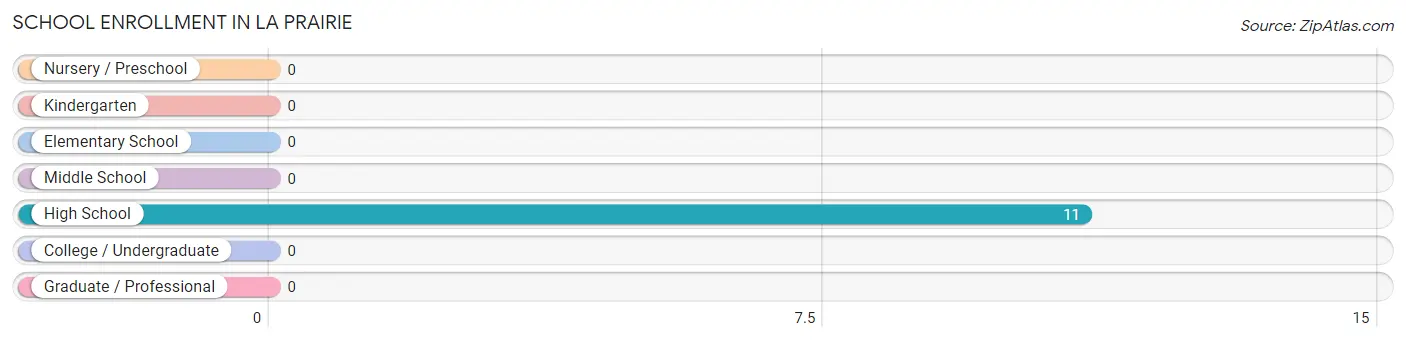
School Enrollment in La Prairie
| School Level | # Students | % Students |
| Nursery / Preschool | 0 | 0.0% |
| Kindergarten | 0 | 0.0% |
| Elementary School | 0 | 0.0% |
| Middle School | 0 | 0.0% |
| High School | 11 | 100.0% |
| College / Undergraduate | 0 | 0.0% |
| Graduate / Professional | 0 | 0.0% |
| Total | 11 | 100.0% |
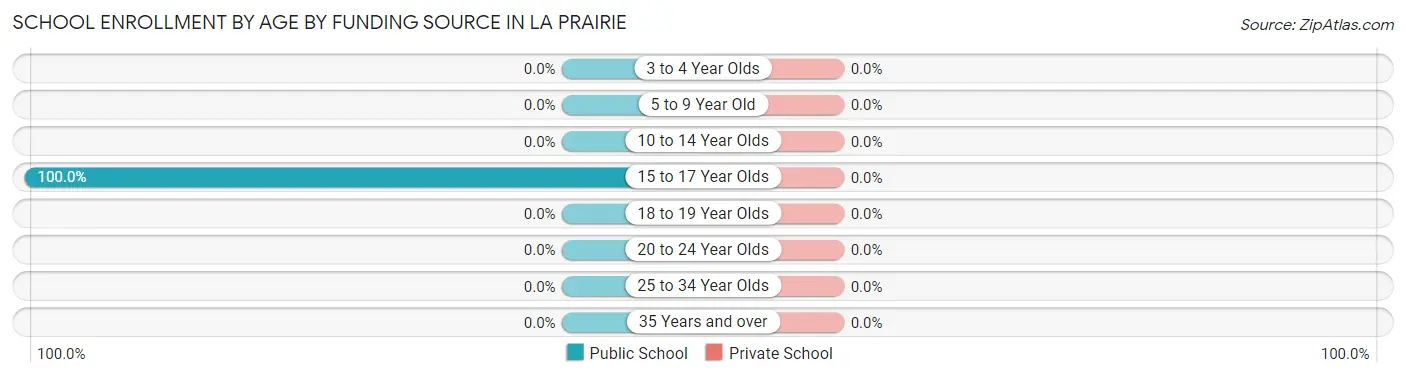
School Enrollment by Age by Funding Source in La Prairie
| Age Bracket | Public School | Private School |
| 3 to 4 Year Olds | 0 (0.0%) | 0 (0.0%) |
| 5 to 9 Year Old | 0 (0.0%) | 0 (0.0%) |
| 10 to 14 Year Olds | 0 (0.0%) | 0 (0.0%) |
| 15 to 17 Year Olds | 11 (100.0%) | 0 (0.0%) |
| 18 to 19 Year Olds | 0 (0.0%) | 0 (0.0%) |
| 20 to 24 Year Olds | 0 (0.0%) | 0 (0.0%) |
| 25 to 34 Year Olds | 0 (0.0%) | 0 (0.0%) |
| 35 Years and over | 0 (0.0%) | 0 (0.0%) |
| Total | 11 (100.0%) | 0 (0.0%) |
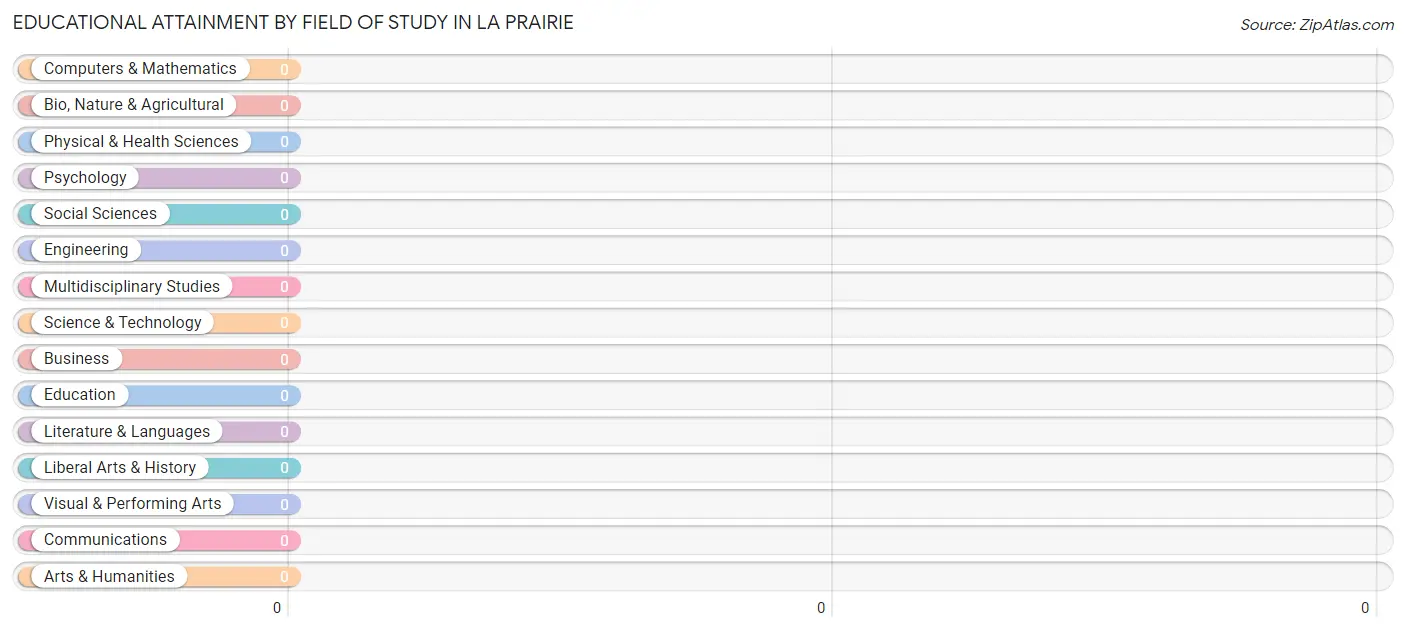
Educational Attainment by Field of Study in La Prairie
| Field of Study | # Graduates | % Graduates |
| Computers & Mathematics | 0 | 0.0% |
| Bio, Nature & Agricultural | 0 | 0.0% |
| Physical & Health Sciences | 0 | 0.0% |
| Psychology | 0 | 0.0% |
| Social Sciences | 0 | 0.0% |
| Engineering | 0 | 0.0% |
| Multidisciplinary Studies | 0 | 0.0% |
| Science & Technology | 0 | 0.0% |
| Business | 0 | 0.0% |
| Education | 0 | 0.0% |
| Literature & Languages | 0 | 0.0% |
| Liberal Arts & History | 0 | 0.0% |
| Visual & Performing Arts | 0 | 0.0% |
| Communications | 0 | 0.0% |
| Arts & Humanities | 0 | 0.0% |
| Total | 0 | 0.0% |
Transportation & Commute in La Prairie
Vehicle Availability by Sex in La Prairie
The most prevalent vehicle ownership categories in La Prairie are males with 4 vehicles (3, accounting for 42.9%) and females with 4 vehicles (7, making up 33.3%).
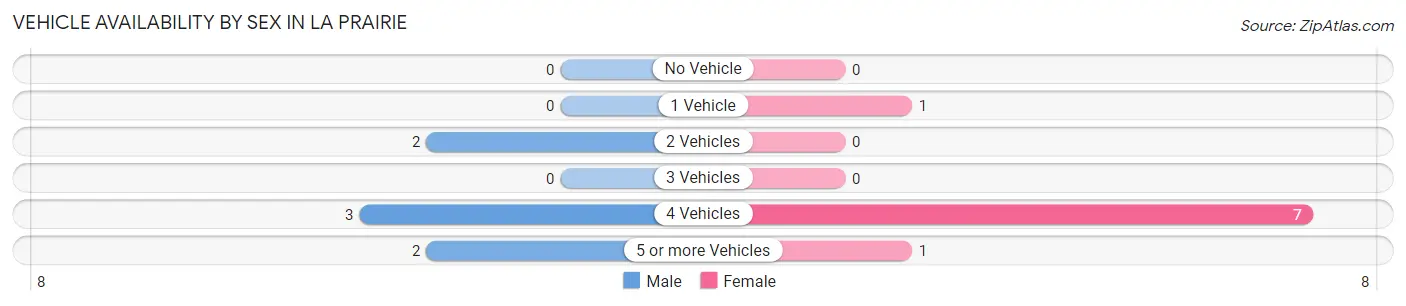
| Vehicles Available | Male | Female |
| No Vehicle | 0 (0.0%) | 0 (0.0%) |
| 1 Vehicle | 0 (0.0%) | 1 (11.1%) |
| 2 Vehicles | 2 (28.6%) | 0 (0.0%) |
| 3 Vehicles | 0 (0.0%) | 0 (0.0%) |
| 4 Vehicles | 3 (42.9%) | 7 (77.8%) |
| 5 or more Vehicles | 2 (28.6%) | 1 (11.1%) |
| Total | 7 (100.0%) | 9 (100.0%) |
Commute Time in La Prairie
The most frequently occuring commute durations in La Prairie are 30 to 34 minutes (6 commuters, 37.5%), 40 to 44 minutes (5 commuters, 31.2%), and 90 or more minutes (2 commuters, 12.5%).
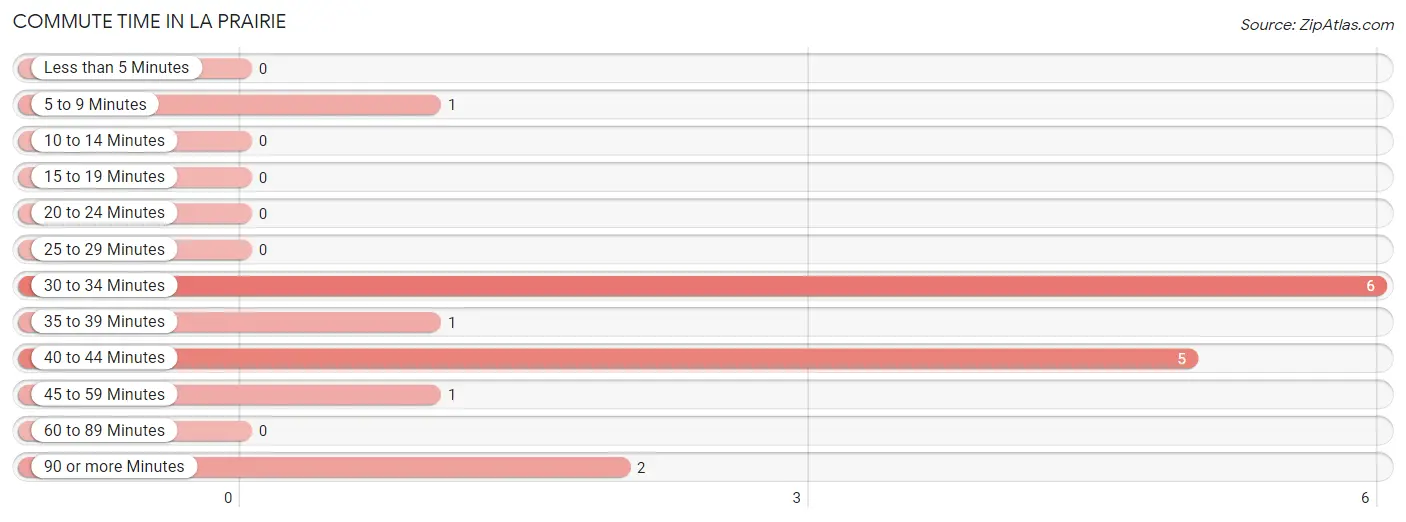
| Commute Time | # Commuters | % Commuters |
| Less than 5 Minutes | 0 | 0.0% |
| 5 to 9 Minutes | 1 | 6.2% |
| 10 to 14 Minutes | 0 | 0.0% |
| 15 to 19 Minutes | 0 | 0.0% |
| 20 to 24 Minutes | 0 | 0.0% |
| 25 to 29 Minutes | 0 | 0.0% |
| 30 to 34 Minutes | 6 | 37.5% |
| 35 to 39 Minutes | 1 | 6.2% |
| 40 to 44 Minutes | 5 | 31.2% |
| 45 to 59 Minutes | 1 | 6.2% |
| 60 to 89 Minutes | 0 | 0.0% |
| 90 or more Minutes | 2 | 12.5% |
Commute Time by Sex in La Prairie
The most common commute times in La Prairie are 40 to 44 minutes (3 commuters, 42.9%) for males and 30 to 34 minutes (5 commuters, 55.6%) for females.
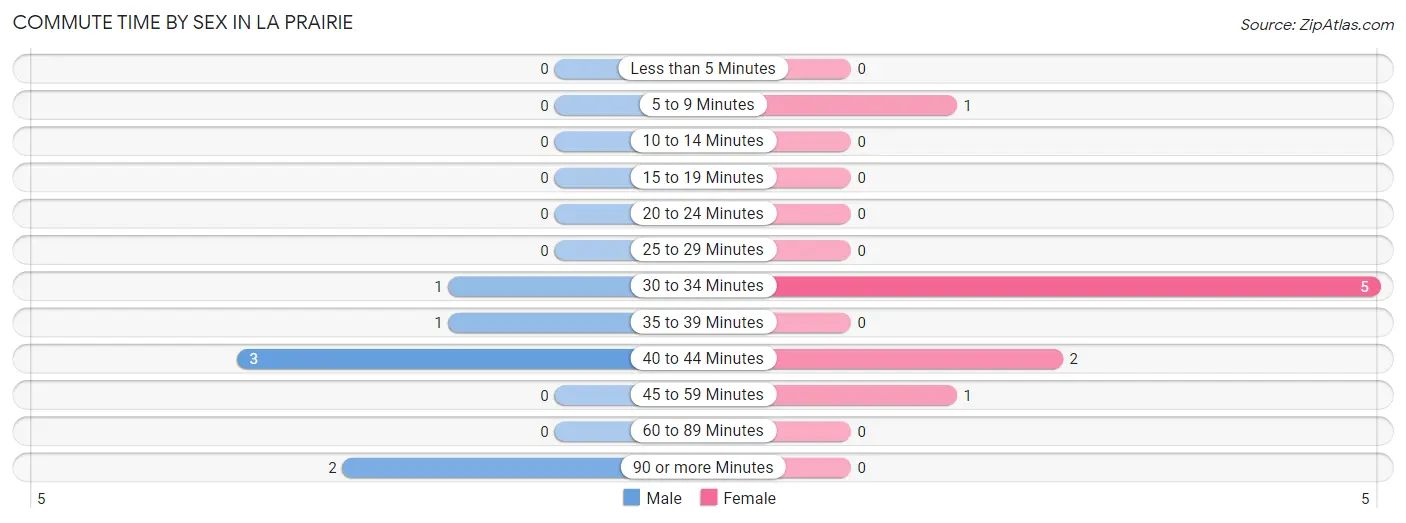
| Commute Time | Male | Female |
| Less than 5 Minutes | 0 (0.0%) | 0 (0.0%) |
| 5 to 9 Minutes | 0 (0.0%) | 1 (11.1%) |
| 10 to 14 Minutes | 0 (0.0%) | 0 (0.0%) |
| 15 to 19 Minutes | 0 (0.0%) | 0 (0.0%) |
| 20 to 24 Minutes | 0 (0.0%) | 0 (0.0%) |
| 25 to 29 Minutes | 0 (0.0%) | 0 (0.0%) |
| 30 to 34 Minutes | 1 (14.3%) | 5 (55.6%) |
| 35 to 39 Minutes | 1 (14.3%) | 0 (0.0%) |
| 40 to 44 Minutes | 3 (42.9%) | 2 (22.2%) |
| 45 to 59 Minutes | 0 (0.0%) | 1 (11.1%) |
| 60 to 89 Minutes | 0 (0.0%) | 0 (0.0%) |
| 90 or more Minutes | 2 (28.6%) | 0 (0.0%) |
Time of Departure to Work by Sex in La Prairie
The most frequent times of departure to work in La Prairie are 12:00 AM to 4:59 AM (2, 28.6%) for males and 7:30 AM to 7:59 AM (5, 55.6%) for females.
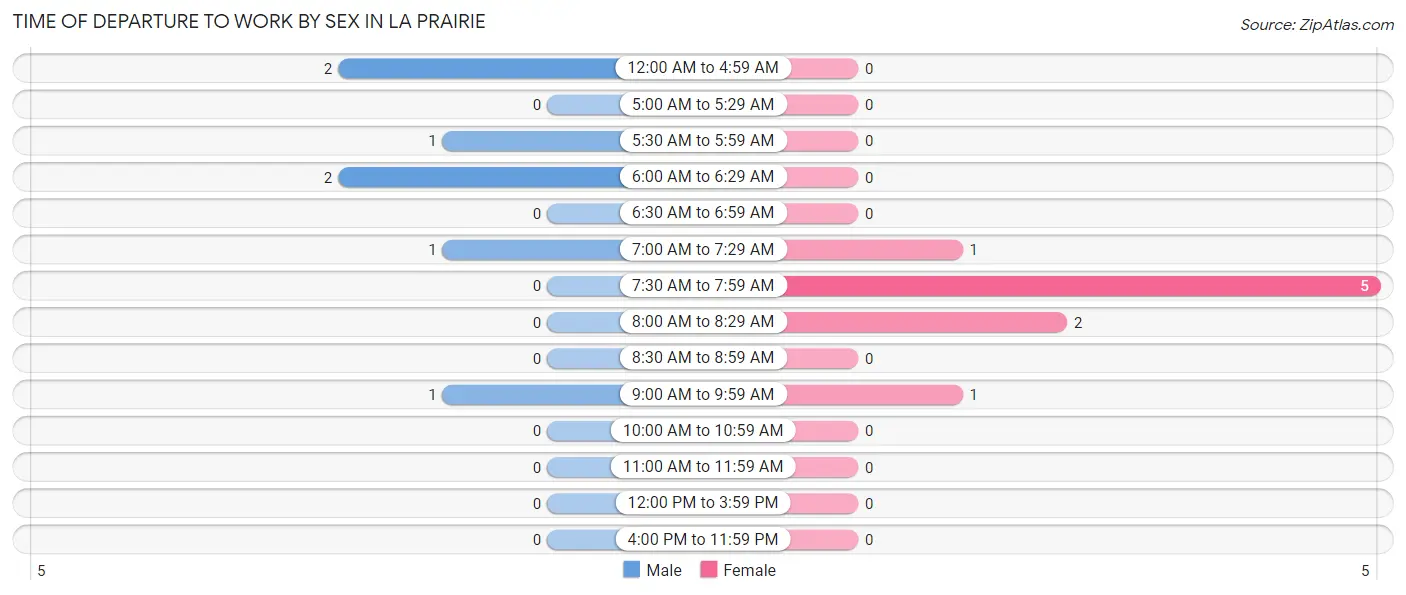
| Time of Departure | Male | Female |
| 12:00 AM to 4:59 AM | 2 (28.6%) | 0 (0.0%) |
| 5:00 AM to 5:29 AM | 0 (0.0%) | 0 (0.0%) |
| 5:30 AM to 5:59 AM | 1 (14.3%) | 0 (0.0%) |
| 6:00 AM to 6:29 AM | 2 (28.6%) | 0 (0.0%) |
| 6:30 AM to 6:59 AM | 0 (0.0%) | 0 (0.0%) |
| 7:00 AM to 7:29 AM | 1 (14.3%) | 1 (11.1%) |
| 7:30 AM to 7:59 AM | 0 (0.0%) | 5 (55.6%) |
| 8:00 AM to 8:29 AM | 0 (0.0%) | 2 (22.2%) |
| 8:30 AM to 8:59 AM | 0 (0.0%) | 0 (0.0%) |
| 9:00 AM to 9:59 AM | 1 (14.3%) | 1 (11.1%) |
| 10:00 AM to 10:59 AM | 0 (0.0%) | 0 (0.0%) |
| 11:00 AM to 11:59 AM | 0 (0.0%) | 0 (0.0%) |
| 12:00 PM to 3:59 PM | 0 (0.0%) | 0 (0.0%) |
| 4:00 PM to 11:59 PM | 0 (0.0%) | 0 (0.0%) |
| Total | 7 (100.0%) | 9 (100.0%) |
Housing Occupancy in La Prairie
Occupancy by Ownership in La Prairie
Of the total 20 dwellings in La Prairie, owner-occupied units account for 17 (85.0%), while renter-occupied units make up 3 (15.0%).
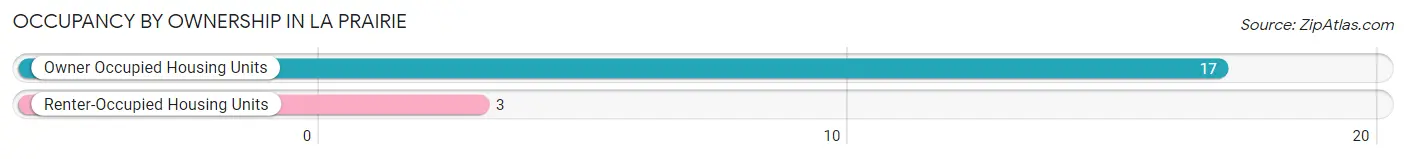
| Occupancy | # Housing Units | % Housing Units |
| Owner Occupied Housing Units | 17 | 85.0% |
| Renter-Occupied Housing Units | 3 | 15.0% |
| Total Occupied Housing Units | 20 | 100.0% |
Occupancy by Household Size in La Prairie
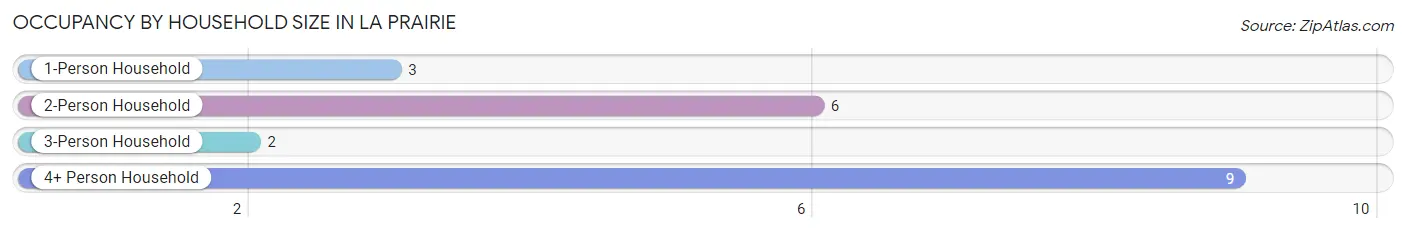
| Household Size | # Housing Units | % Housing Units |
| 1-Person Household | 3 | 15.0% |
| 2-Person Household | 6 | 30.0% |
| 3-Person Household | 2 | 10.0% |
| 4+ Person Household | 9 | 45.0% |
| Total Housing Units | 20 | 100.0% |
Occupancy by Ownership by Household Size in La Prairie
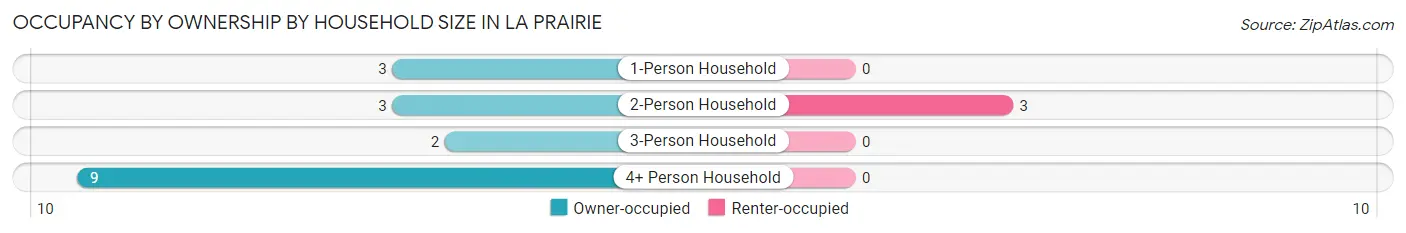
| Household Size | Owner-occupied | Renter-occupied |
| 1-Person Household | 3 (100.0%) | 0 (0.0%) |
| 2-Person Household | 3 (50.0%) | 3 (50.0%) |
| 3-Person Household | 2 (100.0%) | 0 (0.0%) |
| 4+ Person Household | 9 (100.0%) | 0 (0.0%) |
| Total Housing Units | 17 (85.0%) | 3 (15.0%) |
Occupancy by Educational Attainment in La Prairie
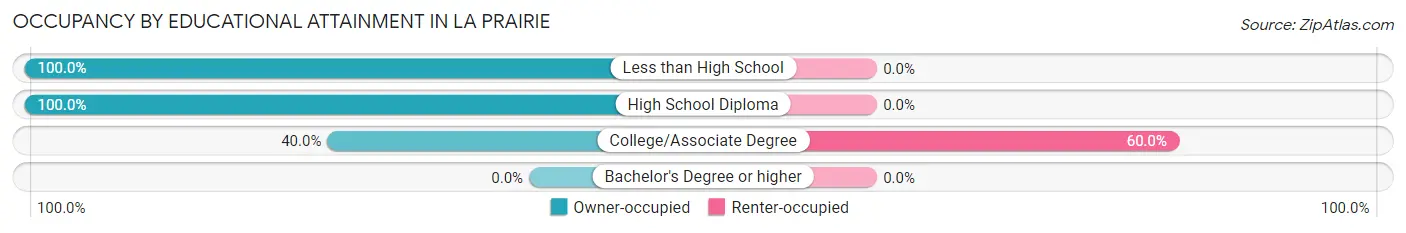
| Household Size | Owner-occupied | Renter-occupied |
| Less than High School | 2 (100.0%) | 0 (0.0%) |
| High School Diploma | 13 (100.0%) | 0 (0.0%) |
| College/Associate Degree | 2 (40.0%) | 3 (60.0%) |
| Bachelor's Degree or higher | 0 (0.0%) | 0 (0.0%) |
Occupancy by Age of Householder in La Prairie
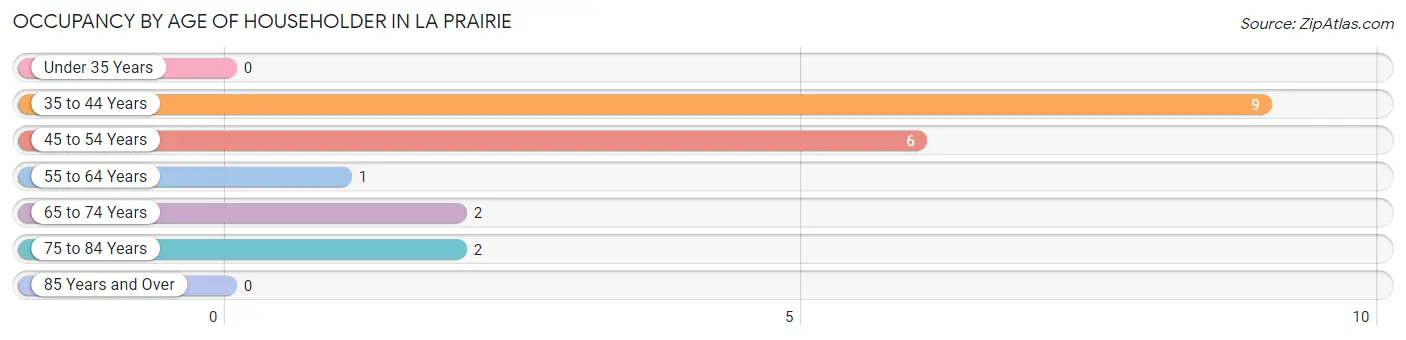
| Age Bracket | # Households | % Households |
| Under 35 Years | 0 | 0.0% |
| 35 to 44 Years | 9 | 45.0% |
| 45 to 54 Years | 6 | 30.0% |
| 55 to 64 Years | 1 | 5.0% |
| 65 to 74 Years | 2 | 10.0% |
| 75 to 84 Years | 2 | 10.0% |
| 85 Years and Over | 0 | 0.0% |
| Total | 20 | 100.0% |
Housing Finances in La Prairie
Median Income by Occupancy in La Prairie
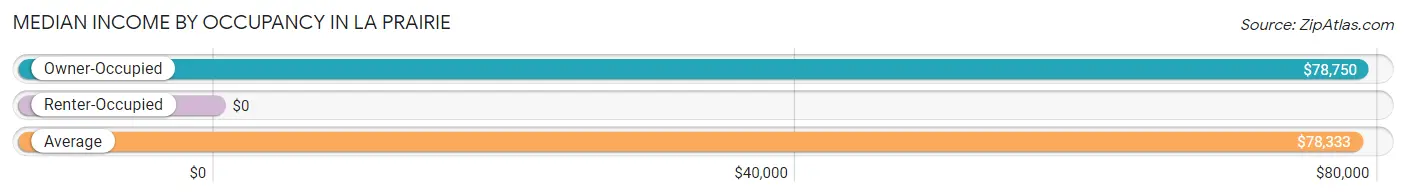
| Occupancy Type | # Households | Median Income |
| Owner-Occupied | 17 (85.0%) | $78,750 |
| Renter-Occupied | 3 (15.0%) | $0 |
| Average | 20 (100.0%) | $78,333 |
Occupancy by Householder Income Bracket in La Prairie
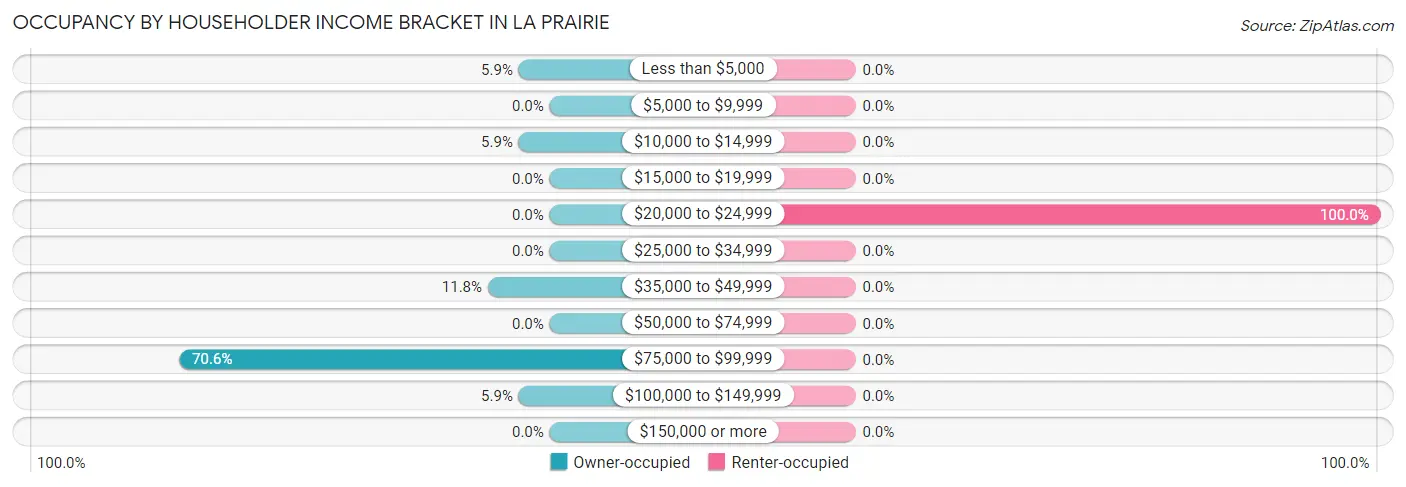
| Income Bracket | Owner-occupied | Renter-occupied |
| Less than $5,000 | 1 (5.9%) | 0 (0.0%) |
| $5,000 to $9,999 | 0 (0.0%) | 0 (0.0%) |
| $10,000 to $14,999 | 1 (5.9%) | 0 (0.0%) |
| $15,000 to $19,999 | 0 (0.0%) | 0 (0.0%) |
| $20,000 to $24,999 | 0 (0.0%) | 3 (100.0%) |
| $25,000 to $34,999 | 0 (0.0%) | 0 (0.0%) |
| $35,000 to $49,999 | 2 (11.8%) | 0 (0.0%) |
| $50,000 to $74,999 | 0 (0.0%) | 0 (0.0%) |
| $75,000 to $99,999 | 12 (70.6%) | 0 (0.0%) |
| $100,000 to $149,999 | 1 (5.9%) | 0 (0.0%) |
| $150,000 or more | 0 (0.0%) | 0 (0.0%) |
| Total | 17 (100.0%) | 3 (100.0%) |
Monthly Housing Cost Tiers in La Prairie
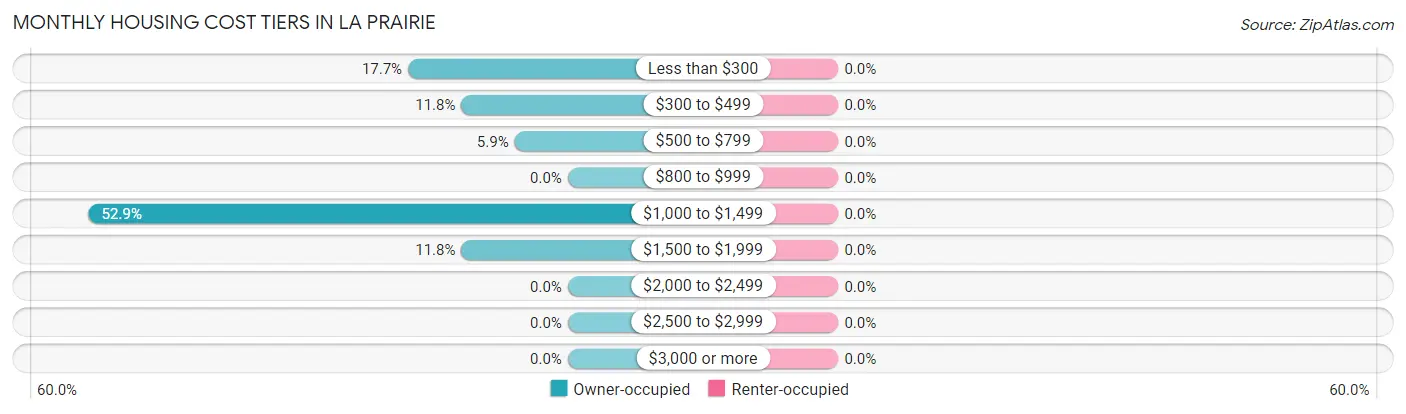
| Monthly Cost | Owner-occupied | Renter-occupied |
| Less than $300 | 3 (17.6%) | 0 (0.0%) |
| $300 to $499 | 2 (11.8%) | 0 (0.0%) |
| $500 to $799 | 1 (5.9%) | 0 (0.0%) |
| $800 to $999 | 0 (0.0%) | 0 (0.0%) |
| $1,000 to $1,499 | 9 (52.9%) | 0 (0.0%) |
| $1,500 to $1,999 | 2 (11.8%) | 0 (0.0%) |
| $2,000 to $2,499 | 0 (0.0%) | 0 (0.0%) |
| $2,500 to $2,999 | 0 (0.0%) | 0 (0.0%) |
| $3,000 or more | 0 (0.0%) | 0 (0.0%) |
| Total | 17 (100.0%) | 3 (100.0%) |
Physical Housing Characteristics in La Prairie
Housing Structures in La Prairie
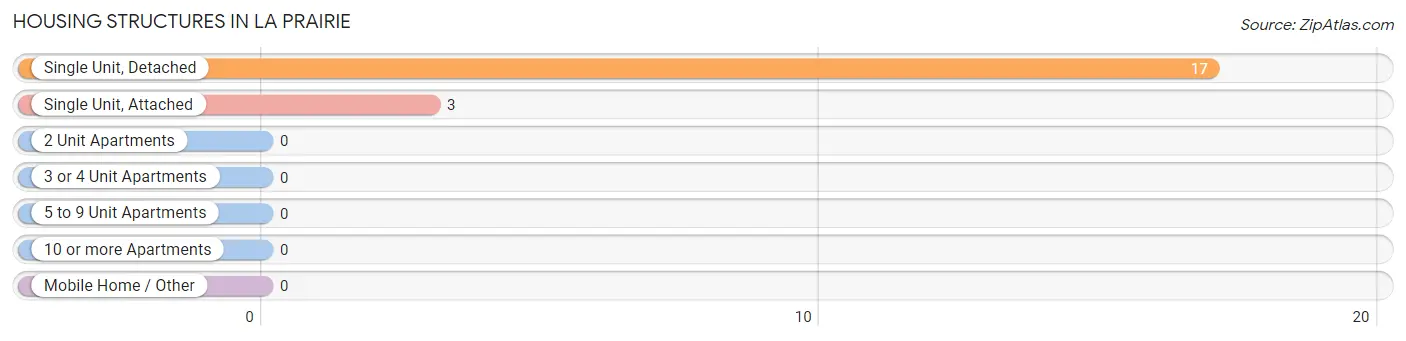
| Structure Type | # Housing Units | % Housing Units |
| Single Unit, Detached | 17 | 85.0% |
| Single Unit, Attached | 3 | 15.0% |
| 2 Unit Apartments | 0 | 0.0% |
| 3 or 4 Unit Apartments | 0 | 0.0% |
| 5 to 9 Unit Apartments | 0 | 0.0% |
| 10 or more Apartments | 0 | 0.0% |
| Mobile Home / Other | 0 | 0.0% |
| Total | 20 | 100.0% |
Housing Structures by Occupancy in La Prairie
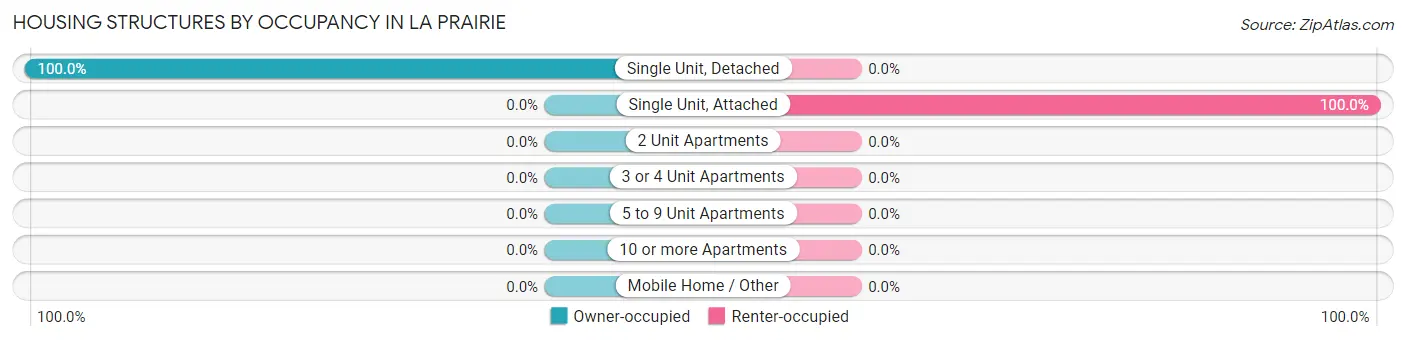
| Structure Type | Owner-occupied | Renter-occupied |
| Single Unit, Detached | 17 (100.0%) | 0 (0.0%) |
| Single Unit, Attached | 0 (0.0%) | 3 (100.0%) |
| 2 Unit Apartments | 0 (0.0%) | 0 (0.0%) |
| 3 or 4 Unit Apartments | 0 (0.0%) | 0 (0.0%) |
| 5 to 9 Unit Apartments | 0 (0.0%) | 0 (0.0%) |
| 10 or more Apartments | 0 (0.0%) | 0 (0.0%) |
| Mobile Home / Other | 0 (0.0%) | 0 (0.0%) |
| Total | 17 (85.0%) | 3 (15.0%) |
Housing Structures by Number of Rooms in La Prairie
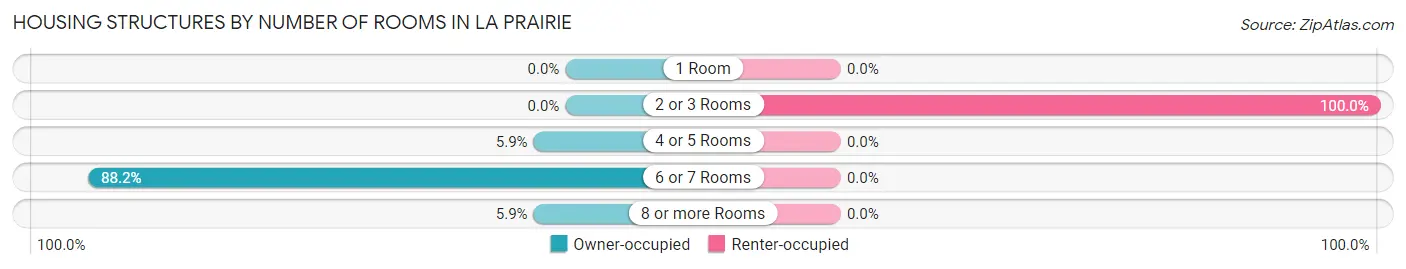
| Number of Rooms | Owner-occupied | Renter-occupied |
| 1 Room | 0 (0.0%) | 0 (0.0%) |
| 2 or 3 Rooms | 0 (0.0%) | 3 (100.0%) |
| 4 or 5 Rooms | 1 (5.9%) | 0 (0.0%) |
| 6 or 7 Rooms | 15 (88.2%) | 0 (0.0%) |
| 8 or more Rooms | 1 (5.9%) | 0 (0.0%) |
| Total | 17 (100.0%) | 3 (100.0%) |
Housing Structure by Heating Type in La Prairie
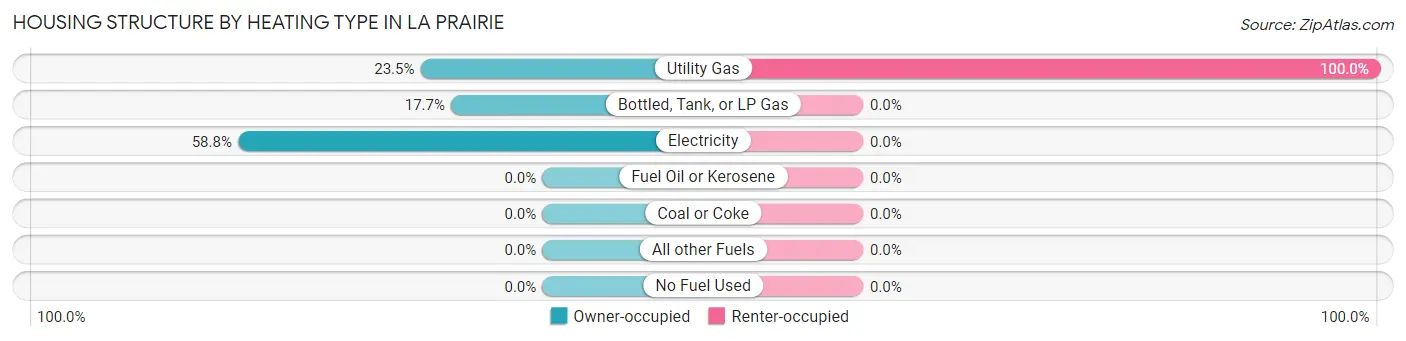
| Heating Type | Owner-occupied | Renter-occupied |
| Utility Gas | 4 (23.5%) | 3 (100.0%) |
| Bottled, Tank, or LP Gas | 3 (17.6%) | 0 (0.0%) |
| Electricity | 10 (58.8%) | 0 (0.0%) |
| Fuel Oil or Kerosene | 0 (0.0%) | 0 (0.0%) |
| Coal or Coke | 0 (0.0%) | 0 (0.0%) |
| All other Fuels | 0 (0.0%) | 0 (0.0%) |
| No Fuel Used | 0 (0.0%) | 0 (0.0%) |
| Total | 17 (100.0%) | 3 (100.0%) |
Household Vehicle Usage in La Prairie
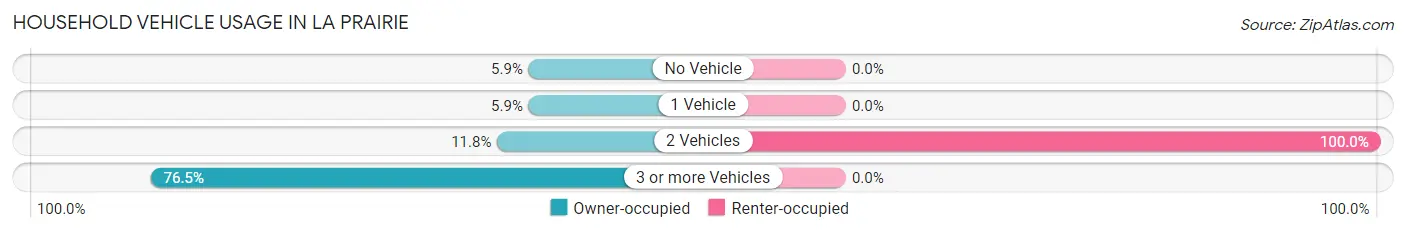
| Vehicles per Household | Owner-occupied | Renter-occupied |
| No Vehicle | 1 (5.9%) | 0 (0.0%) |
| 1 Vehicle | 1 (5.9%) | 0 (0.0%) |
| 2 Vehicles | 2 (11.8%) | 3 (100.0%) |
| 3 or more Vehicles | 13 (76.5%) | 0 (0.0%) |
| Total | 17 (100.0%) | 3 (100.0%) |
Real Estate & Mortgages in La Prairie
Real Estate and Mortgage Overview in La Prairie
| Characteristic | Without Mortgage | With Mortgage |
| Housing Units | 5 | 12 |
| Median Property Value | $42,500 | $95,600 |
| Median Household Income | - | - |
| Monthly Housing Costs | $238 | $0 |
| Real Estate Taxes | - | - |
Property Value by Mortgage Status in La Prairie
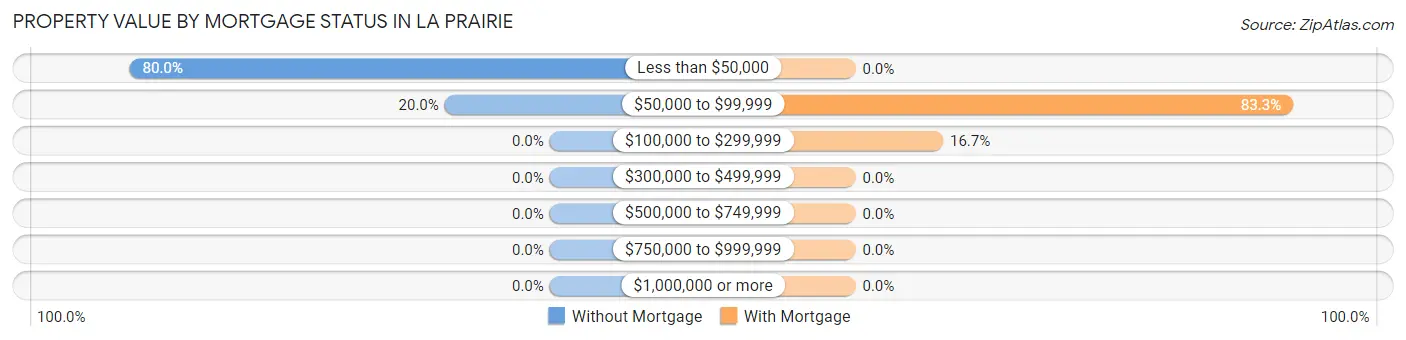
| Property Value | Without Mortgage | With Mortgage |
| Less than $50,000 | 4 (80.0%) | 0 (0.0%) |
| $50,000 to $99,999 | 1 (20.0%) | 10 (83.3%) |
| $100,000 to $299,999 | 0 (0.0%) | 2 (16.7%) |
| $300,000 to $499,999 | 0 (0.0%) | 0 (0.0%) |
| $500,000 to $749,999 | 0 (0.0%) | 0 (0.0%) |
| $750,000 to $999,999 | 0 (0.0%) | 0 (0.0%) |
| $1,000,000 or more | 0 (0.0%) | 0 (0.0%) |
| Total | 5 (100.0%) | 12 (100.0%) |
Household Income by Mortgage Status in La Prairie
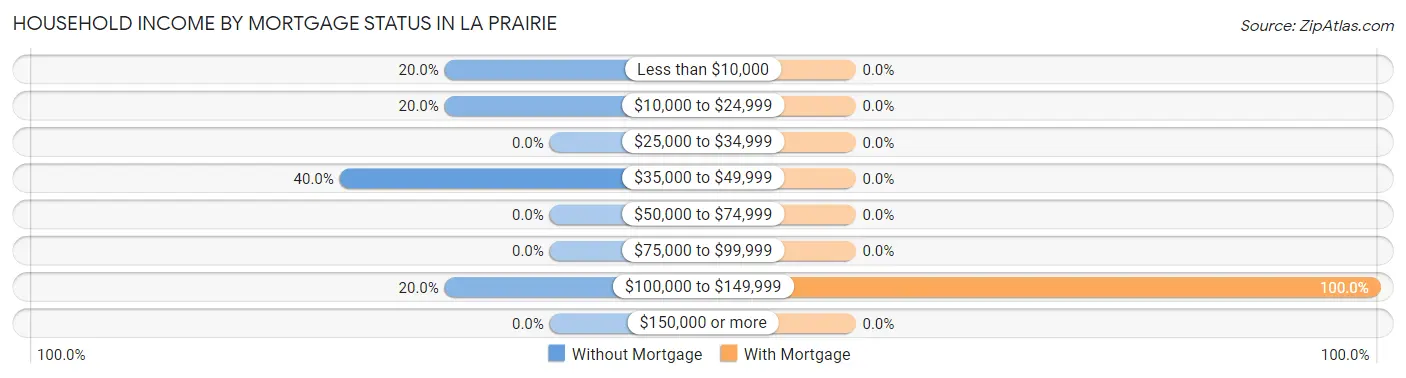
| Household Income | Without Mortgage | With Mortgage |
| Less than $10,000 | 1 (20.0%) | 0 (0.0%) |
| $10,000 to $24,999 | 1 (20.0%) | 0 (0.0%) |
| $25,000 to $34,999 | 0 (0.0%) | 0 (0.0%) |
| $35,000 to $49,999 | 2 (40.0%) | 0 (0.0%) |
| $50,000 to $74,999 | 0 (0.0%) | 0 (0.0%) |
| $75,000 to $99,999 | 0 (0.0%) | 0 (0.0%) |
| $100,000 to $149,999 | 1 (20.0%) | 12 (100.0%) |
| $150,000 or more | 0 (0.0%) | 0 (0.0%) |
| Total | 5 (100.0%) | 12 (100.0%) |
Property Value to Household Income Ratio in La Prairie
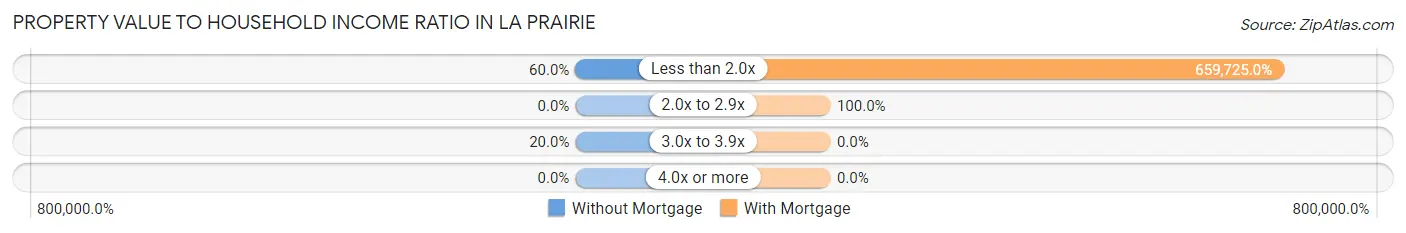
| Value-to-Income Ratio | Without Mortgage | With Mortgage |
| Less than 2.0x | 3 (60.0%) | 79,167 (659,725.0%) |
| 2.0x to 2.9x | 0 (0.0%) | 12 (100.0%) |
| 3.0x to 3.9x | 1 (20.0%) | 0 (0.0%) |
| 4.0x or more | 0 (0.0%) | 0 (0.0%) |
| Total | 5 (100.0%) | 12 (100.0%) |
Real Estate Taxes by Mortgage Status in La Prairie
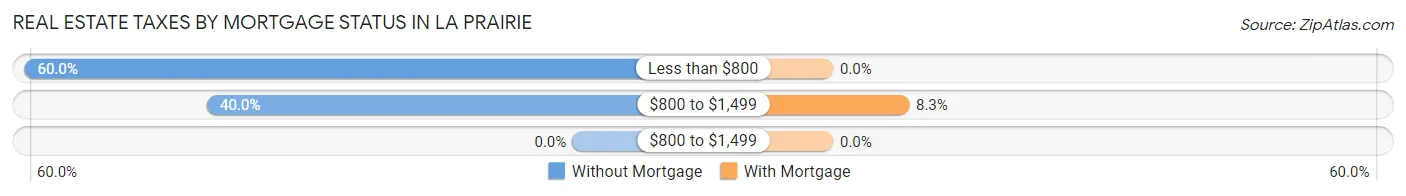
| Property Taxes | Without Mortgage | With Mortgage |
| Less than $800 | 3 (60.0%) | 0 (0.0%) |
| $800 to $1,499 | 2 (40.0%) | 1 (8.3%) |
| $800 to $1,499 | 0 (0.0%) | 0 (0.0%) |
| Total | 5 (100.0%) | 12 (100.0%) |
Health & Disability in La Prairie
Health Insurance Coverage by Age in La Prairie
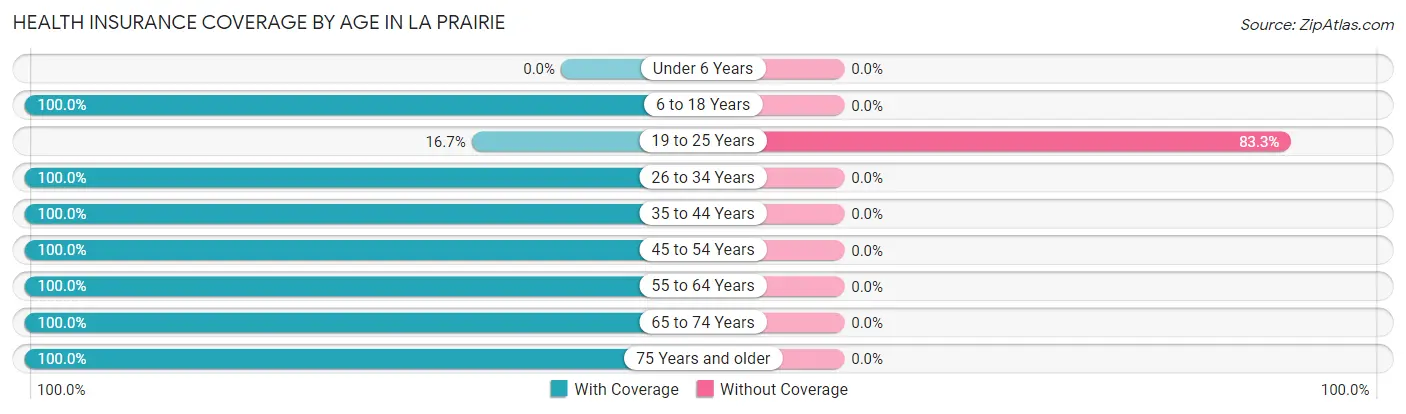
| Age Bracket | With Coverage | Without Coverage |
| Under 6 Years | 0 (0.0%) | 0 (0.0%) |
| 6 to 18 Years | 11 (100.0%) | 0 (0.0%) |
| 19 to 25 Years | 1 (16.7%) | 5 (83.3%) |
| 26 to 34 Years | 1 (100.0%) | 0 (0.0%) |
| 35 to 44 Years | 13 (100.0%) | 0 (0.0%) |
| 45 to 54 Years | 11 (100.0%) | 0 (0.0%) |
| 55 to 64 Years | 4 (100.0%) | 0 (0.0%) |
| 65 to 74 Years | 3 (100.0%) | 0 (0.0%) |
| 75 Years and older | 2 (100.0%) | 0 (0.0%) |
| Total | 46 (90.2%) | 5 (9.8%) |
Health Insurance Coverage by Citizenship Status in La Prairie

| Citizenship Status | With Coverage | Without Coverage |
| Native Born | 0 (0.0%) | 0 (0.0%) |
| Foreign Born, Citizen | 11 (100.0%) | 0 (0.0%) |
| Foreign Born, not a Citizen | 1 (16.7%) | 5 (83.3%) |
Health Insurance Coverage by Household Income in La Prairie
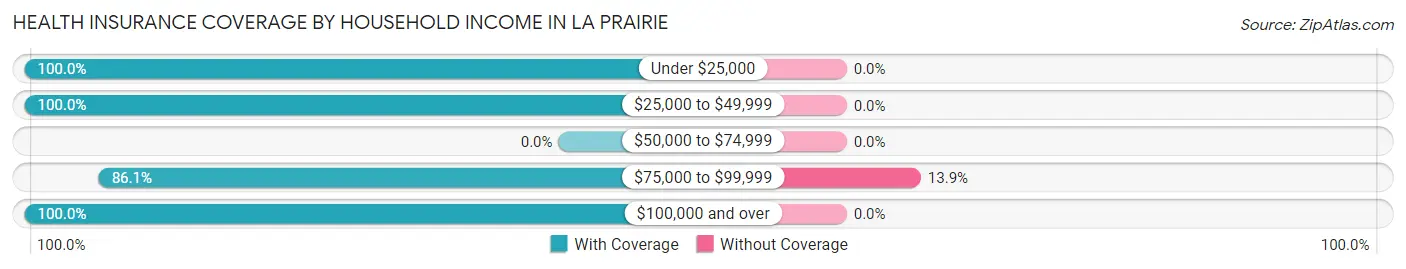
| Household Income | With Coverage | Without Coverage |
| Under $25,000 | 8 (100.0%) | 0 (0.0%) |
| $25,000 to $49,999 | 4 (100.0%) | 0 (0.0%) |
| $50,000 to $74,999 | 0 (0.0%) | 0 (0.0%) |
| $75,000 to $99,999 | 31 (86.1%) | 5 (13.9%) |
| $100,000 and over | 3 (100.0%) | 0 (0.0%) |
Public vs Private Health Insurance Coverage by Age in La Prairie
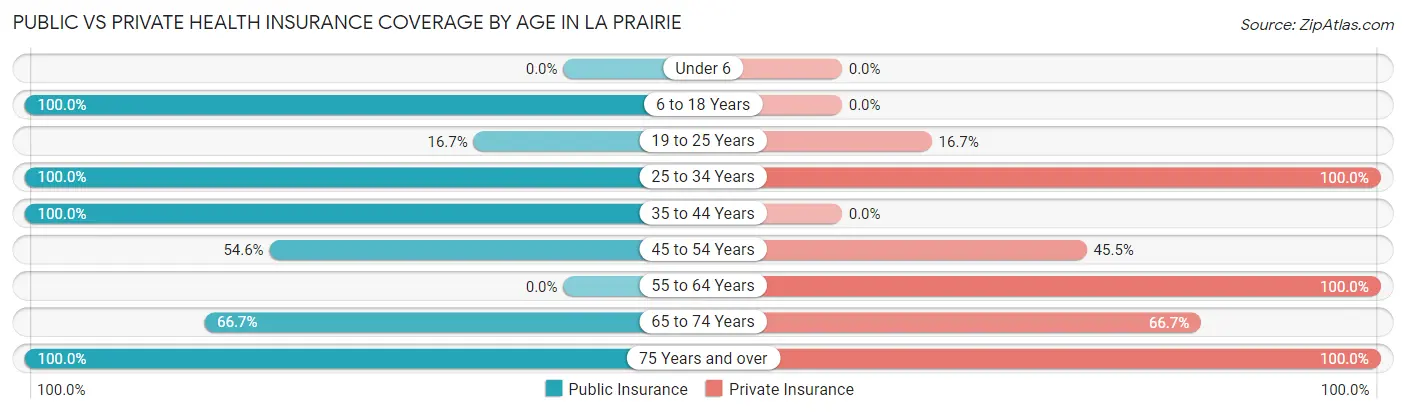
| Age Bracket | Public Insurance | Private Insurance |
| Under 6 | 0 (0.0%) | 0 (0.0%) |
| 6 to 18 Years | 11 (100.0%) | 0 (0.0%) |
| 19 to 25 Years | 1 (16.7%) | 1 (16.7%) |
| 25 to 34 Years | 1 (100.0%) | 1 (100.0%) |
| 35 to 44 Years | 13 (100.0%) | 0 (0.0%) |
| 45 to 54 Years | 6 (54.5%) | 5 (45.5%) |
| 55 to 64 Years | 0 (0.0%) | 4 (100.0%) |
| 65 to 74 Years | 2 (66.7%) | 2 (66.7%) |
| 75 Years and over | 2 (100.0%) | 2 (100.0%) |
| Total | 36 (70.6%) | 15 (29.4%) |
Disability Status by Sex by Age in La Prairie
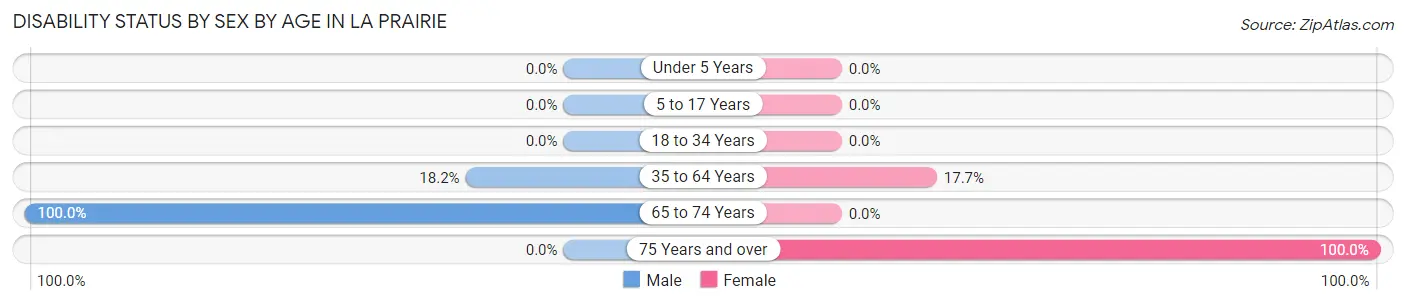
| Age Bracket | Male | Female |
| Under 5 Years | 0 (0.0%) | 0 (0.0%) |
| 5 to 17 Years | 0 (0.0%) | 0 (0.0%) |
| 18 to 34 Years | 0 (0.0%) | 0 (0.0%) |
| 35 to 64 Years | 2 (18.2%) | 3 (17.6%) |
| 65 to 74 Years | 1 (100.0%) | 0 (0.0%) |
| 75 Years and over | 0 (0.0%) | 1 (100.0%) |
Disability Class by Sex by Age in La Prairie
Disability Class: Hearing Difficulty
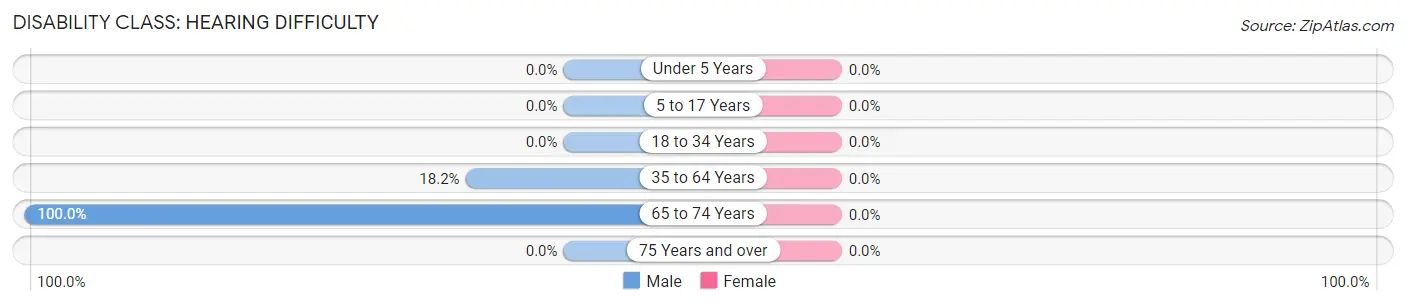
| Age Bracket | Male | Female |
| Under 5 Years | 0 (0.0%) | 0 (0.0%) |
| 5 to 17 Years | 0 (0.0%) | 0 (0.0%) |
| 18 to 34 Years | 0 (0.0%) | 0 (0.0%) |
| 35 to 64 Years | 2 (18.2%) | 0 (0.0%) |
| 65 to 74 Years | 1 (100.0%) | 0 (0.0%) |
| 75 Years and over | 0 (0.0%) | 0 (0.0%) |
Disability Class: Vision Difficulty
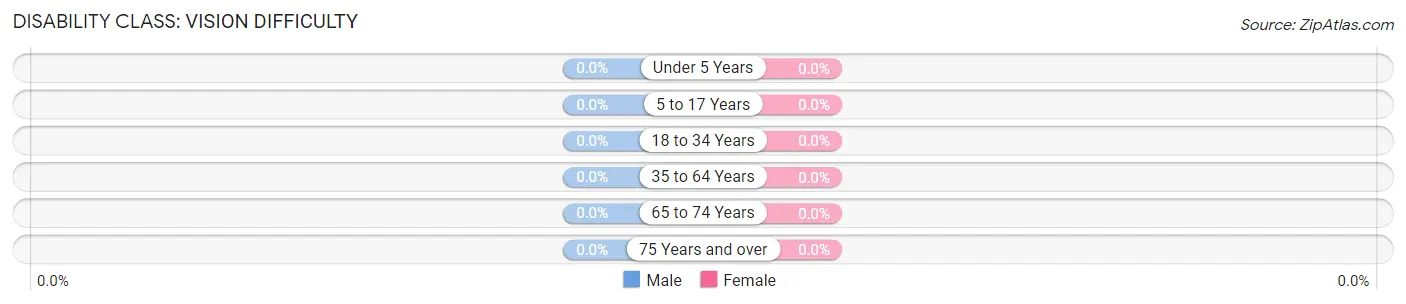
| Age Bracket | Male | Female |
| Under 5 Years | 0 (0.0%) | 0 (0.0%) |
| 5 to 17 Years | 0 (0.0%) | 0 (0.0%) |
| 18 to 34 Years | 0 (0.0%) | 0 (0.0%) |
| 35 to 64 Years | 0 (0.0%) | 0 (0.0%) |
| 65 to 74 Years | 0 (0.0%) | 0 (0.0%) |
| 75 Years and over | 0 (0.0%) | 0 (0.0%) |
Disability Class: Cognitive Difficulty
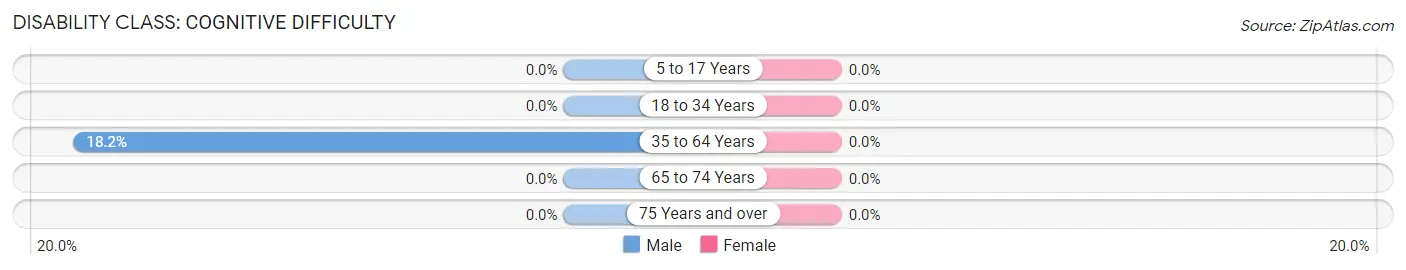
| Age Bracket | Male | Female |
| 5 to 17 Years | 0 (0.0%) | 0 (0.0%) |
| 18 to 34 Years | 0 (0.0%) | 0 (0.0%) |
| 35 to 64 Years | 2 (18.2%) | 0 (0.0%) |
| 65 to 74 Years | 0 (0.0%) | 0 (0.0%) |
| 75 Years and over | 0 (0.0%) | 0 (0.0%) |
Disability Class: Ambulatory Difficulty
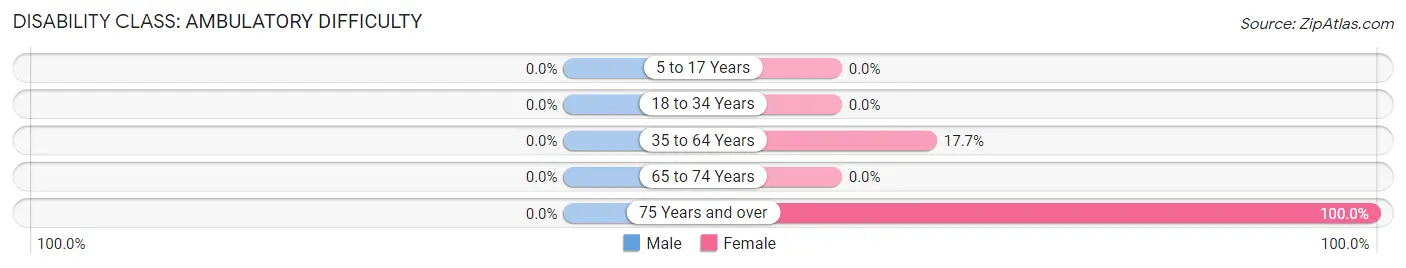
| Age Bracket | Male | Female |
| 5 to 17 Years | 0 (0.0%) | 0 (0.0%) |
| 18 to 34 Years | 0 (0.0%) | 0 (0.0%) |
| 35 to 64 Years | 0 (0.0%) | 3 (17.6%) |
| 65 to 74 Years | 0 (0.0%) | 0 (0.0%) |
| 75 Years and over | 0 (0.0%) | 1 (100.0%) |
Disability Class: Self-Care Difficulty
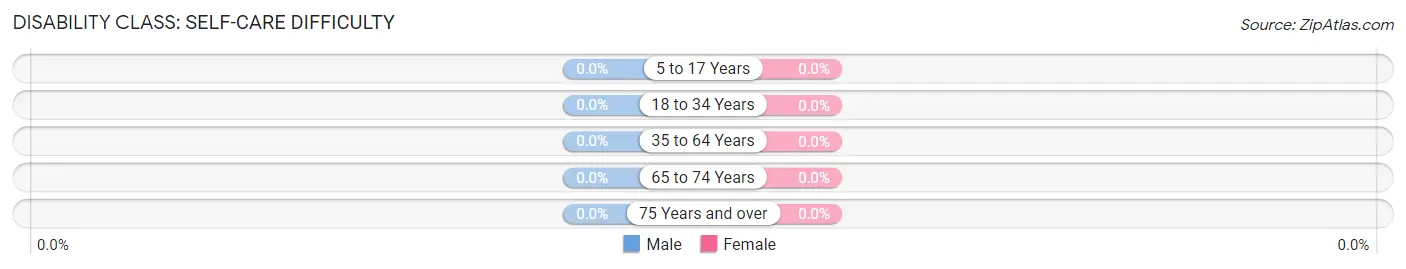
| Age Bracket | Male | Female |
| 5 to 17 Years | 0 (0.0%) | 0 (0.0%) |
| 18 to 34 Years | 0 (0.0%) | 0 (0.0%) |
| 35 to 64 Years | 0 (0.0%) | 0 (0.0%) |
| 65 to 74 Years | 0 (0.0%) | 0 (0.0%) |
| 75 Years and over | 0 (0.0%) | 0 (0.0%) |
Technology Access in La Prairie
Computing Device Access in La Prairie
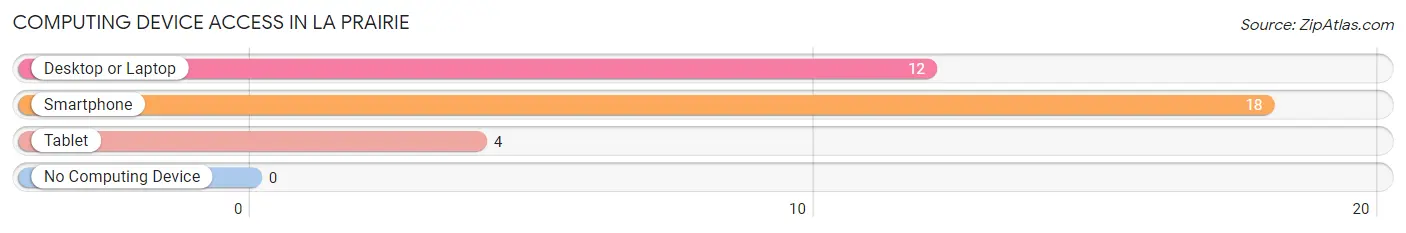
| Device Type | # Households | % Households |
| Desktop or Laptop | 12 | 60.0% |
| Smartphone | 18 | 90.0% |
| Tablet | 4 | 20.0% |
| No Computing Device | 0 | 0.0% |
| Total | 20 | 100.0% |
Internet Access in La Prairie
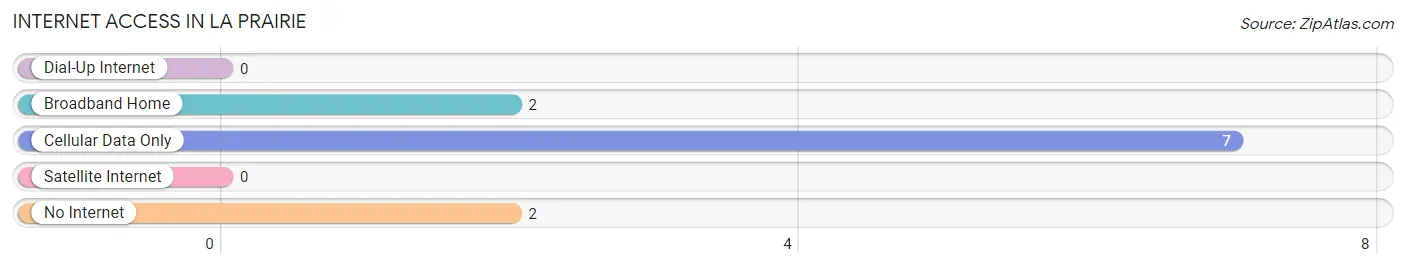
| Internet Type | # Households | % Households |
| Dial-Up Internet | 0 | 0.0% |
| Broadband Home | 2 | 10.0% |
| Cellular Data Only | 7 | 35.0% |
| Satellite Internet | 0 | 0.0% |
| No Internet | 2 | 10.0% |
| Total | 20 | 100.0% |
La Prairie Summary
Prairie, Illinois is a small village located in Iroquois County, Illinois. It is situated in the eastern part of the state, about 40 miles south of Chicago. The village has a population of approximately 1,000 people and is part of the Kankakee-Iroquois Regional Planning Commission.
History
The area that is now Prairie, Illinois was first settled in the early 1800s by a group of French-Canadian immigrants. The village was originally known as La Prairie, which is French for “the meadow.” The village was officially incorporated in 1867.
In the late 1800s, the village was a thriving agricultural community. The main crops grown in the area were corn, wheat, and oats. The village also had a number of small businesses, including a general store, a blacksmith shop, and a post office.
In the early 1900s, the village began to experience a decline in population as many of the residents moved away to larger cities. The village was also affected by the Great Depression, which caused many of the businesses to close.
In the 1950s, the village began to experience a resurgence in population as many of the residents returned to the area. The village also began to attract new businesses, including a grocery store, a hardware store, and a gas station.
Geography
Prairie, Illinois is located in the eastern part of the state, about 40 miles south of Chicago. The village is situated in the Kankakee-Iroquois Regional Planning Commission. The village is located in a rural area and is surrounded by farmland. The village is located on the banks of the Iroquois River.
The village has a total area of 0.6 square miles, all of which is land. The village has a humid continental climate, with hot summers and cold winters. The average annual temperature is around 50 degrees Fahrenheit.
Economy
The economy of Prairie, Illinois is largely based on agriculture. The main crops grown in the area are corn, wheat, and oats. The village also has a number of small businesses, including a grocery store, a hardware store, and a gas station.
The village also has a number of manufacturing businesses, including a furniture factory and a plastics factory. The village also has a number of service-based businesses, including a bank, a post office, and a library.
Demographics
As of the 2010 census, the population of Prairie, Illinois was 1,000 people. The racial makeup of the village was 97.2% White, 0.7% African American, 0.3% Native American, 0.3% Asian, and 1.5% from other races. The median household income was $41,250 and the median family income was $50,000.
The village has a large number of elderly residents, with nearly 20% of the population over the age of 65. The village also has a large number of children, with nearly 30% of the population under the age of 18. The village has a low unemployment rate, with only 4.2% of the population unemployed.
Common Questions
What is Per Capita Income in La Prairie?
Per Capita income in La Prairie is $20,904.
What is the Median Family Income in La Prairie?
Median Family Income in La Prairie is $78,750.
What is the Median Household income in La Prairie?
Median Household Income in La Prairie is $78,333.
What is Inequality or Gini Index in La Prairie?
Inequality or Gini Index in La Prairie is 0.27.
What is the Total Population of La Prairie?
Total Population of La Prairie is 51.
What is the Total Male Population of La Prairie?
Total Male Population of La Prairie is 26.
What is the Total Female Population of La Prairie?
Total Female Population of La Prairie is 25.
What is the Ratio of Males per 100 Females in La Prairie?
There are 104.00 Males per 100 Females in La Prairie.
What is the Ratio of Females per 100 Males in La Prairie?
There are 96.15 Females per 100 Males in La Prairie.
What is the Median Population Age in La Prairie?
Median Population Age in La Prairie is 40.8 Years.
What is the Average Family Size in La Prairie
Average Family Size in La Prairie is 2.8 People.
What is the Average Household Size in La Prairie
Average Household Size in La Prairie is 2.5 People.
How Large is the Labor Force in La Prairie?
There are 20 People in the Labor Forcein in La Prairie.
What is the Percentage of People in the Labor Force in La Prairie?
39.2% of People are in the Labor Force in La Prairie.
What is the Unemployment Rate in La Prairie?
Unemployment Rate in La Prairie is 20.0%.