Zip Codes with the Highest Percentage of Population Employed in Installation, Maintenance & Repair in Danville, VA
RELATED REPORTS & OPTIONS
Installation, Maintenance & Repair
Danville
Compare Zip Codes
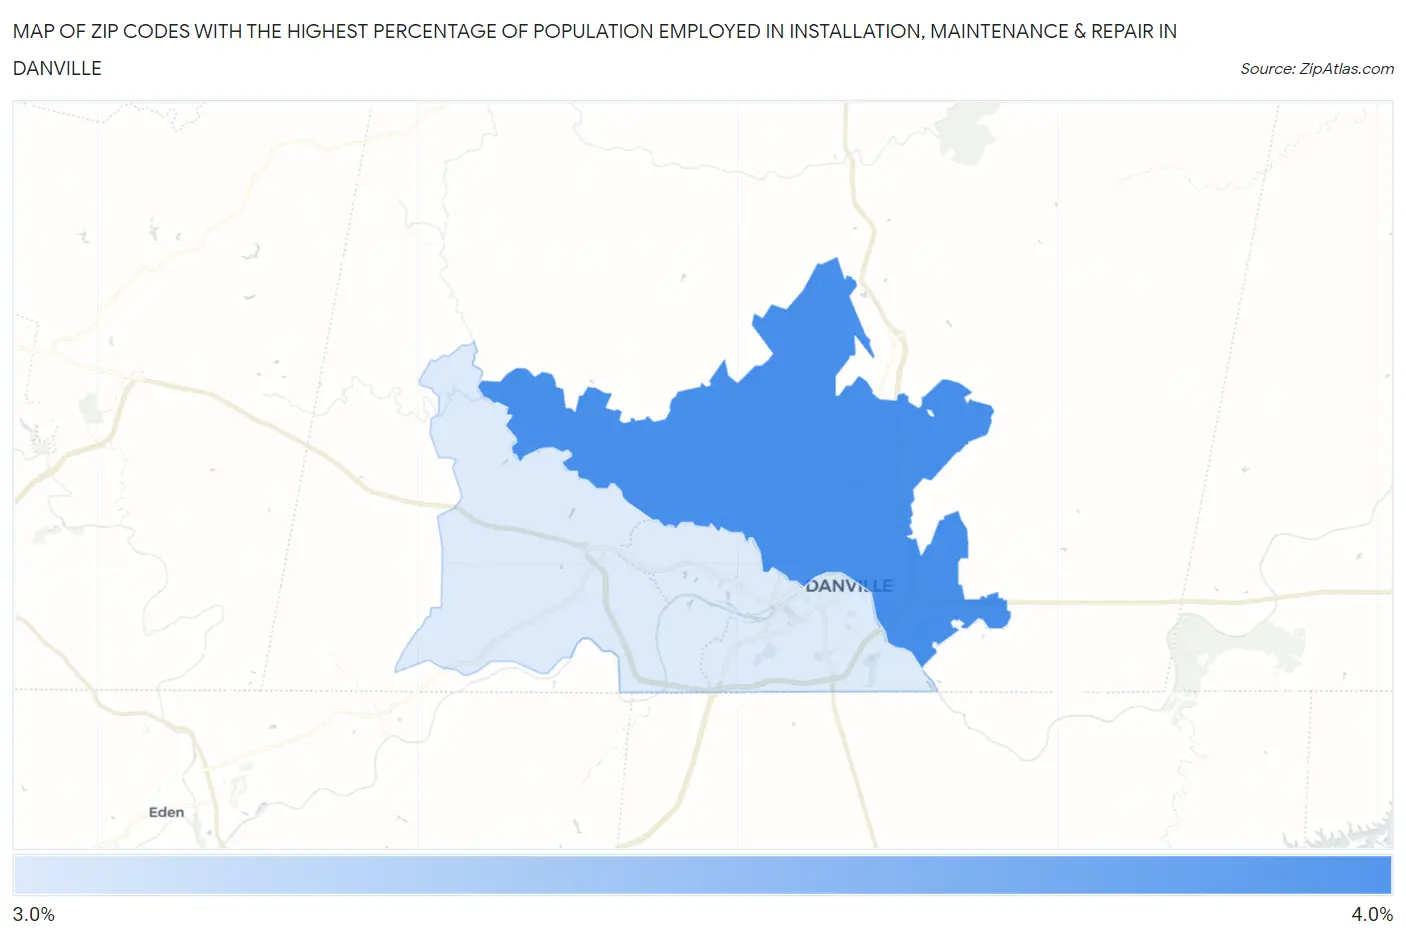
Map of Zip Codes with the Highest Percentage of Population Employed in Installation, Maintenance & Repair in Danville
3.3%
3.7%
Zip Codes with the Highest Percentage of Population Employed in Installation, Maintenance & Repair in Danville, VA
| Zip Code | % Employed | vs State | vs National | |
| 1. | 24540 | 3.7% | 2.9%(+0.847)#335 | 3.1%(+0.681)#13,462 |
| 2. | 24541 | 3.3% | 2.9%(+0.429)#376 | 3.1%(+0.263)#15,413 |
1
Common Questions
What are the Top Zip Codes with the Highest Percentage of Population Employed in Installation, Maintenance & Repair in Danville, VA?
Top Zip Codes with the Highest Percentage of Population Employed in Installation, Maintenance & Repair in Danville, VA are:
What zip code has the Highest Percentage of Population Employed in Installation, Maintenance & Repair in Danville, VA?
24540 has the Highest Percentage of Population Employed in Installation, Maintenance & Repair in Danville, VA with 3.7%.
What is the Percentage of Population Employed in Installation, Maintenance & Repair in Danville, VA?
Percentage of Population Employed in Installation, Maintenance & Repair in Danville is 2.6%.
What is the Percentage of Population Employed in Installation, Maintenance & Repair in Virginia?
Percentage of Population Employed in Installation, Maintenance & Repair in Virginia is 2.9%.
What is the Percentage of Population Employed in Installation, Maintenance & Repair in the United States?
Percentage of Population Employed in Installation, Maintenance & Repair in the United States is 3.1%.