Tsimshian vs Immigrants from Spain Unemployment Among Women with Children Ages 6 to 17 years
COMPARE
Tsimshian
Immigrants from Spain
Unemployment Among Women with Children Ages 6 to 17 years
Unemployment Among Women with Children Ages 6 to 17 years Comparison
Tsimshian
Immigrants from Spain
11.4%
UNEMPLOYMENT AMONG WOMEN WITH CHILDREN AGES 6 TO 17 YEARS
0.0/ 100
METRIC RATING
332nd/ 347
METRIC RANK
9.0%
UNEMPLOYMENT AMONG WOMEN WITH CHILDREN AGES 6 TO 17 YEARS
32.4/ 100
METRIC RATING
186th/ 347
METRIC RANK
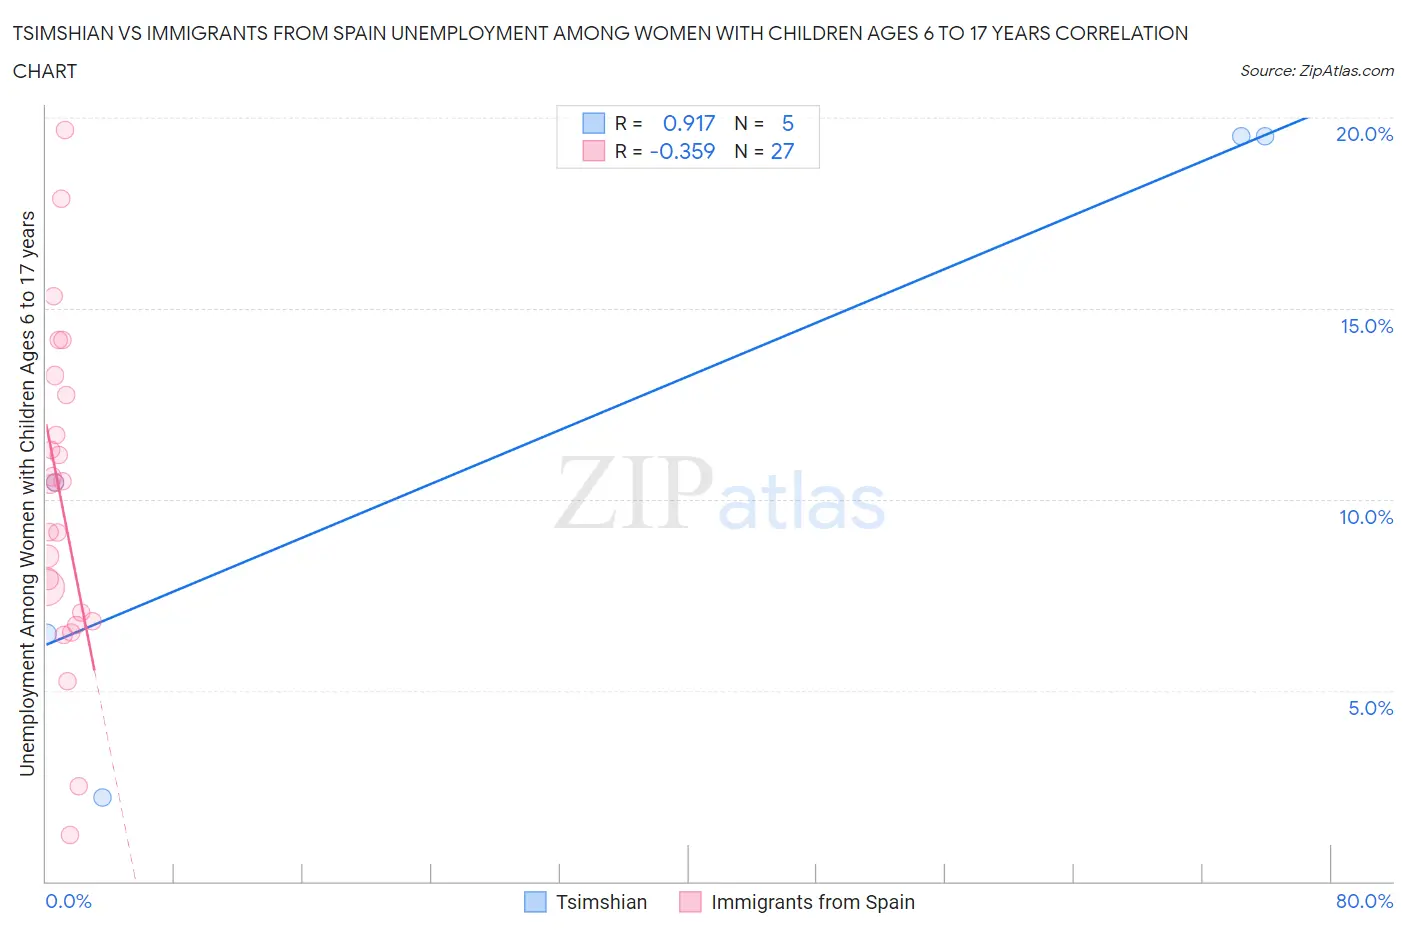
Tsimshian vs Immigrants from Spain Unemployment Among Women with Children Ages 6 to 17 years Correlation Chart
The statistical analysis conducted on geographies consisting of 14,078,831 people shows a near-perfect positive correlation between the proportion of Tsimshian and unemployment rate among women with children between the ages 6 and 17 in the United States with a correlation coefficient (R) of 0.917 and weighted average of 11.4%. Similarly, the statistical analysis conducted on geographies consisting of 188,421,772 people shows a mild negative correlation between the proportion of Immigrants from Spain and unemployment rate among women with children between the ages 6 and 17 in the United States with a correlation coefficient (R) of -0.359 and weighted average of 9.0%, a difference of 26.0%.
Unemployment Among Women with Children Ages 6 to 17 years Correlation Summary
| Measurement | Tsimshian | Immigrants from Spain |
| Minimum | 2.2% | 1.2% |
| Maximum | 19.5% | 19.7% |
| Range | 17.3% | 18.5% |
| Mean | 11.6% | 9.9% |
| Median | 10.4% | 10.4% |
| Interquartile 25% (IQ1) | 4.3% | 6.8% |
| Interquartile 75% (IQ3) | 19.5% | 12.7% |
| Interquartile Range (IQR) | 15.2% | 5.9% |
| Standard Deviation (Sample) | 7.8% | 4.2% |
| Standard Deviation (Population) | 6.9% | 4.2% |
Similar Demographics by Unemployment Among Women with Children Ages 6 to 17 years
Demographics Similar to Tsimshian by Unemployment Among Women with Children Ages 6 to 17 years
In terms of unemployment among women with children ages 6 to 17 years, the demographic groups most similar to Tsimshian are Black/African American (11.4%, a difference of 0.11%), Native/Alaskan (11.5%, a difference of 0.63%), Chippewa (11.1%, a difference of 2.7%), Pennsylvania German (11.0%, a difference of 3.2%), and Ottawa (10.9%, a difference of 4.8%).
| Demographics | Rating | Rank | Unemployment Among Women with Children Ages 6 to 17 years |
| Cajuns | 0.0 /100 | #325 | Tragic 10.8% |
| Liberians | 0.0 /100 | #326 | Tragic 10.8% |
| Cape Verdeans | 0.0 /100 | #327 | Tragic 10.9% |
| Ottawa | 0.0 /100 | #328 | Tragic 10.9% |
| Pennsylvania Germans | 0.0 /100 | #329 | Tragic 11.0% |
| Chippewa | 0.0 /100 | #330 | Tragic 11.1% |
| Blacks/African Americans | 0.0 /100 | #331 | Tragic 11.4% |
| Tsimshian | 0.0 /100 | #332 | Tragic 11.4% |
| Natives/Alaskans | 0.0 /100 | #333 | Tragic 11.5% |
| Ugandans | 0.0 /100 | #334 | Tragic 12.0% |
| Colville | 0.0 /100 | #335 | Tragic 12.3% |
| Houma | 0.0 /100 | #336 | Tragic 12.5% |
| Immigrants | Yemen | 0.0 /100 | #337 | Tragic 12.7% |
| Hopi | 0.0 /100 | #338 | Tragic 12.9% |
| Sioux | 0.0 /100 | #339 | Tragic 13.2% |
Demographics Similar to Immigrants from Spain by Unemployment Among Women with Children Ages 6 to 17 years
In terms of unemployment among women with children ages 6 to 17 years, the demographic groups most similar to Immigrants from Spain are Immigrants from Congo (9.0%, a difference of 0.010%), Swiss (9.0%, a difference of 0.050%), Palestinian (9.0%, a difference of 0.050%), Immigrants from Czechoslovakia (9.0%, a difference of 0.10%), and South American Indian (9.0%, a difference of 0.10%).
| Demographics | Rating | Rank | Unemployment Among Women with Children Ages 6 to 17 years |
| Immigrants | Zaire | 38.3 /100 | #179 | Fair 9.0% |
| Ethiopians | 37.6 /100 | #180 | Fair 9.0% |
| Immigrants | Czechoslovakia | 34.5 /100 | #181 | Fair 9.0% |
| South American Indians | 34.4 /100 | #182 | Fair 9.0% |
| Swiss | 33.5 /100 | #183 | Fair 9.0% |
| Palestinians | 33.4 /100 | #184 | Fair 9.0% |
| Immigrants | Congo | 32.5 /100 | #185 | Fair 9.0% |
| Immigrants | Spain | 32.4 /100 | #186 | Fair 9.0% |
| Comanche | 30.0 /100 | #187 | Fair 9.0% |
| Immigrants | Syria | 29.7 /100 | #188 | Fair 9.1% |
| Immigrants | Immigrants | 29.2 /100 | #189 | Fair 9.1% |
| Slovenes | 28.5 /100 | #190 | Fair 9.1% |
| Belizeans | 28.4 /100 | #191 | Fair 9.1% |
| Guamanians/Chamorros | 27.2 /100 | #192 | Fair 9.1% |
| Immigrants | Turkey | 25.8 /100 | #193 | Fair 9.1% |