Potawatomi vs Finnish Unemployment Among Women with Children Ages 6 to 17 years
COMPARE
Potawatomi
Finnish
Unemployment Among Women with Children Ages 6 to 17 years
Unemployment Among Women with Children Ages 6 to 17 years Comparison
Potawatomi
Finns
8.5%
UNEMPLOYMENT AMONG WOMEN WITH CHILDREN AGES 6 TO 17 YEARS
99.0/ 100
METRIC RATING
92nd/ 347
METRIC RANK
9.2%
UNEMPLOYMENT AMONG WOMEN WITH CHILDREN AGES 6 TO 17 YEARS
10.0/ 100
METRIC RATING
210th/ 347
METRIC RANK
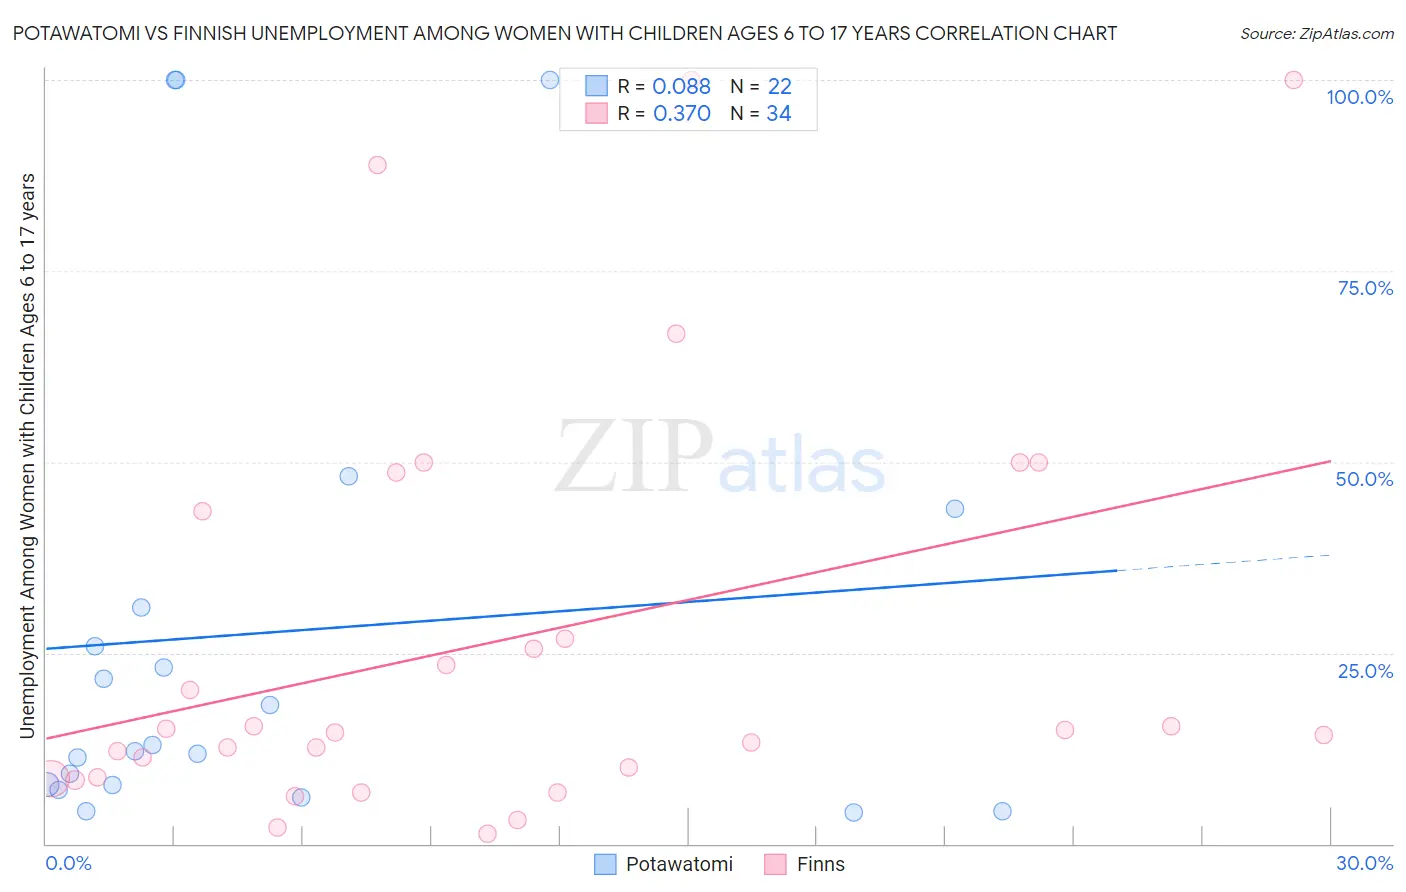
Potawatomi vs Finnish Unemployment Among Women with Children Ages 6 to 17 years Correlation Chart
The statistical analysis conducted on geographies consisting of 100,614,314 people shows a slight positive correlation between the proportion of Potawatomi and unemployment rate among women with children between the ages 6 and 17 in the United States with a correlation coefficient (R) of 0.088 and weighted average of 8.5%. Similarly, the statistical analysis conducted on geographies consisting of 277,451,978 people shows a mild positive correlation between the proportion of Finns and unemployment rate among women with children between the ages 6 and 17 in the United States with a correlation coefficient (R) of 0.370 and weighted average of 9.2%, a difference of 7.9%.
Unemployment Among Women with Children Ages 6 to 17 years Correlation Summary
| Measurement | Potawatomi | Finnish |
| Minimum | 4.1% | 1.3% |
| Maximum | 100.0% | 100.0% |
| Range | 95.9% | 98.7% |
| Mean | 27.7% | 26.7% |
| Median | 12.5% | 14.7% |
| Interquartile 25% (IQ1) | 7.7% | 8.6% |
| Interquartile 75% (IQ3) | 31.0% | 43.5% |
| Interquartile Range (IQR) | 23.3% | 34.9% |
| Standard Deviation (Sample) | 31.8% | 27.4% |
| Standard Deviation (Population) | 31.0% | 27.0% |
Similar Demographics by Unemployment Among Women with Children Ages 6 to 17 years
Demographics Similar to Potawatomi by Unemployment Among Women with Children Ages 6 to 17 years
In terms of unemployment among women with children ages 6 to 17 years, the demographic groups most similar to Potawatomi are Immigrants from Eastern Europe (8.5%, a difference of 0.030%), Yugoslavian (8.5%, a difference of 0.090%), Australian (8.5%, a difference of 0.12%), Paiute (8.5%, a difference of 0.13%), and Immigrants from Vietnam (8.5%, a difference of 0.21%).
| Demographics | Rating | Rank | Unemployment Among Women with Children Ages 6 to 17 years |
| Immigrants | North Macedonia | 99.4 /100 | #85 | Exceptional 8.5% |
| Alaskan Athabascans | 99.4 /100 | #86 | Exceptional 8.5% |
| Immigrants | Israel | 99.1 /100 | #87 | Exceptional 8.5% |
| Immigrants | Vietnam | 99.1 /100 | #88 | Exceptional 8.5% |
| Paiute | 99.1 /100 | #89 | Exceptional 8.5% |
| Yugoslavians | 99.0 /100 | #90 | Exceptional 8.5% |
| Immigrants | Eastern Europe | 99.0 /100 | #91 | Exceptional 8.5% |
| Potawatomi | 99.0 /100 | #92 | Exceptional 8.5% |
| Australians | 98.9 /100 | #93 | Exceptional 8.5% |
| Immigrants | Barbados | 98.8 /100 | #94 | Exceptional 8.5% |
| Sri Lankans | 98.7 /100 | #95 | Exceptional 8.5% |
| German Russians | 98.6 /100 | #96 | Exceptional 8.5% |
| Bolivians | 98.5 /100 | #97 | Exceptional 8.5% |
| Malaysians | 98.5 /100 | #98 | Exceptional 8.6% |
| Immigrants | Lithuania | 98.4 /100 | #99 | Exceptional 8.6% |
Demographics Similar to Finns by Unemployment Among Women with Children Ages 6 to 17 years
In terms of unemployment among women with children ages 6 to 17 years, the demographic groups most similar to Finns are Immigrants from Cuba (9.2%, a difference of 0.050%), Salvadoran (9.2%, a difference of 0.090%), Cuban (9.2%, a difference of 0.10%), Immigrants from Peru (9.2%, a difference of 0.10%), and Peruvian (9.2%, a difference of 0.13%).
| Demographics | Rating | Rank | Unemployment Among Women with Children Ages 6 to 17 years |
| Maltese | 15.3 /100 | #203 | Poor 9.1% |
| Immigrants | Canada | 15.3 /100 | #204 | Poor 9.1% |
| Immigrants | Western Europe | 14.1 /100 | #205 | Poor 9.1% |
| Immigrants | North America | 12.7 /100 | #206 | Poor 9.2% |
| Cubans | 10.9 /100 | #207 | Poor 9.2% |
| Immigrants | Peru | 10.8 /100 | #208 | Poor 9.2% |
| Salvadorans | 10.7 /100 | #209 | Poor 9.2% |
| Finns | 10.0 /100 | #210 | Tragic 9.2% |
| Immigrants | Cuba | 9.6 /100 | #211 | Tragic 9.2% |
| Peruvians | 9.0 /100 | #212 | Tragic 9.2% |
| Spaniards | 8.2 /100 | #213 | Tragic 9.2% |
| Iroquois | 7.5 /100 | #214 | Tragic 9.2% |
| Immigrants | Germany | 7.2 /100 | #215 | Tragic 9.2% |
| Immigrants | Uruguay | 7.2 /100 | #216 | Tragic 9.2% |
| Germans | 7.2 /100 | #217 | Tragic 9.2% |