Barbadian vs Immigrants from Serbia Unemployment Among Women with Children Ages 6 to 17 years
COMPARE
Barbadian
Immigrants from Serbia
Unemployment Among Women with Children Ages 6 to 17 years
Unemployment Among Women with Children Ages 6 to 17 years Comparison
Barbadians
Immigrants from Serbia
8.7%
UNEMPLOYMENT AMONG WOMEN WITH CHILDREN AGES 6 TO 17 YEARS
93.8/ 100
METRIC RATING
129th/ 347
METRIC RANK
8.6%
UNEMPLOYMENT AMONG WOMEN WITH CHILDREN AGES 6 TO 17 YEARS
97.7/ 100
METRIC RATING
106th/ 347
METRIC RANK
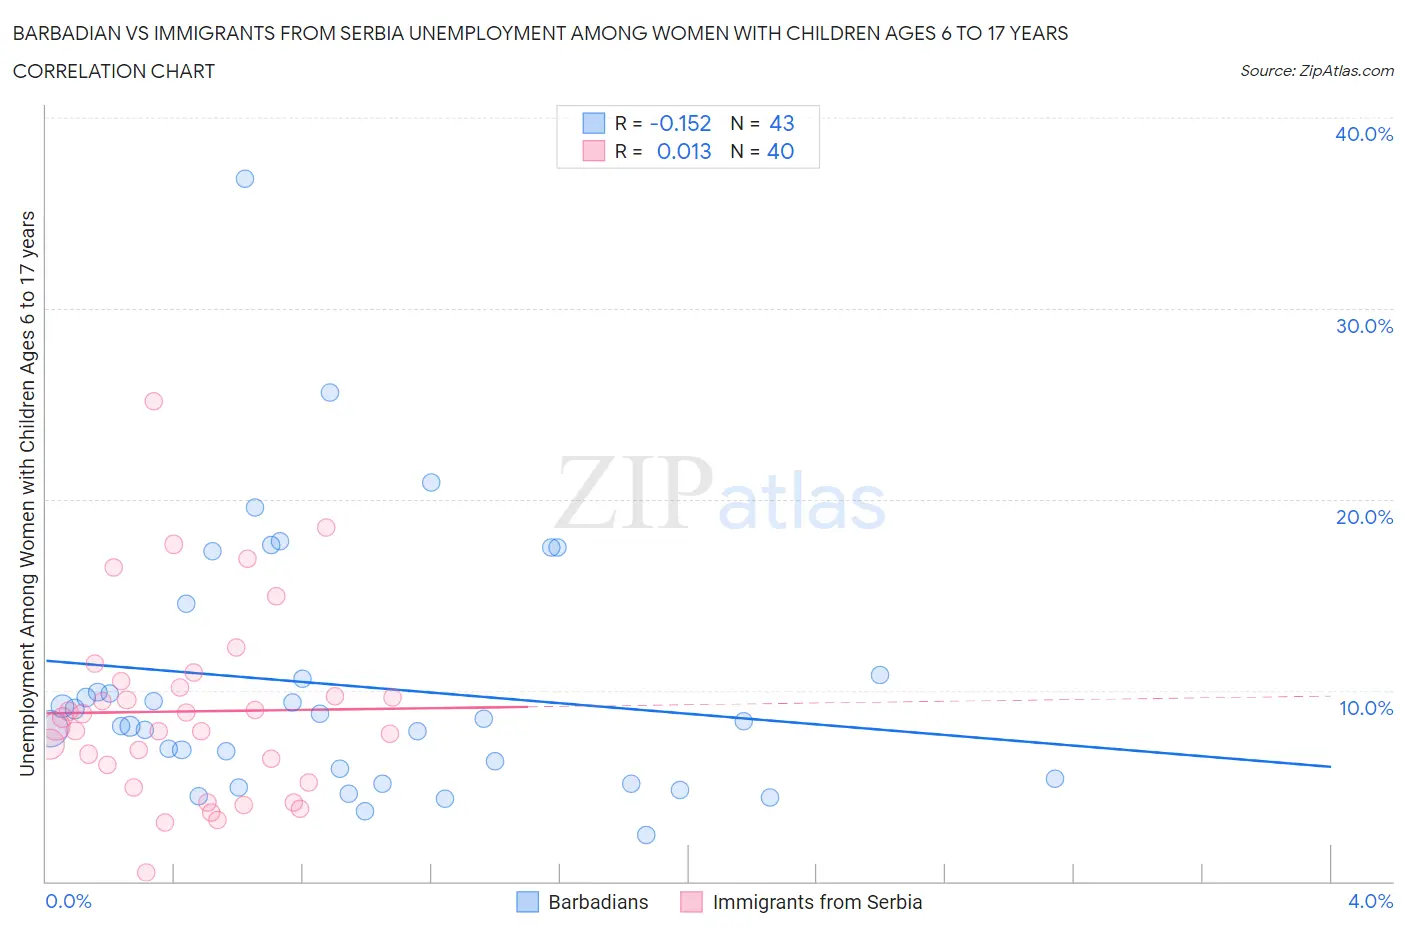
Barbadian vs Immigrants from Serbia Unemployment Among Women with Children Ages 6 to 17 years Correlation Chart
The statistical analysis conducted on geographies consisting of 121,323,299 people shows a poor negative correlation between the proportion of Barbadians and unemployment rate among women with children between the ages 6 and 17 in the United States with a correlation coefficient (R) of -0.152 and weighted average of 8.7%. Similarly, the statistical analysis conducted on geographies consisting of 109,738,992 people shows no correlation between the proportion of Immigrants from Serbia and unemployment rate among women with children between the ages 6 and 17 in the United States with a correlation coefficient (R) of 0.013 and weighted average of 8.6%, a difference of 1.2%.
Unemployment Among Women with Children Ages 6 to 17 years Correlation Summary
| Measurement | Barbadian | Immigrants from Serbia |
| Minimum | 2.4% | 0.44% |
| Maximum | 36.8% | 25.1% |
| Range | 34.4% | 24.7% |
| Mean | 10.2% | 8.9% |
| Median | 8.4% | 8.3% |
| Interquartile 25% (IQ1) | 5.4% | 5.6% |
| Interquartile 75% (IQ3) | 10.8% | 10.3% |
| Interquartile Range (IQR) | 5.4% | 4.7% |
| Standard Deviation (Sample) | 6.7% | 4.9% |
| Standard Deviation (Population) | 6.7% | 4.8% |
Similar Demographics by Unemployment Among Women with Children Ages 6 to 17 years
Demographics Similar to Barbadians by Unemployment Among Women with Children Ages 6 to 17 years
In terms of unemployment among women with children ages 6 to 17 years, the demographic groups most similar to Barbadians are Hmong (8.7%, a difference of 0.10%), Immigrants from Northern Africa (8.7%, a difference of 0.12%), Czech (8.7%, a difference of 0.12%), Immigrants from Western Asia (8.7%, a difference of 0.14%), and South African (8.7%, a difference of 0.15%).
| Demographics | Rating | Rank | Unemployment Among Women with Children Ages 6 to 17 years |
| Immigrants | Egypt | 95.0 /100 | #122 | Exceptional 8.7% |
| Immigrants | Morocco | 94.9 /100 | #123 | Exceptional 8.7% |
| Immigrants | Lebanon | 94.9 /100 | #124 | Exceptional 8.7% |
| South Africans | 94.6 /100 | #125 | Exceptional 8.7% |
| Immigrants | Northern Africa | 94.4 /100 | #126 | Exceptional 8.7% |
| Czechs | 94.4 /100 | #127 | Exceptional 8.7% |
| Hmong | 94.3 /100 | #128 | Exceptional 8.7% |
| Barbadians | 93.8 /100 | #129 | Exceptional 8.7% |
| Immigrants | Western Asia | 93.1 /100 | #130 | Exceptional 8.7% |
| Slavs | 92.2 /100 | #131 | Exceptional 8.7% |
| Yaqui | 92.2 /100 | #132 | Exceptional 8.7% |
| Egyptians | 91.8 /100 | #133 | Exceptional 8.7% |
| Immigrants | Ireland | 91.0 /100 | #134 | Exceptional 8.7% |
| Europeans | 90.6 /100 | #135 | Exceptional 8.7% |
| Immigrants | Latvia | 90.4 /100 | #136 | Exceptional 8.7% |
Demographics Similar to Immigrants from Serbia by Unemployment Among Women with Children Ages 6 to 17 years
In terms of unemployment among women with children ages 6 to 17 years, the demographic groups most similar to Immigrants from Serbia are Chickasaw (8.6%, a difference of 0.030%), Immigrants from Norway (8.6%, a difference of 0.040%), Swedish (8.6%, a difference of 0.040%), Immigrants from Romania (8.6%, a difference of 0.11%), and Latvian (8.6%, a difference of 0.12%).
| Demographics | Rating | Rank | Unemployment Among Women with Children Ages 6 to 17 years |
| Immigrants | Lithuania | 98.4 /100 | #99 | Exceptional 8.6% |
| New Zealanders | 98.4 /100 | #100 | Exceptional 8.6% |
| Immigrants | Pakistan | 98.4 /100 | #101 | Exceptional 8.6% |
| Immigrants | South Africa | 98.3 /100 | #102 | Exceptional 8.6% |
| Scandinavians | 98.3 /100 | #103 | Exceptional 8.6% |
| Immigrants | France | 98.0 /100 | #104 | Exceptional 8.6% |
| Immigrants | Norway | 97.8 /100 | #105 | Exceptional 8.6% |
| Immigrants | Serbia | 97.7 /100 | #106 | Exceptional 8.6% |
| Chickasaw | 97.6 /100 | #107 | Exceptional 8.6% |
| Swedes | 97.6 /100 | #108 | Exceptional 8.6% |
| Immigrants | Romania | 97.5 /100 | #109 | Exceptional 8.6% |
| Latvians | 97.4 /100 | #110 | Exceptional 8.6% |
| Immigrants | Ukraine | 97.4 /100 | #111 | Exceptional 8.6% |
| Romanians | 97.1 /100 | #112 | Exceptional 8.6% |
| Eastern Europeans | 96.8 /100 | #113 | Exceptional 8.6% |