Zip Codes with the Highest Percentage of Local Government Employees in Ponce, PR
RELATED REPORTS & OPTIONS
Local Government Employees
Ponce
Compare Zip Codes
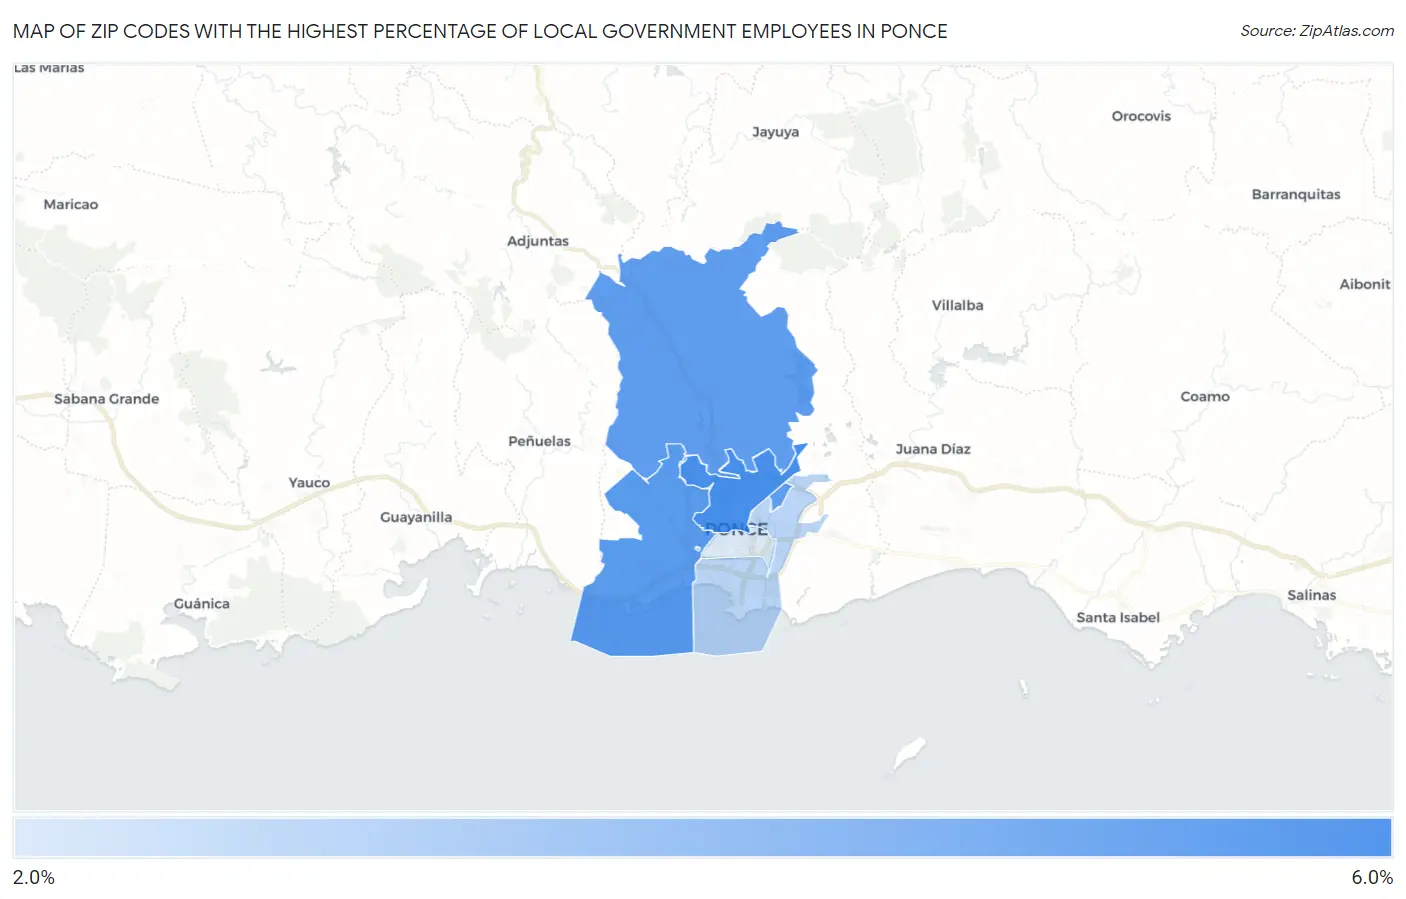
Map of Zip Codes with the Highest Percentage of Local Government Employees in Ponce
2.6%
5.5%
Zip Codes with the Highest Percentage of Local Government Employees in Ponce, PR
| Zip Code | % Local Government Employees | vs State | vs National | |
| 1. | 00730 | 5.5% | 5.6%(-0.057)#65 | 7.2%(-1.72)#21,462 |
| 2. | 00728 | 5.2% | 5.6%(-0.376)#71 | 7.2%(-2.04)#22,467 |
| 3. | 00731 | 5.0% | 5.6%(-0.517)#76 | 7.2%(-2.18)#22,887 |
| 4. | 00716 | 3.3% | 5.6%(-2.30)#110 | 7.2%(-3.96)#27,131 |
| 5. | 00717 | 2.6% | 5.6%(-2.97)#116 | 7.2%(-4.64)#28,082 |
1
Common Questions
What are the Top 3 Zip Codes with the Highest Percentage of Local Government Employees in Ponce, PR?
Top 3 Zip Codes with the Highest Percentage of Local Government Employees in Ponce, PR are:
What zip code has the Highest Percentage of Local Government Employees in Ponce, PR?
00730 has the Highest Percentage of Local Government Employees in Ponce, PR with 5.5%.
What is the Percentage of Local Government Employees in Ponce, PR?
Percentage of Local Government Employees in Ponce is 4.4%.
What is the Percentage of Local Government Employees in Puerto Rico?
Percentage of Local Government Employees in Puerto Rico is 5.6%.
What is the Percentage of Local Government Employees in the United States?
Percentage of Local Government Employees in the United States is 7.2%.