Tlingit-Haida vs African Child Poverty Under the Age of 5
COMPARE
Tlingit-Haida
African
Child Poverty Under the Age of 5
Child Poverty Under the Age of 5 Comparison
Tlingit-Haida
Africans
15.9%
CHILD POVERTY UNDER THE AGE OF 5
94.7/ 100
METRIC RATING
106th/ 347
METRIC RANK
22.8%
CHILD POVERTY UNDER THE AGE OF 5
0.0/ 100
METRIC RATING
310th/ 347
METRIC RANK
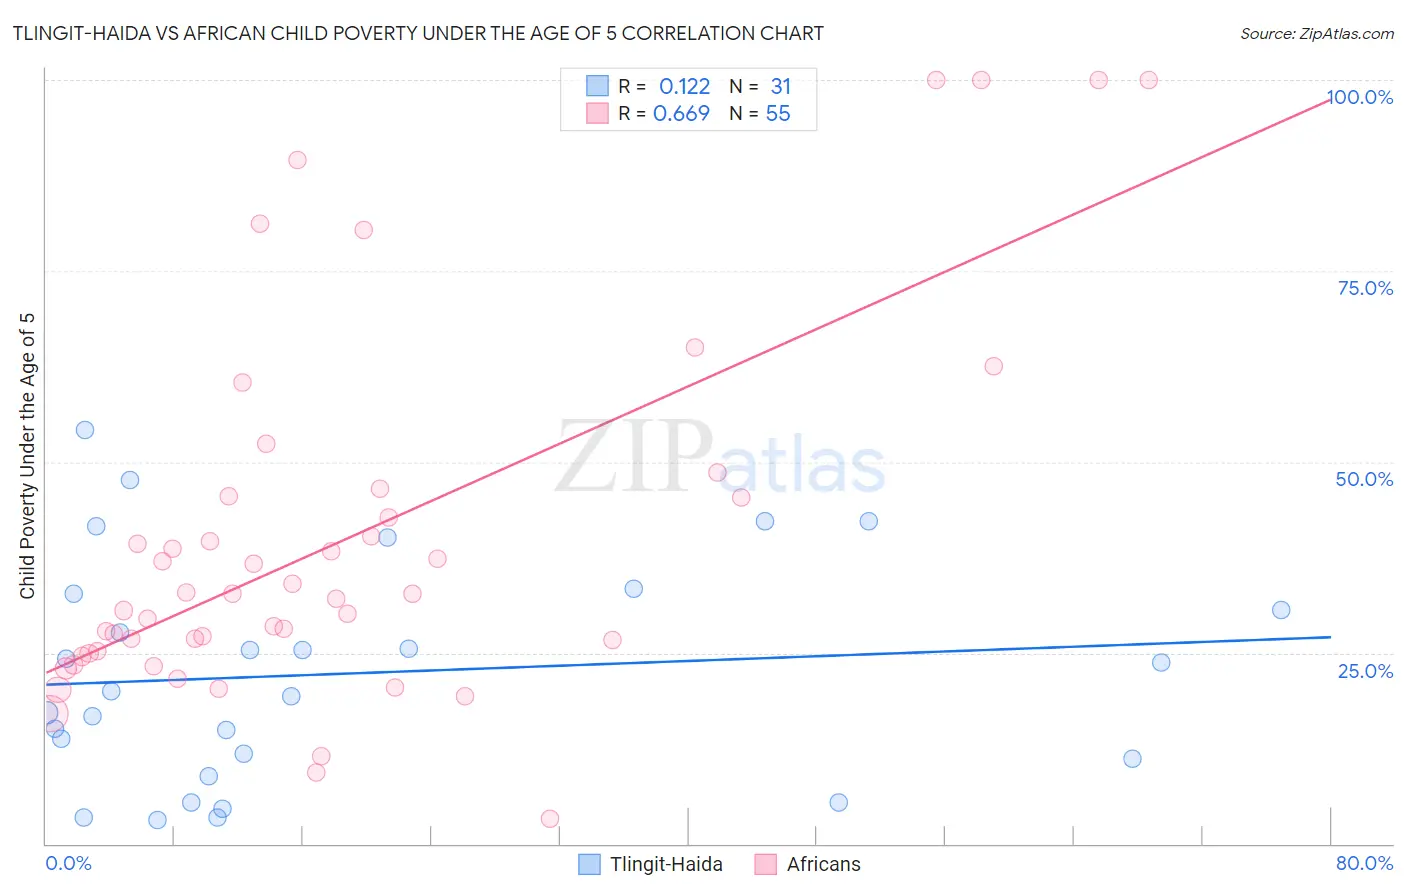
Tlingit-Haida vs African Child Poverty Under the Age of 5 Correlation Chart
The statistical analysis conducted on geographies consisting of 59,941,006 people shows a poor positive correlation between the proportion of Tlingit-Haida and poverty level among children under the age of 5 in the United States with a correlation coefficient (R) of 0.122 and weighted average of 15.9%. Similarly, the statistical analysis conducted on geographies consisting of 453,839,737 people shows a significant positive correlation between the proportion of Africans and poverty level among children under the age of 5 in the United States with a correlation coefficient (R) of 0.669 and weighted average of 22.8%, a difference of 43.1%.
Child Poverty Under the Age of 5 Correlation Summary
| Measurement | Tlingit-Haida | African |
| Minimum | 3.0% | 3.3% |
| Maximum | 54.2% | 100.0% |
| Range | 51.2% | 96.7% |
| Mean | 22.3% | 39.8% |
| Median | 20.0% | 32.7% |
| Interquartile 25% (IQ1) | 11.1% | 24.9% |
| Interquartile 75% (IQ3) | 32.8% | 45.5% |
| Interquartile Range (IQR) | 21.7% | 20.6% |
| Standard Deviation (Sample) | 14.3% | 24.0% |
| Standard Deviation (Population) | 14.1% | 23.7% |
Similar Demographics by Child Poverty Under the Age of 5
Demographics Similar to Tlingit-Haida by Child Poverty Under the Age of 5
In terms of child poverty under the age of 5, the demographic groups most similar to Tlingit-Haida are Immigrants from Spain (15.9%, a difference of 0.050%), Immigrants from North America (15.9%, a difference of 0.12%), Slovene (16.0%, a difference of 0.14%), Immigrants from Brazil (16.0%, a difference of 0.16%), and Northern European (16.0%, a difference of 0.24%).
| Demographics | Rating | Rank | Child Poverty Under the Age of 5 |
| Palestinians | 95.9 /100 | #99 | Exceptional 15.8% |
| Immigrants | Canada | 95.9 /100 | #100 | Exceptional 15.8% |
| Immigrants | Zimbabwe | 95.9 /100 | #101 | Exceptional 15.8% |
| Armenians | 95.7 /100 | #102 | Exceptional 15.8% |
| Europeans | 95.3 /100 | #103 | Exceptional 15.9% |
| Immigrants | North America | 94.9 /100 | #104 | Exceptional 15.9% |
| Immigrants | Spain | 94.8 /100 | #105 | Exceptional 15.9% |
| Tlingit-Haida | 94.7 /100 | #106 | Exceptional 15.9% |
| Slovenes | 94.4 /100 | #107 | Exceptional 16.0% |
| Immigrants | Brazil | 94.4 /100 | #108 | Exceptional 16.0% |
| Northern Europeans | 94.3 /100 | #109 | Exceptional 16.0% |
| Romanians | 94.3 /100 | #110 | Exceptional 16.0% |
| Pakistanis | 94.2 /100 | #111 | Exceptional 16.0% |
| Peruvians | 94.1 /100 | #112 | Exceptional 16.0% |
| Puget Sound Salish | 94.1 /100 | #113 | Exceptional 16.0% |
Demographics Similar to Africans by Child Poverty Under the Age of 5
In terms of child poverty under the age of 5, the demographic groups most similar to Africans are Seminole (22.8%, a difference of 0.050%), Houma (22.7%, a difference of 0.41%), Immigrants from Dominica (22.7%, a difference of 0.55%), Immigrants from Bahamas (22.7%, a difference of 0.59%), and Honduran (23.0%, a difference of 0.64%).
| Demographics | Rating | Rank | Child Poverty Under the Age of 5 |
| Inupiat | 0.0 /100 | #303 | Tragic 22.0% |
| Immigrants | Guatemala | 0.0 /100 | #304 | Tragic 22.0% |
| Immigrants | Mexico | 0.0 /100 | #305 | Tragic 22.2% |
| Indonesians | 0.0 /100 | #306 | Tragic 22.3% |
| Immigrants | Bahamas | 0.0 /100 | #307 | Tragic 22.7% |
| Immigrants | Dominica | 0.0 /100 | #308 | Tragic 22.7% |
| Houma | 0.0 /100 | #309 | Tragic 22.7% |
| Africans | 0.0 /100 | #310 | Tragic 22.8% |
| Seminole | 0.0 /100 | #311 | Tragic 22.8% |
| Hondurans | 0.0 /100 | #312 | Tragic 23.0% |
| Bahamians | 0.0 /100 | #313 | Tragic 23.0% |
| U.S. Virgin Islanders | 0.0 /100 | #314 | Tragic 23.0% |
| Arapaho | 0.0 /100 | #315 | Tragic 23.1% |
| Yakama | 0.0 /100 | #316 | Tragic 23.1% |
| Menominee | 0.0 /100 | #317 | Tragic 23.3% |