Scotch-Irish vs Immigrants from Guyana Family Poverty
COMPARE
Scotch-Irish
Immigrants from Guyana
Family Poverty
Family Poverty Comparison
Scotch-Irish
Immigrants from Guyana
8.6%
FAMILY POVERTY
82.2/ 100
METRIC RATING
148th/ 347
METRIC RANK
11.2%
FAMILY POVERTY
0.1/ 100
METRIC RATING
276th/ 347
METRIC RANK
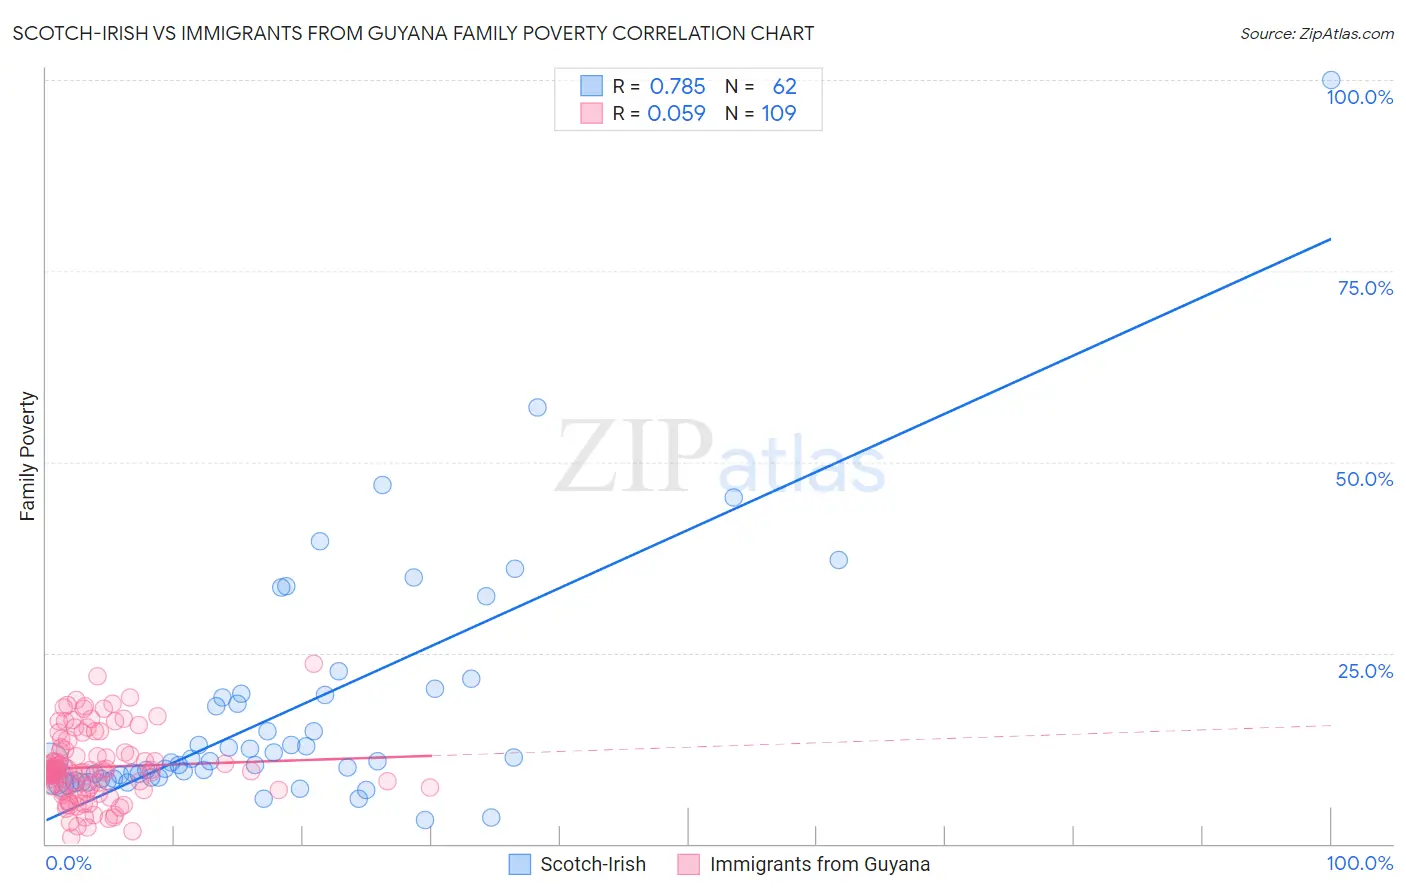
Scotch-Irish vs Immigrants from Guyana Family Poverty Correlation Chart
The statistical analysis conducted on geographies consisting of 545,166,810 people shows a strong positive correlation between the proportion of Scotch-Irish and poverty level among families in the United States with a correlation coefficient (R) of 0.785 and weighted average of 8.6%. Similarly, the statistical analysis conducted on geographies consisting of 183,364,556 people shows a slight positive correlation between the proportion of Immigrants from Guyana and poverty level among families in the United States with a correlation coefficient (R) of 0.059 and weighted average of 11.2%, a difference of 31.2%.
Family Poverty Correlation Summary
| Measurement | Scotch-Irish | Immigrants from Guyana |
| Minimum | 3.0% | 0.84% |
| Maximum | 100.0% | 23.6% |
| Range | 97.0% | 22.8% |
| Mean | 17.2% | 10.0% |
| Median | 10.8% | 9.6% |
| Interquartile 25% (IQ1) | 8.6% | 7.0% |
| Interquartile 75% (IQ3) | 19.4% | 12.5% |
| Interquartile Range (IQR) | 10.8% | 5.5% |
| Standard Deviation (Sample) | 15.9% | 4.6% |
| Standard Deviation (Population) | 15.7% | 4.6% |
Similar Demographics by Family Poverty
Demographics Similar to Scotch-Irish by Family Poverty
In terms of family poverty, the demographic groups most similar to Scotch-Irish are Immigrants from Jordan (8.5%, a difference of 0.21%), Immigrants from Belarus (8.5%, a difference of 0.24%), Immigrants from South Eastern Asia (8.5%, a difference of 0.25%), Albanian (8.5%, a difference of 0.27%), and Immigrants from Germany (8.5%, a difference of 0.29%).
| Demographics | Rating | Rank | Family Poverty |
| Immigrants | Ukraine | 83.9 /100 | #141 | Excellent 8.5% |
| Yugoslavians | 83.5 /100 | #142 | Excellent 8.5% |
| Immigrants | Germany | 83.3 /100 | #143 | Excellent 8.5% |
| Albanians | 83.3 /100 | #144 | Excellent 8.5% |
| Immigrants | South Eastern Asia | 83.2 /100 | #145 | Excellent 8.5% |
| Immigrants | Belarus | 83.2 /100 | #146 | Excellent 8.5% |
| Immigrants | Jordan | 83.0 /100 | #147 | Excellent 8.5% |
| Scotch-Irish | 82.2 /100 | #148 | Excellent 8.6% |
| Mongolians | 80.4 /100 | #149 | Excellent 8.6% |
| Syrians | 80.3 /100 | #150 | Excellent 8.6% |
| Brazilians | 80.1 /100 | #151 | Excellent 8.6% |
| Samoans | 79.8 /100 | #152 | Good 8.6% |
| Immigrants | Spain | 79.1 /100 | #153 | Good 8.6% |
| Immigrants | Vietnam | 75.4 /100 | #154 | Good 8.7% |
| Immigrants | Kuwait | 73.6 /100 | #155 | Good 8.7% |
Demographics Similar to Immigrants from Guyana by Family Poverty
In terms of family poverty, the demographic groups most similar to Immigrants from Guyana are Central American (11.2%, a difference of 0.020%), Spanish American (11.2%, a difference of 0.070%), Chippewa (11.2%, a difference of 0.090%), Guyanese (11.2%, a difference of 0.12%), and Somali (11.2%, a difference of 0.16%).
| Demographics | Rating | Rank | Family Poverty |
| Immigrants | Ecuador | 0.1 /100 | #269 | Tragic 11.1% |
| Immigrants | Nicaragua | 0.1 /100 | #270 | Tragic 11.1% |
| Immigrants | Bahamas | 0.1 /100 | #271 | Tragic 11.1% |
| Immigrants | Jamaica | 0.1 /100 | #272 | Tragic 11.2% |
| Somalis | 0.1 /100 | #273 | Tragic 11.2% |
| Spanish Americans | 0.1 /100 | #274 | Tragic 11.2% |
| Central Americans | 0.1 /100 | #275 | Tragic 11.2% |
| Immigrants | Guyana | 0.1 /100 | #276 | Tragic 11.2% |
| Chippewa | 0.1 /100 | #277 | Tragic 11.2% |
| Guyanese | 0.1 /100 | #278 | Tragic 11.2% |
| Blackfeet | 0.0 /100 | #279 | Tragic 11.3% |
| Belizeans | 0.0 /100 | #280 | Tragic 11.3% |
| Immigrants | West Indies | 0.0 /100 | #281 | Tragic 11.3% |
| Immigrants | Cuba | 0.0 /100 | #282 | Tragic 11.3% |
| Indonesians | 0.0 /100 | #283 | Tragic 11.3% |