Dutch vs Immigrants from Japan Receiving Food Stamps
COMPARE
Dutch
Immigrants from Japan
Receiving Food Stamps
Receiving Food Stamps Comparison
Dutch
Immigrants from Japan
10.0%
RECEIVING FOOD STAMPS
98.6/ 100
METRIC RATING
83rd/ 347
METRIC RANK
9.0%
RECEIVING FOOD STAMPS
99.9/ 100
METRIC RATING
16th/ 347
METRIC RANK
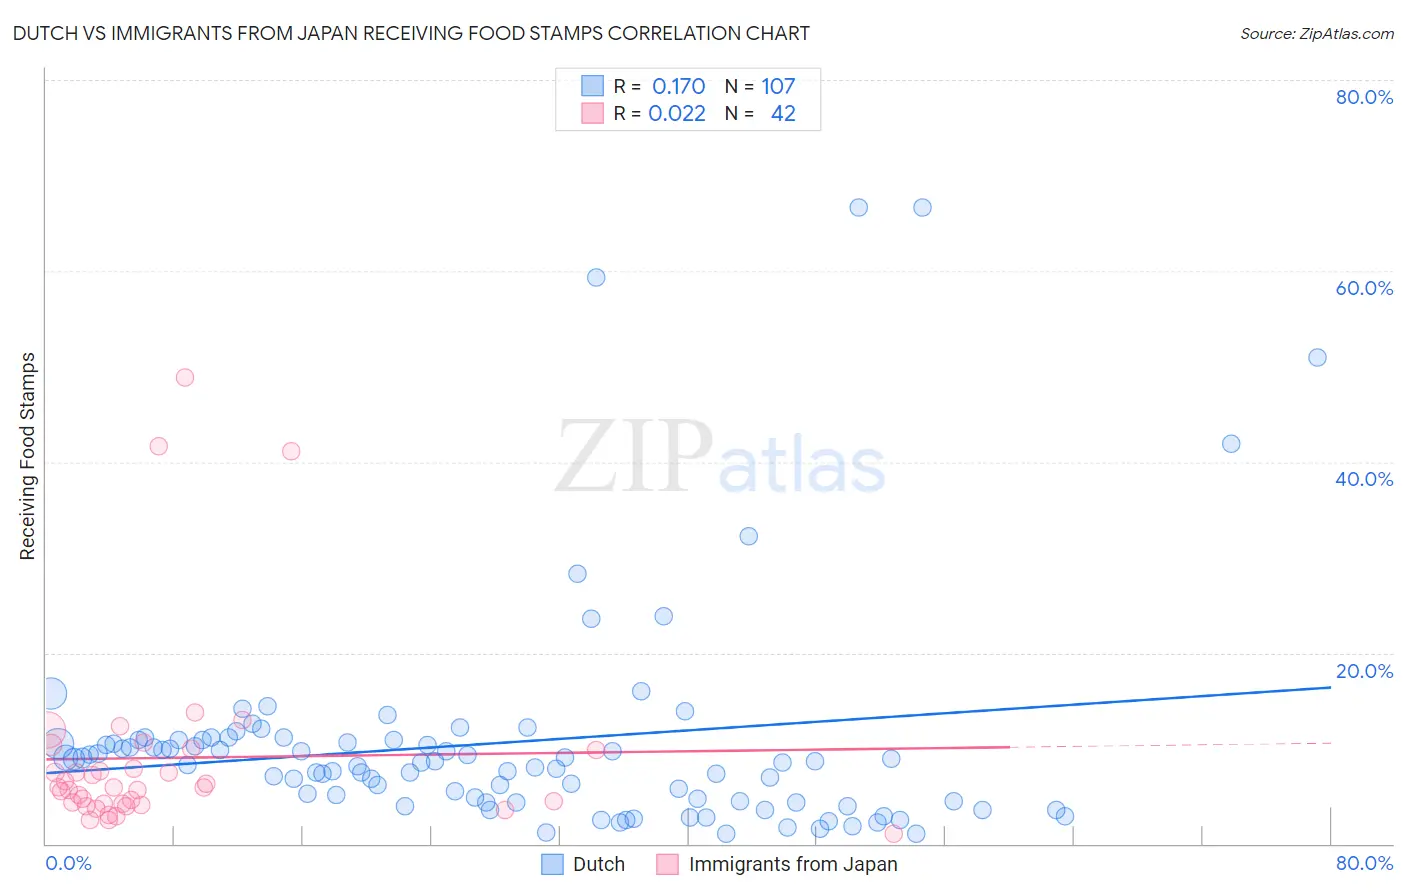
Dutch vs Immigrants from Japan Receiving Food Stamps Correlation Chart
The statistical analysis conducted on geographies consisting of 551,299,483 people shows a poor positive correlation between the proportion of Dutch and percentage of population receiving government assistance and/or food stamps in the United States with a correlation coefficient (R) of 0.170 and weighted average of 10.0%. Similarly, the statistical analysis conducted on geographies consisting of 339,298,803 people shows no correlation between the proportion of Immigrants from Japan and percentage of population receiving government assistance and/or food stamps in the United States with a correlation coefficient (R) of 0.022 and weighted average of 9.0%, a difference of 11.3%.
Receiving Food Stamps Correlation Summary
| Measurement | Dutch | Immigrants from Japan |
| Minimum | 0.99% | 1.0% |
| Maximum | 66.7% | 48.9% |
| Range | 65.7% | 47.9% |
| Mean | 10.6% | 9.0% |
| Median | 8.5% | 5.9% |
| Interquartile 25% (IQ1) | 4.5% | 4.2% |
| Interquartile 75% (IQ3) | 10.8% | 9.8% |
| Interquartile Range (IQR) | 6.3% | 5.6% |
| Standard Deviation (Sample) | 11.8% | 10.3% |
| Standard Deviation (Population) | 11.7% | 10.2% |
Similar Demographics by Receiving Food Stamps
Demographics Similar to Dutch by Receiving Food Stamps
In terms of receiving food stamps, the demographic groups most similar to Dutch are Austrian (10.0%, a difference of 0.0%), Immigrants from Israel (10.0%, a difference of 0.070%), Immigrants from England (10.0%, a difference of 0.13%), Immigrants from Romania (10.0%, a difference of 0.25%), and Polish (10.0%, a difference of 0.27%).
| Demographics | Rating | Rank | Receiving Food Stamps |
| Immigrants | Croatia | 98.7 /100 | #76 | Exceptional 10.0% |
| Immigrants | North Macedonia | 98.7 /100 | #77 | Exceptional 10.0% |
| South Africans | 98.7 /100 | #78 | Exceptional 10.0% |
| Laotians | 98.7 /100 | #79 | Exceptional 10.0% |
| Poles | 98.6 /100 | #80 | Exceptional 10.0% |
| Immigrants | England | 98.6 /100 | #81 | Exceptional 10.0% |
| Austrians | 98.6 /100 | #82 | Exceptional 10.0% |
| Dutch | 98.6 /100 | #83 | Exceptional 10.0% |
| Immigrants | Israel | 98.5 /100 | #84 | Exceptional 10.0% |
| Immigrants | Romania | 98.5 /100 | #85 | Exceptional 10.0% |
| Immigrants | Norway | 98.4 /100 | #86 | Exceptional 10.0% |
| Egyptians | 98.4 /100 | #87 | Exceptional 10.0% |
| Immigrants | Kuwait | 98.4 /100 | #88 | Exceptional 10.0% |
| Immigrants | France | 98.3 /100 | #89 | Exceptional 10.1% |
| Finns | 97.9 /100 | #90 | Exceptional 10.2% |
Demographics Similar to Immigrants from Japan by Receiving Food Stamps
In terms of receiving food stamps, the demographic groups most similar to Immigrants from Japan are Immigrants from Scotland (9.0%, a difference of 0.15%), Norwegian (9.0%, a difference of 0.27%), Danish (9.0%, a difference of 0.61%), Maltese (8.9%, a difference of 0.93%), and Bulgarian (8.9%, a difference of 1.1%).
| Demographics | Rating | Rank | Receiving Food Stamps |
| Immigrants | Korea | 99.9 /100 | #9 | Exceptional 8.7% |
| Immigrants | South Central Asia | 99.9 /100 | #10 | Exceptional 8.8% |
| Okinawans | 99.9 /100 | #11 | Exceptional 8.9% |
| Cypriots | 99.9 /100 | #12 | Exceptional 8.9% |
| Bulgarians | 99.9 /100 | #13 | Exceptional 8.9% |
| Maltese | 99.9 /100 | #14 | Exceptional 8.9% |
| Norwegians | 99.9 /100 | #15 | Exceptional 9.0% |
| Immigrants | Japan | 99.9 /100 | #16 | Exceptional 9.0% |
| Immigrants | Scotland | 99.9 /100 | #17 | Exceptional 9.0% |
| Danes | 99.9 /100 | #18 | Exceptional 9.0% |
| Immigrants | Hong Kong | 99.8 /100 | #19 | Exceptional 9.1% |
| Latvians | 99.8 /100 | #20 | Exceptional 9.1% |
| Luxembourgers | 99.8 /100 | #21 | Exceptional 9.1% |
| Immigrants | Australia | 99.8 /100 | #22 | Exceptional 9.2% |
| Eastern Europeans | 99.8 /100 | #23 | Exceptional 9.2% |