Dutch vs Immigrants from Cuba Receiving Food Stamps
COMPARE
Dutch
Immigrants from Cuba
Receiving Food Stamps
Receiving Food Stamps Comparison
Dutch
Immigrants from Cuba
10.0%
RECEIVING FOOD STAMPS
98.6/ 100
METRIC RATING
83rd/ 347
METRIC RANK
20.8%
RECEIVING FOOD STAMPS
0.0/ 100
METRIC RATING
335th/ 347
METRIC RANK
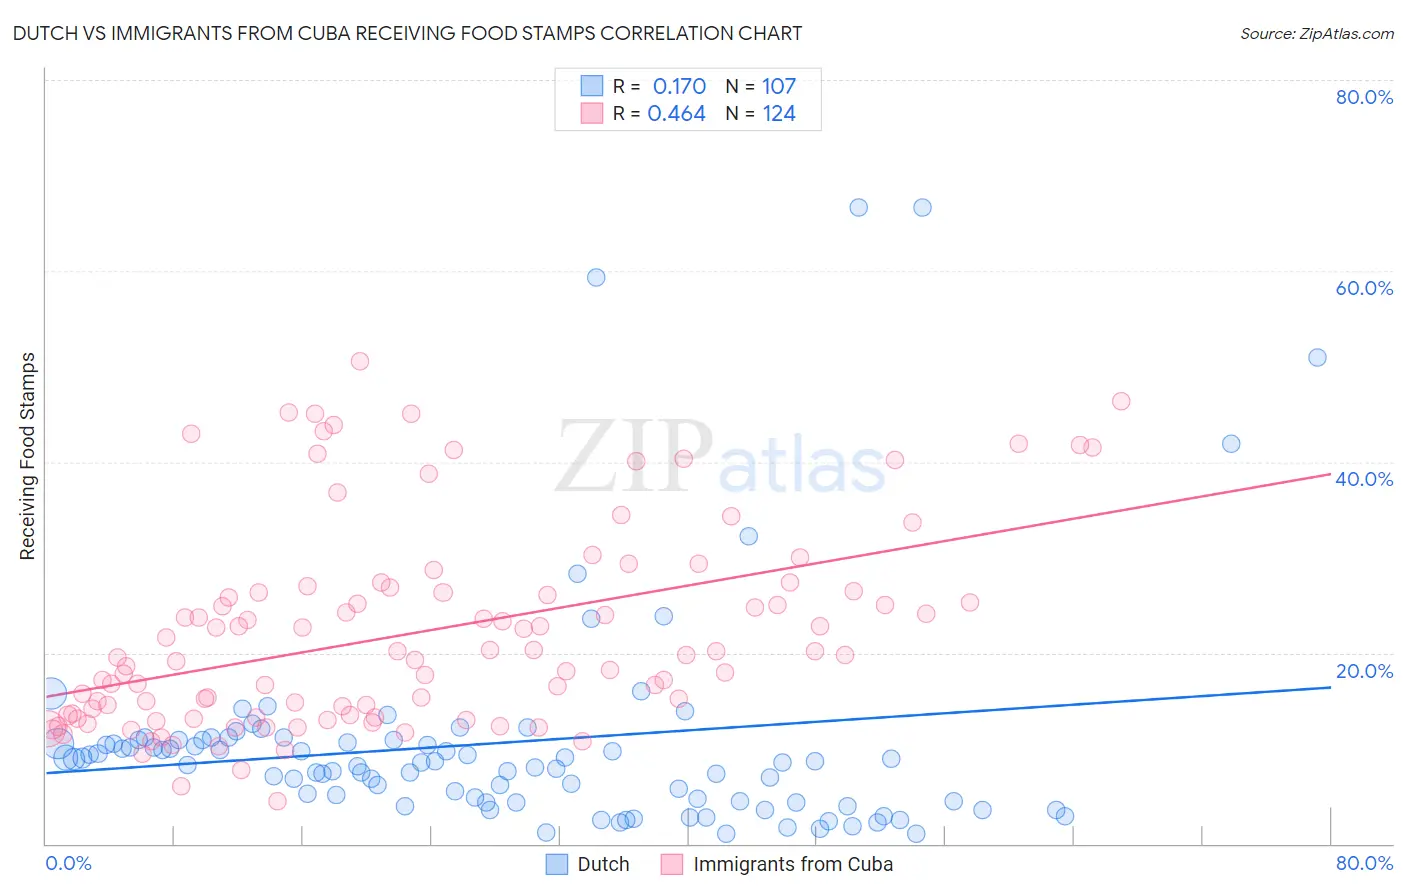
Dutch vs Immigrants from Cuba Receiving Food Stamps Correlation Chart
The statistical analysis conducted on geographies consisting of 551,299,483 people shows a poor positive correlation between the proportion of Dutch and percentage of population receiving government assistance and/or food stamps in the United States with a correlation coefficient (R) of 0.170 and weighted average of 10.0%. Similarly, the statistical analysis conducted on geographies consisting of 325,340,789 people shows a moderate positive correlation between the proportion of Immigrants from Cuba and percentage of population receiving government assistance and/or food stamps in the United States with a correlation coefficient (R) of 0.464 and weighted average of 20.8%, a difference of 108.1%.
Receiving Food Stamps Correlation Summary
| Measurement | Dutch | Immigrants from Cuba |
| Minimum | 0.99% | 4.5% |
| Maximum | 66.7% | 50.6% |
| Range | 65.7% | 46.1% |
| Mean | 10.6% | 22.1% |
| Median | 8.5% | 19.8% |
| Interquartile 25% (IQ1) | 4.5% | 13.5% |
| Interquartile 75% (IQ3) | 10.8% | 26.4% |
| Interquartile Range (IQR) | 6.3% | 12.9% |
| Standard Deviation (Sample) | 11.8% | 10.5% |
| Standard Deviation (Population) | 11.7% | 10.4% |
Similar Demographics by Receiving Food Stamps
Demographics Similar to Dutch by Receiving Food Stamps
In terms of receiving food stamps, the demographic groups most similar to Dutch are Austrian (10.0%, a difference of 0.0%), Immigrants from Israel (10.0%, a difference of 0.070%), Immigrants from England (10.0%, a difference of 0.13%), Immigrants from Romania (10.0%, a difference of 0.25%), and Polish (10.0%, a difference of 0.27%).
| Demographics | Rating | Rank | Receiving Food Stamps |
| Immigrants | Croatia | 98.7 /100 | #76 | Exceptional 10.0% |
| Immigrants | North Macedonia | 98.7 /100 | #77 | Exceptional 10.0% |
| South Africans | 98.7 /100 | #78 | Exceptional 10.0% |
| Laotians | 98.7 /100 | #79 | Exceptional 10.0% |
| Poles | 98.6 /100 | #80 | Exceptional 10.0% |
| Immigrants | England | 98.6 /100 | #81 | Exceptional 10.0% |
| Austrians | 98.6 /100 | #82 | Exceptional 10.0% |
| Dutch | 98.6 /100 | #83 | Exceptional 10.0% |
| Immigrants | Israel | 98.5 /100 | #84 | Exceptional 10.0% |
| Immigrants | Romania | 98.5 /100 | #85 | Exceptional 10.0% |
| Immigrants | Norway | 98.4 /100 | #86 | Exceptional 10.0% |
| Egyptians | 98.4 /100 | #87 | Exceptional 10.0% |
| Immigrants | Kuwait | 98.4 /100 | #88 | Exceptional 10.0% |
| Immigrants | France | 98.3 /100 | #89 | Exceptional 10.1% |
| Finns | 97.9 /100 | #90 | Exceptional 10.2% |
Demographics Similar to Immigrants from Cuba by Receiving Food Stamps
In terms of receiving food stamps, the demographic groups most similar to Immigrants from Cuba are Navajo (21.1%, a difference of 1.1%), Cape Verdean (21.1%, a difference of 1.2%), Dominican (21.4%, a difference of 2.6%), Yakama (21.4%, a difference of 2.9%), and Yuman (20.2%, a difference of 2.9%).
| Demographics | Rating | Rank | Receiving Food Stamps |
| Colville | 0.0 /100 | #328 | Tragic 18.3% |
| Immigrants | Dominica | 0.0 /100 | #329 | Tragic 18.4% |
| Pima | 0.0 /100 | #330 | Tragic 19.0% |
| Immigrants | Caribbean | 0.0 /100 | #331 | Tragic 19.6% |
| Pueblo | 0.0 /100 | #332 | Tragic 19.9% |
| Inupiat | 0.0 /100 | #333 | Tragic 20.1% |
| Yuman | 0.0 /100 | #334 | Tragic 20.2% |
| Immigrants | Cuba | 0.0 /100 | #335 | Tragic 20.8% |
| Navajo | 0.0 /100 | #336 | Tragic 21.1% |
| Cape Verdeans | 0.0 /100 | #337 | Tragic 21.1% |
| Dominicans | 0.0 /100 | #338 | Tragic 21.4% |
| Yakama | 0.0 /100 | #339 | Tragic 21.4% |
| Tohono O'odham | 0.0 /100 | #340 | Tragic 21.5% |
| Hopi | 0.0 /100 | #341 | Tragic 21.6% |
| Immigrants | Yemen | 0.0 /100 | #342 | Tragic 21.6% |