Immigrants from Kenya vs Inupiat Poverty
COMPARE
Immigrants from Kenya
Inupiat
Poverty
Poverty Comparison
Immigrants from Kenya
Inupiat
12.8%
POVERTY
17.5/ 100
METRIC RATING
199th/ 347
METRIC RANK
15.1%
POVERTY
0.0/ 100
METRIC RATING
287th/ 347
METRIC RANK
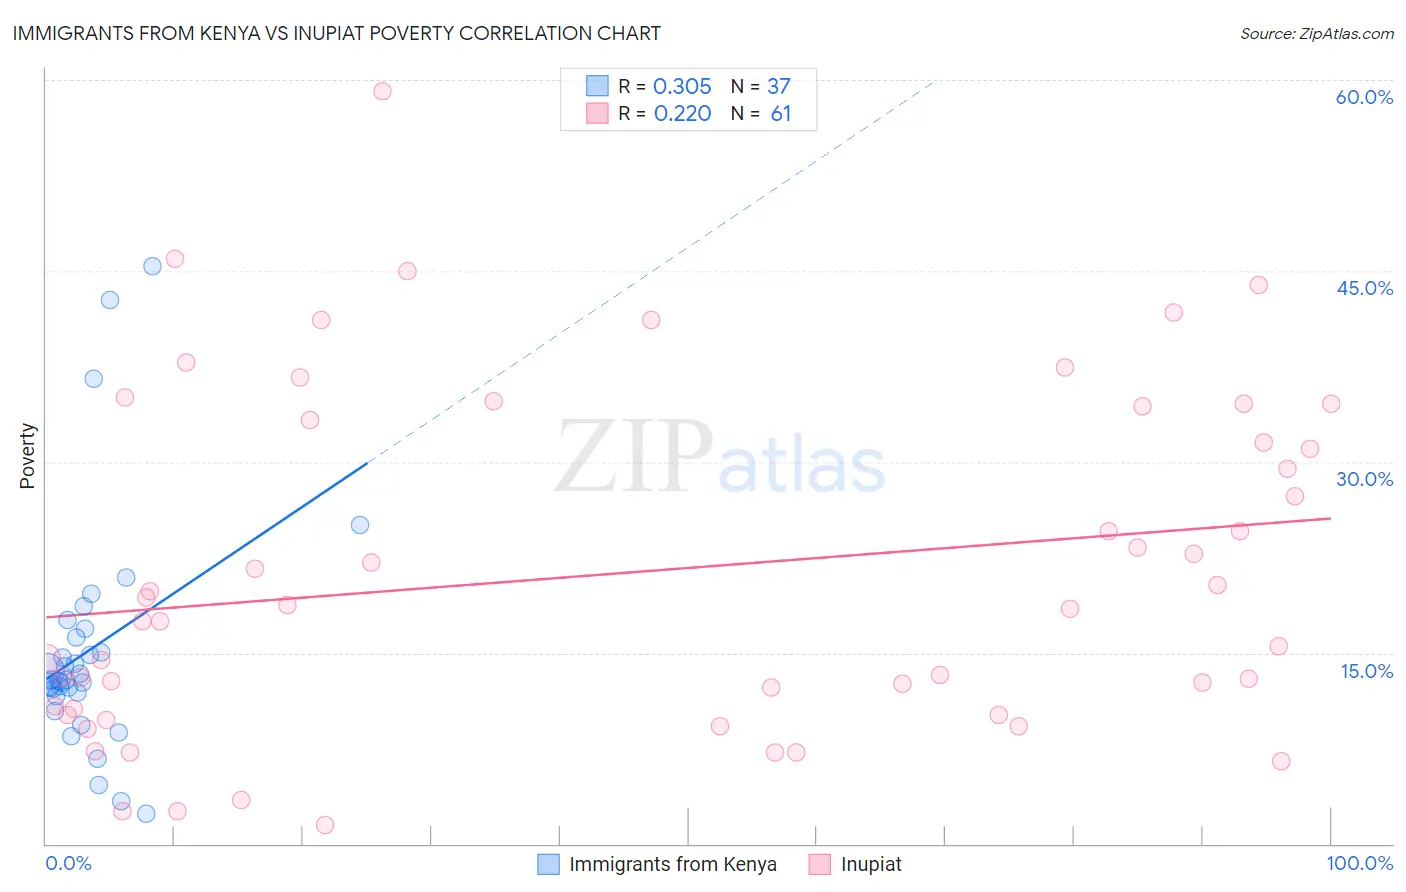
Immigrants from Kenya vs Inupiat Poverty Correlation Chart
The statistical analysis conducted on geographies consisting of 217,998,097 people shows a mild positive correlation between the proportion of Immigrants from Kenya and poverty level in the United States with a correlation coefficient (R) of 0.305 and weighted average of 12.8%. Similarly, the statistical analysis conducted on geographies consisting of 96,319,332 people shows a weak positive correlation between the proportion of Inupiat and poverty level in the United States with a correlation coefficient (R) of 0.220 and weighted average of 15.1%, a difference of 17.9%.
Poverty Correlation Summary
| Measurement | Immigrants from Kenya | Inupiat |
| Minimum | 2.4% | 1.4% |
| Maximum | 45.4% | 59.1% |
| Range | 43.0% | 57.7% |
| Mean | 15.2% | 21.3% |
| Median | 12.9% | 18.4% |
| Interquartile 25% (IQ1) | 11.7% | 10.3% |
| Interquartile 75% (IQ3) | 16.6% | 33.9% |
| Interquartile Range (IQR) | 4.8% | 23.5% |
| Standard Deviation (Sample) | 9.2% | 13.3% |
| Standard Deviation (Population) | 9.0% | 13.2% |
Similar Demographics by Poverty
Demographics Similar to Immigrants from Kenya by Poverty
In terms of poverty, the demographic groups most similar to Immigrants from Kenya are Spaniard (12.8%, a difference of 0.16%), Immigrants from Uganda (12.8%, a difference of 0.16%), Spanish (12.8%, a difference of 0.19%), Immigrants from Lebanon (12.8%, a difference of 0.20%), and Immigrants from Uruguay (12.8%, a difference of 0.32%).
| Demographics | Rating | Rank | Poverty |
| South American Indians | 23.3 /100 | #192 | Fair 12.7% |
| Delaware | 21.4 /100 | #193 | Fair 12.7% |
| Arabs | 21.1 /100 | #194 | Fair 12.7% |
| Immigrants | Kuwait | 20.9 /100 | #195 | Fair 12.7% |
| Iraqis | 20.8 /100 | #196 | Fair 12.7% |
| Immigrants | Lebanon | 18.7 /100 | #197 | Poor 12.8% |
| Spanish | 18.7 /100 | #198 | Poor 12.8% |
| Immigrants | Kenya | 17.5 /100 | #199 | Poor 12.8% |
| Spaniards | 16.5 /100 | #200 | Poor 12.8% |
| Immigrants | Uganda | 16.5 /100 | #201 | Poor 12.8% |
| Immigrants | Uruguay | 15.6 /100 | #202 | Poor 12.8% |
| Hmong | 15.0 /100 | #203 | Poor 12.8% |
| Immigrants | Western Asia | 14.1 /100 | #204 | Poor 12.9% |
| Tsimshian | 9.2 /100 | #205 | Tragic 13.0% |
| Immigrants | Eastern Africa | 7.0 /100 | #206 | Tragic 13.1% |
Demographics Similar to Inupiat by Poverty
In terms of poverty, the demographic groups most similar to Inupiat are Yaqui (15.1%, a difference of 0.010%), Immigrants from Belize (15.1%, a difference of 0.13%), Immigrants from Latin America (15.0%, a difference of 0.21%), Mexican (15.1%, a difference of 0.23%), and Immigrants from Cabo Verde (15.1%, a difference of 0.36%).
| Demographics | Rating | Rank | Poverty |
| Haitians | 0.0 /100 | #280 | Tragic 14.9% |
| Immigrants | Barbados | 0.0 /100 | #281 | Tragic 14.9% |
| Comanche | 0.0 /100 | #282 | Tragic 15.0% |
| Immigrants | Haiti | 0.0 /100 | #283 | Tragic 15.0% |
| West Indians | 0.0 /100 | #284 | Tragic 15.0% |
| Vietnamese | 0.0 /100 | #285 | Tragic 15.0% |
| Immigrants | Latin America | 0.0 /100 | #286 | Tragic 15.0% |
| Inupiat | 0.0 /100 | #287 | Tragic 15.1% |
| Yaqui | 0.0 /100 | #288 | Tragic 15.1% |
| Immigrants | Belize | 0.0 /100 | #289 | Tragic 15.1% |
| Mexicans | 0.0 /100 | #290 | Tragic 15.1% |
| Immigrants | Cabo Verde | 0.0 /100 | #291 | Tragic 15.1% |
| Indonesians | 0.0 /100 | #292 | Tragic 15.1% |
| Immigrants | Zaire | 0.0 /100 | #293 | Tragic 15.1% |
| Blackfeet | 0.0 /100 | #294 | Tragic 15.2% |