Immigrants from Australia vs Inupiat Poverty

COMPARE

Immigrants from Australia
Race
Ancestry
AfghanAfricanAlaska NativeAlaskan AthabascanAlbanianAleutAlsatianAmericanApacheArabArapahoArgentineanArmenianAssyrian/Chaldean/SyriacAustralianAustrianBahamianBangladeshiBarbadianBasqueBelgianBelizeanBermudanBhutaneseBlackfeetBolivianBrazilianBritishBritish West IndianBulgarianBurmeseCajunCambodianCanadianCape VerdeanCarpatho RusynCelticCentral AmericanCentral American IndianCherokeeCheyenneChickasawChileanChineseChippewaChoctawColombianColvilleComancheCosta RicanCreeCreekCroatianCrowCubanCypriotCzechCzechoslovakianDanishDelawareDominicanDutchDutch West IndianEastern EuropeanEcuadorianEgyptianEnglishEstonianEthiopianEuropeanFijianFilipinoFinnishFrenchFrench American IndianFrench CanadianGermanGerman RussianGhanaianGreekGuamanian/ChamorroGuatemalanGuyaneseHaitianHmongHonduranHopiHoumaHungarianIcelanderIndian (Asian)IndonesianIranianIraqiIrishIroquoisIsraeliItalianJamaicanJapaneseJordanianKenyanKiowaKoreanLaotianLatvianLebaneseLiberianLithuanianLumbeeLuxembourgerMacedonianMalaysianMalteseMarshalleseMenomineeMexicanMexican American IndianMongolianMoroccanNative HawaiianNavajoNepaleseNew ZealanderNicaraguanNigerianNorthern EuropeanNorwegianOkinawanOsageOttawaPaiutePakistaniPalestinianPanamanianParaguayanPennsylvania GermanPeruvianPimaPolishPortuguesePotawatomiPuebloPuerto RicanPuget Sound SalishRomanianRussianSalvadoranSamoanScandinavianScotch-IrishScottishSeminoleSenegaleseSerbianShoshoneSierra LeoneanSiouxSlavicSlovakSloveneSomaliSouth AfricanSouth AmericanSouth American IndianSoviet UnionSpaniardSpanishSpanish AmericanSpanish American IndianSri LankanSubsaharan AfricanSudaneseSwedishSwissSyrianTaiwaneseThaiTlingit-HaidaTohono O'OdhamTonganTrinidadian and TobagonianTsimshianTurkishU.S. Virgin IslanderUgandanUkrainianUruguayanUteVenezuelanVietnameseWelshWest IndianYakamaYaquiYugoslavianYumanYup'ikZimbabwean
Immigration
NonimmigrantsImmigrantsAfghanistanAfricaAlbaniaArgentinaArmeniaAsiaAustraliaAustriaBahamasBangladeshBarbadosBelarusBelgiumBelizeBoliviaBosnia and HerzegovinaBrazilBulgariaBurma/MyanmarCabo VerdeCambodiaCameroonCanadaCaribbeanCentral AmericaChileChinaColombiaCongoCosta RicaCroatiaCubaCzechoslovakiaDenmarkDominicaDominican RepublicEastern AfricaEastern AsiaEastern EuropeEcuadorEgyptEl SalvadorEnglandEritreaEthiopiaEuropeFijiFranceGermanyGhanaGreeceGrenadaGuatemalaGuyanaHaitiHondurasHong KongHungaryIndiaIndonesiaIranIraqIrelandIsraelItalyJamaicaJapanJordanKazakhstanKenyaKoreaKuwaitLaosLatin AmericaLatviaLebanonLiberiaLithuaniaMalaysiaMexicoMicronesiaMiddle AfricaMoldovaMoroccoNepalNetherlandsNicaraguaNigeriaNorth AmericaNorth MacedoniaNorthern AfricaNorthern EuropeNorwayOceaniaPakistanPanamaPeruPhilippinesPolandPortugalRomaniaRussiaSaudi ArabiaScotlandSenegalSerbiaSierra LeoneSingaporeSomaliaSouth AfricaSouth AmericaSouth Central AsiaSouth Eastern AsiaSouthern EuropeSpainSri LankaSt. Vincent and the GrenadinesSudanSwedenSwitzerlandSyriaTaiwanThailandTrinidad and TobagoTurkeyUgandaUkraineUruguayUzbekistanVenezuelaVietnamWest IndiesWestern AfricaWestern AsiaWestern EuropeYemenZaireZimbabweAzores
Inupiat
Race
Ancestry
AfghanAfricanAlaska NativeAlaskan AthabascanAlbanianAleutAlsatianAmericanApacheArabArapahoArgentineanArmenianAssyrian/Chaldean/SyriacAustralianAustrianBahamianBangladeshiBarbadianBasqueBelgianBelizeanBermudanBhutaneseBlackfeetBolivianBrazilianBritishBritish West IndianBulgarianBurmeseCajunCambodianCanadianCape VerdeanCarpatho RusynCelticCentral AmericanCentral American IndianCherokeeCheyenneChickasawChileanChineseChippewaChoctawColombianColvilleComancheCosta RicanCreeCreekCroatianCrowCubanCypriotCzechCzechoslovakianDanishDelawareDominicanDutchDutch West IndianEastern EuropeanEcuadorianEgyptianEnglishEstonianEthiopianEuropeanFijianFilipinoFinnishFrenchFrench American IndianFrench CanadianGermanGerman RussianGhanaianGreekGuamanian/ChamorroGuatemalanGuyaneseHaitianHmongHonduranHopiHoumaHungarianIcelanderIndian (Asian)IndonesianInupiatIranianIraqiIrishIroquoisIsraeliItalianJamaicanJapaneseJordanianKenyanKiowaKoreanLaotianLatvianLebaneseLiberianLithuanianLumbeeLuxembourgerMacedonianMalaysianMalteseMarshalleseMenomineeMexicanMexican American IndianMongolianMoroccanNative HawaiianNavajoNepaleseNew ZealanderNicaraguanNigerianNorthern EuropeanNorwegianOkinawanOsageOttawaPaiutePakistaniPalestinianPanamanianParaguayanPennsylvania GermanPeruvianPimaPolishPortuguesePotawatomiPuebloPuerto RicanPuget Sound SalishRomanianRussianSalvadoranSamoanScandinavianScotch-IrishScottishSeminoleSenegaleseSerbianShoshoneSierra LeoneanSiouxSlavicSlovakSloveneSomaliSouth AfricanSouth AmericanSouth American IndianSoviet UnionSpaniardSpanishSpanish AmericanSpanish American IndianSri LankanSubsaharan AfricanSudaneseSwedishSwissSyrianTaiwaneseThaiTlingit-HaidaTohono O'OdhamTonganTrinidadian and TobagonianTsimshianTurkishU.S. Virgin IslanderUgandanUkrainianUruguayanUteVenezuelanVietnameseWelshWest IndianYakamaYaquiYugoslavianYumanYup'ikZimbabwean
Immigration
NonimmigrantsImmigrantsAfghanistanAfricaAlbaniaArgentinaArmeniaAsiaAustriaBahamasBangladeshBarbadosBelarusBelgiumBelizeBoliviaBosnia and HerzegovinaBrazilBulgariaBurma/MyanmarCabo VerdeCambodiaCameroonCanadaCaribbeanCentral AmericaChileChinaColombiaCongoCosta RicaCroatiaCubaCzechoslovakiaDenmarkDominicaDominican RepublicEastern AfricaEastern AsiaEastern EuropeEcuadorEgyptEl SalvadorEnglandEritreaEthiopiaEuropeFijiFranceGermanyGhanaGreeceGrenadaGuatemalaGuyanaHaitiHondurasHong KongHungaryIndiaIndonesiaIranIraqIrelandIsraelItalyJamaicaJapanJordanKazakhstanKenyaKoreaKuwaitLaosLatin AmericaLatviaLebanonLiberiaLithuaniaMalaysiaMexicoMicronesiaMiddle AfricaMoldovaMoroccoNepalNetherlandsNicaraguaNigeriaNorth AmericaNorth MacedoniaNorthern AfricaNorthern EuropeNorwayOceaniaPakistanPanamaPeruPhilippinesPolandPortugalRomaniaRussiaSaudi ArabiaScotlandSenegalSerbiaSierra LeoneSingaporeSomaliaSouth AfricaSouth AmericaSouth Central AsiaSouth Eastern AsiaSouthern EuropeSpainSri LankaSt. Vincent and the GrenadinesSudanSwedenSwitzerlandSyriaTaiwanThailandTrinidad and TobagoTurkeyUgandaUkraineUruguayUzbekistanVenezuelaVietnamWest IndiesWestern AfricaWestern AsiaWestern EuropeYemenZaireZimbabweAzores
Poverty
Income
Poverty
Unemployment
Labor Participation
Family Structure
Vehicle Availability
Education Level
Disability

Poverty Comparison

Immigrants from Australia

Inupiat

Exceptional
Tragic
11.2%
POVERTY
97.4/ 100
METRIC RATING
67th/ 347
METRIC RANK
15.1%
POVERTY
0.0/ 100
METRIC RATING
287th/ 347
METRIC RANK

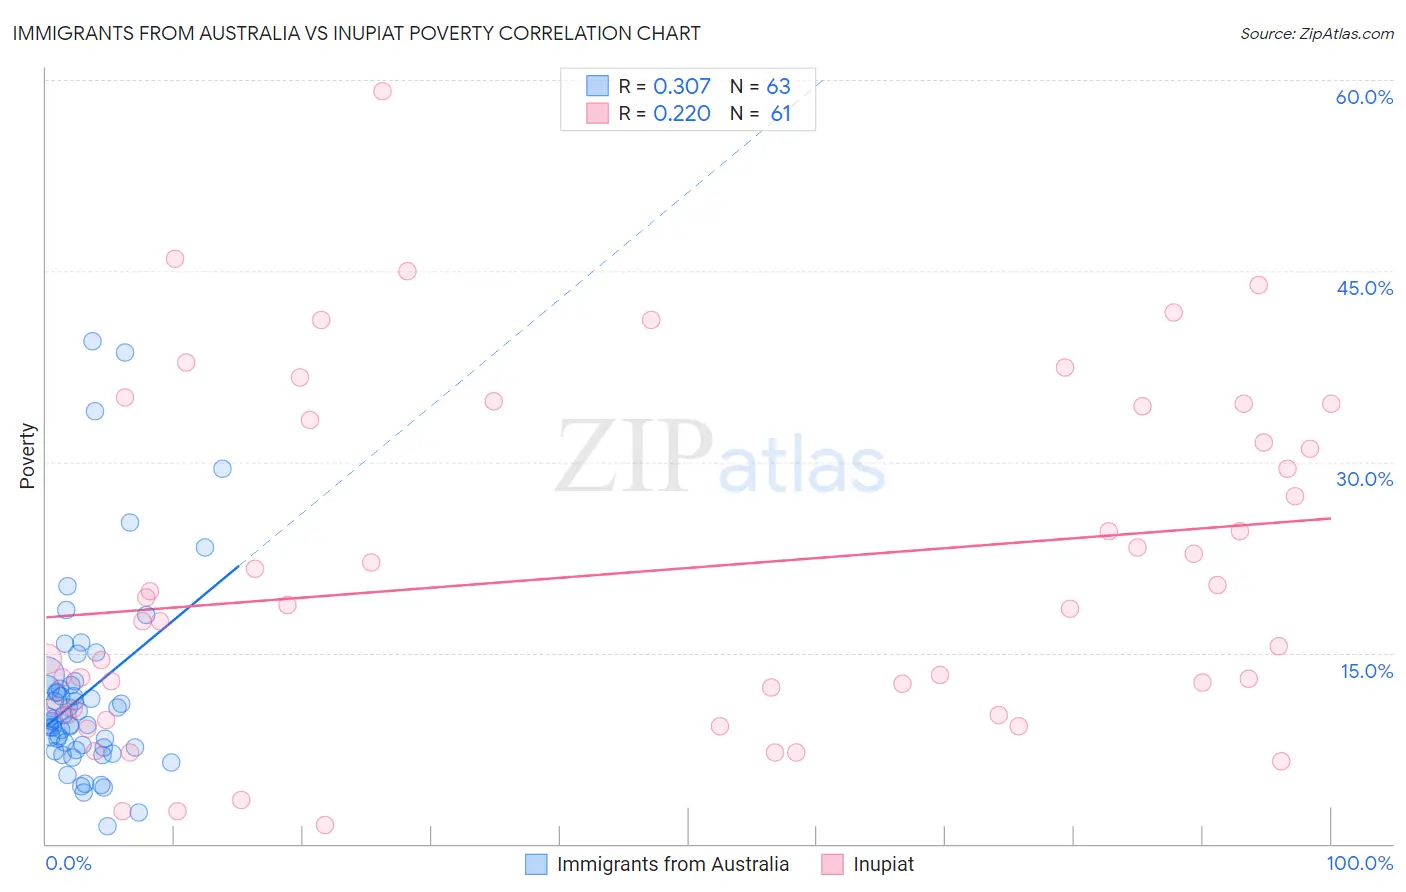
Immigrants from Australia vs Inupiat Poverty Correlation Chart

The statistical analysis conducted on geographies consisting of 227,147,878 people shows a mild positive correlation between the proportion of Immigrants from Australia and poverty level in the United States with a correlation coefficient (R) of 0.307 and weighted average of 11.2%. Similarly, the statistical analysis conducted on geographies consisting of 96,319,332 people shows a weak positive correlation between the proportion of Inupiat and poverty level in the United States with a correlation coefficient (R) of 0.220 and weighted average of 15.1%, a difference of 34.1%.
Immigrants from Australia vs Inupiat Poverty

Poverty Correlation Summary

MeasurementImmigrants from AustraliaInupiat
Minimum1.4%1.4%
Maximum39.4%59.1%
Range38.1%57.7%
Mean11.8%21.3%
Median9.9%18.4%
Interquartile 25% (IQ1)7.6%10.3%
Interquartile 75% (IQ3)12.5%33.9%
Interquartile Range (IQR)4.9%23.5%
Standard Deviation (Sample)7.7%13.3%
Standard Deviation (Population)7.6%13.2%

Similar Demographics by Poverty

Demographics Similar to Immigrants from Australia by Poverty

In terms of poverty, the demographic groups most similar to Immigrants from Australia are Slovak (11.2%, a difference of 0.020%), Immigrants from Netherlands (11.2%, a difference of 0.040%), Serbian (11.2%, a difference of 0.080%), Immigrants from Asia (11.2%, a difference of 0.11%), and Immigrants from Canada (11.3%, a difference of 0.17%).
DemographicsRating | RankPoverty
Immigrants | Sri Lanka
97.9
/100
|
#60
Exceptional
11.2%
Immigrants | Italy
97.9
/100
|
#61
Exceptional
11.2%
Austrians
97.8
/100
|
#62
Exceptional
11.2%
Ukrainians
97.8
/100
|
#63
Exceptional
11.2%
Swiss
97.7
/100
|
#64
Exceptional
11.2%
Immigrants | Asia
97.5
/100
|
#65
Exceptional
11.2%
Immigrants | Netherlands
97.5
/100
|
#66
Exceptional
11.2%
Immigrants | Australia
97.4
/100
|
#67
Exceptional
11.2%
Slovaks
97.4
/100
|
#68
Exceptional
11.2%
Serbians
97.4
/100
|
#69
Exceptional
11.2%
Immigrants | Canada
97.3
/100
|
#70
Exceptional
11.3%
Zimbabweans
97.3
/100
|
#71
Exceptional
11.3%
Europeans
97.2
/100
|
#72
Exceptional
11.3%
Immigrants | Belgium
97.2
/100
|
#73
Exceptional
11.3%
Carpatho Rusyns
97.2
/100
|
#74
Exceptional
11.3%

Demographics Similar to Inupiat by Poverty

In terms of poverty, the demographic groups most similar to Inupiat are Yaqui (15.1%, a difference of 0.010%), Immigrants from Belize (15.1%, a difference of 0.13%), Immigrants from Latin America (15.0%, a difference of 0.21%), Mexican (15.1%, a difference of 0.23%), and Immigrants from Cabo Verde (15.1%, a difference of 0.36%).
DemographicsRating | RankPoverty
Haitians
0.0
/100
|
#280
Tragic
14.9%
Immigrants | Barbados
0.0
/100
|
#281
Tragic
14.9%
Comanche
0.0
/100
|
#282
Tragic
15.0%
Immigrants | Haiti
0.0
/100
|
#283
Tragic
15.0%
West Indians
0.0
/100
|
#284
Tragic
15.0%
Vietnamese
0.0
/100
|
#285
Tragic
15.0%
Immigrants | Latin America
0.0
/100
|
#286
Tragic
15.0%
Inupiat
0.0
/100
|
#287
Tragic
15.1%
Yaqui
0.0
/100
|
#288
Tragic
15.1%
Immigrants | Belize
0.0
/100
|
#289
Tragic
15.1%
Mexicans
0.0
/100
|
#290
Tragic
15.1%
Immigrants | Cabo Verde
0.0
/100
|
#291
Tragic
15.1%
Indonesians
0.0
/100
|
#292
Tragic
15.1%
Immigrants | Zaire
0.0
/100
|
#293
Tragic
15.1%
Blackfeet
0.0
/100
|
#294
Tragic
15.2%