British West Indian vs Inupiat Poverty
COMPARE
British West Indian
Inupiat
Poverty
Poverty Comparison
British West Indians
Inupiat
15.9%
POVERTY
0.0/ 100
METRIC RATING
315th/ 347
METRIC RANK
15.1%
POVERTY
0.0/ 100
METRIC RATING
287th/ 347
METRIC RANK
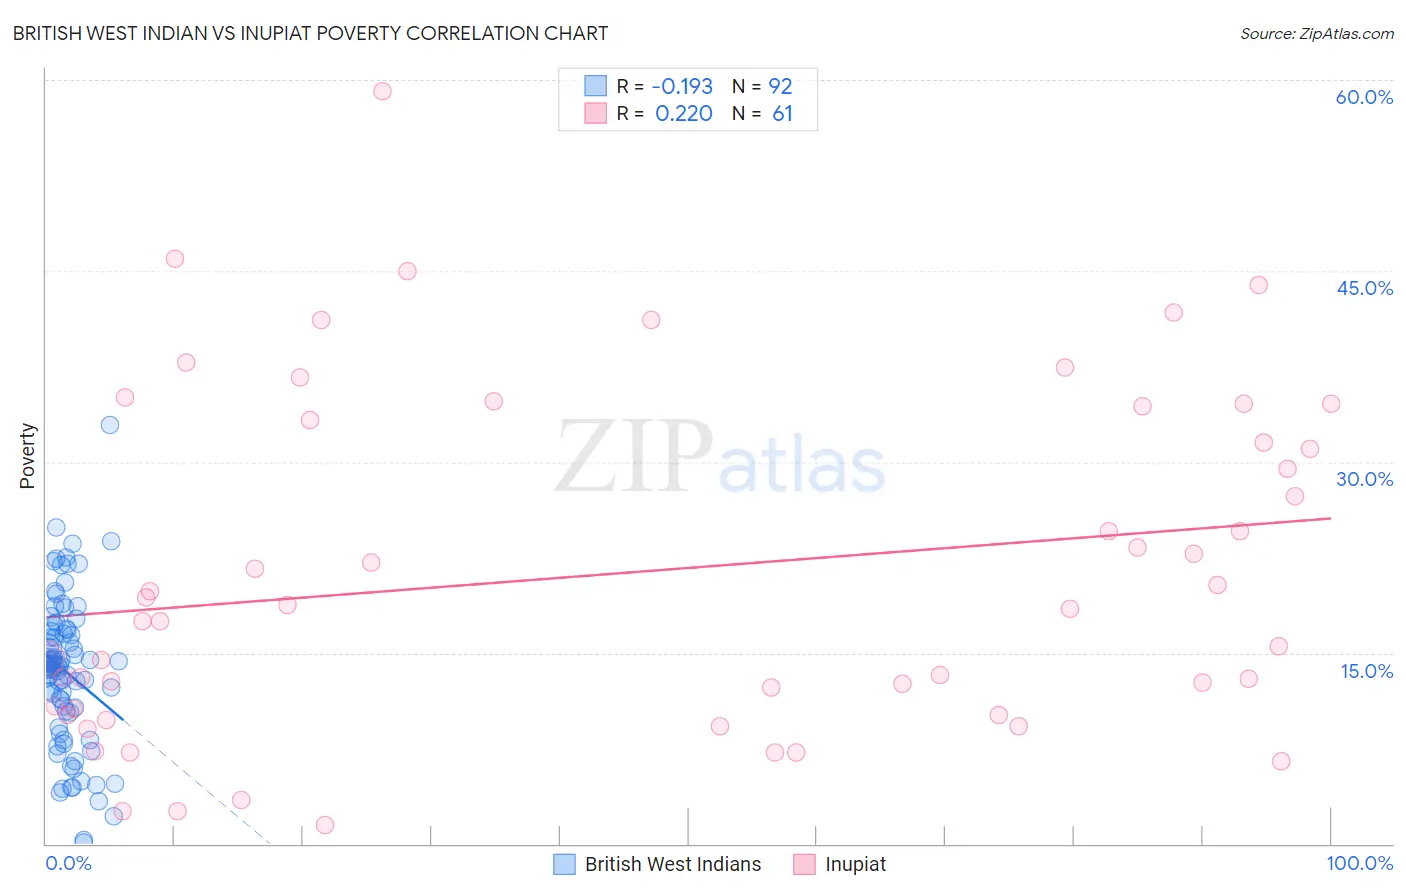
British West Indian vs Inupiat Poverty Correlation Chart
The statistical analysis conducted on geographies consisting of 152,630,673 people shows a poor negative correlation between the proportion of British West Indians and poverty level in the United States with a correlation coefficient (R) of -0.193 and weighted average of 15.9%. Similarly, the statistical analysis conducted on geographies consisting of 96,319,332 people shows a weak positive correlation between the proportion of Inupiat and poverty level in the United States with a correlation coefficient (R) of 0.220 and weighted average of 15.1%, a difference of 5.2%.
Poverty Correlation Summary
| Measurement | British West Indian | Inupiat |
| Minimum | 0.13% | 1.4% |
| Maximum | 32.9% | 59.1% |
| Range | 32.8% | 57.7% |
| Mean | 13.5% | 21.3% |
| Median | 14.0% | 18.4% |
| Interquartile 25% (IQ1) | 10.3% | 10.3% |
| Interquartile 75% (IQ3) | 16.8% | 33.9% |
| Interquartile Range (IQR) | 6.4% | 23.5% |
| Standard Deviation (Sample) | 5.9% | 13.3% |
| Standard Deviation (Population) | 5.9% | 13.2% |
Similar Demographics by Poverty
Demographics Similar to British West Indians by Poverty
In terms of poverty, the demographic groups most similar to British West Indians are Honduran (15.9%, a difference of 0.0%), Immigrants from Somalia (15.8%, a difference of 0.37%), Immigrants from Grenada (15.8%, a difference of 0.49%), Cajun (15.7%, a difference of 0.93%), and Chippewa (15.7%, a difference of 1.1%).
| Demographics | Rating | Rank | Poverty |
| Choctaw | 0.0 /100 | #308 | Tragic 15.6% |
| Seminole | 0.0 /100 | #309 | Tragic 15.6% |
| Dutch West Indians | 0.0 /100 | #310 | Tragic 15.6% |
| Chippewa | 0.0 /100 | #311 | Tragic 15.7% |
| Cajuns | 0.0 /100 | #312 | Tragic 15.7% |
| Immigrants | Grenada | 0.0 /100 | #313 | Tragic 15.8% |
| Immigrants | Somalia | 0.0 /100 | #314 | Tragic 15.8% |
| British West Indians | 0.0 /100 | #315 | Tragic 15.9% |
| Hondurans | 0.0 /100 | #316 | Tragic 15.9% |
| U.S. Virgin Islanders | 0.0 /100 | #317 | Tragic 16.1% |
| Immigrants | Dominica | 0.0 /100 | #318 | Tragic 16.1% |
| Immigrants | Congo | 0.0 /100 | #319 | Tragic 16.1% |
| Immigrants | Honduras | 0.0 /100 | #320 | Tragic 16.2% |
| Arapaho | 0.0 /100 | #321 | Tragic 16.3% |
| Menominee | 0.0 /100 | #322 | Tragic 16.4% |
Demographics Similar to Inupiat by Poverty
In terms of poverty, the demographic groups most similar to Inupiat are Yaqui (15.1%, a difference of 0.010%), Immigrants from Belize (15.1%, a difference of 0.13%), Immigrants from Latin America (15.0%, a difference of 0.21%), Mexican (15.1%, a difference of 0.23%), and Immigrants from Cabo Verde (15.1%, a difference of 0.36%).
| Demographics | Rating | Rank | Poverty |
| Haitians | 0.0 /100 | #280 | Tragic 14.9% |
| Immigrants | Barbados | 0.0 /100 | #281 | Tragic 14.9% |
| Comanche | 0.0 /100 | #282 | Tragic 15.0% |
| Immigrants | Haiti | 0.0 /100 | #283 | Tragic 15.0% |
| West Indians | 0.0 /100 | #284 | Tragic 15.0% |
| Vietnamese | 0.0 /100 | #285 | Tragic 15.0% |
| Immigrants | Latin America | 0.0 /100 | #286 | Tragic 15.0% |
| Inupiat | 0.0 /100 | #287 | Tragic 15.1% |
| Yaqui | 0.0 /100 | #288 | Tragic 15.1% |
| Immigrants | Belize | 0.0 /100 | #289 | Tragic 15.1% |
| Mexicans | 0.0 /100 | #290 | Tragic 15.1% |
| Immigrants | Cabo Verde | 0.0 /100 | #291 | Tragic 15.1% |
| Indonesians | 0.0 /100 | #292 | Tragic 15.1% |
| Immigrants | Zaire | 0.0 /100 | #293 | Tragic 15.1% |
| Blackfeet | 0.0 /100 | #294 | Tragic 15.2% |