Chickasaw vs Inupiat In Labor Force | Age 45-54
COMPARE
Chickasaw
Inupiat
In Labor Force | Age 45-54
In Labor Force | Age 45-54 Comparison
Chickasaw
Inupiat
79.0%
IN LABOR FORCE | AGE 45-54
0.0/ 100
METRIC RATING
318th/ 347
METRIC RANK
79.9%
IN LABOR FORCE | AGE 45-54
0.0/ 100
METRIC RATING
310th/ 347
METRIC RANK
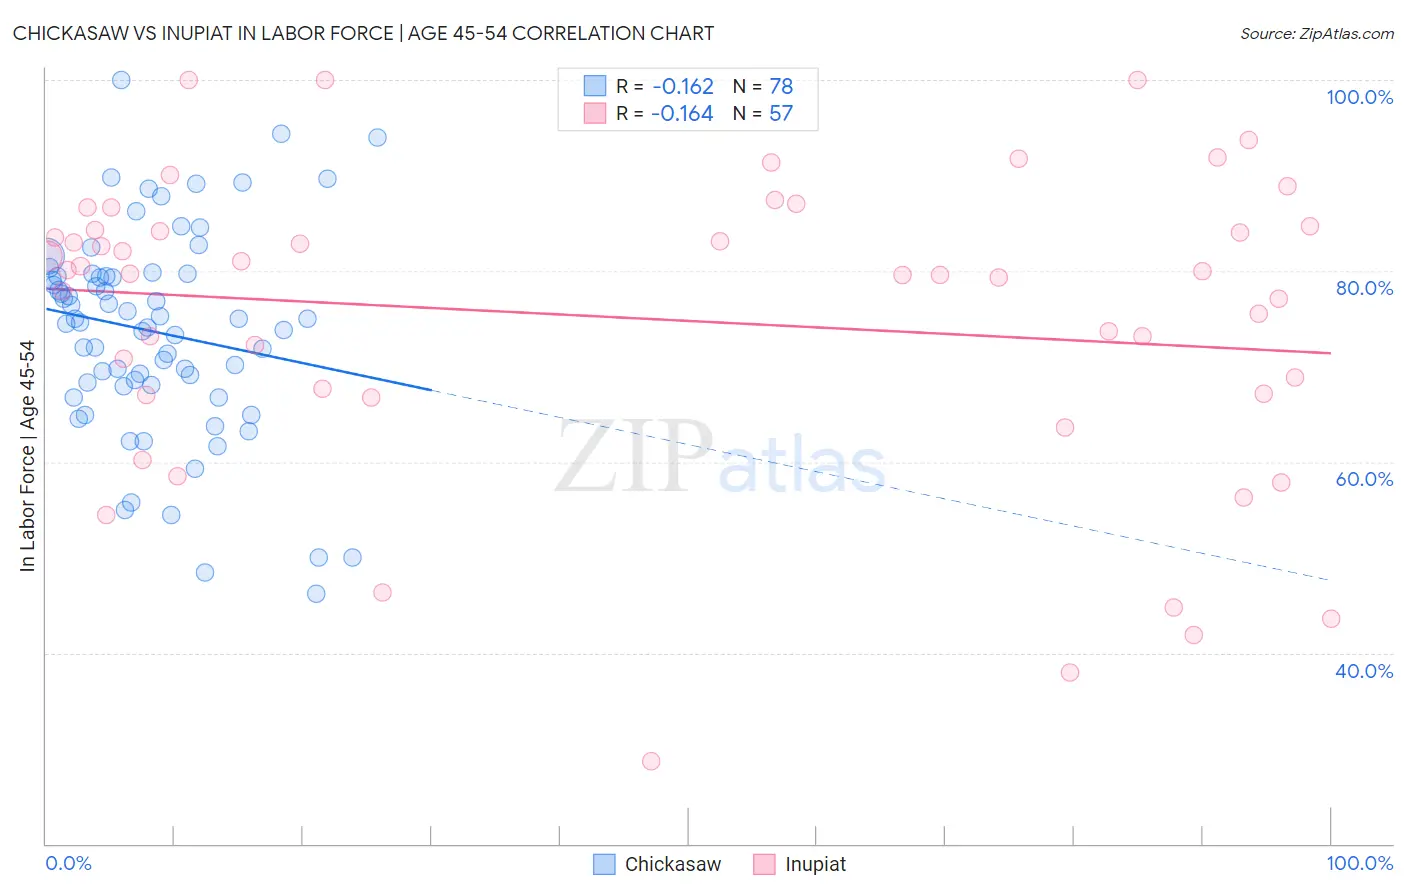
Chickasaw vs Inupiat In Labor Force | Age 45-54 Correlation Chart
The statistical analysis conducted on geographies consisting of 147,675,622 people shows a poor negative correlation between the proportion of Chickasaw and labor force participation rate among population between the ages 45 and 54 in the United States with a correlation coefficient (R) of -0.162 and weighted average of 79.0%. Similarly, the statistical analysis conducted on geographies consisting of 96,331,160 people shows a poor negative correlation between the proportion of Inupiat and labor force participation rate among population between the ages 45 and 54 in the United States with a correlation coefficient (R) of -0.164 and weighted average of 79.9%, a difference of 1.1%.
In Labor Force | Age 45-54 Correlation Summary
| Measurement | Chickasaw | Inupiat |
| Minimum | 46.2% | 28.6% |
| Maximum | 100.0% | 100.0% |
| Range | 53.8% | 71.4% |
| Mean | 73.6% | 75.0% |
| Median | 74.8% | 79.8% |
| Interquartile 25% (IQ1) | 68.0% | 67.1% |
| Interquartile 75% (IQ3) | 79.4% | 84.5% |
| Interquartile Range (IQR) | 11.4% | 17.4% |
| Standard Deviation (Sample) | 10.8% | 16.0% |
| Standard Deviation (Population) | 10.7% | 15.9% |
Demographics Similar to Chickasaw and Inupiat by In Labor Force | Age 45-54
In terms of in labor force | age 45-54, the demographic groups most similar to Chickasaw are Cherokee (79.0%, a difference of 0.10%), Comanche (79.2%, a difference of 0.17%), Yaqui (78.9%, a difference of 0.21%), Shoshone (79.3%, a difference of 0.31%), and Black/African American (79.3%, a difference of 0.39%). Similarly, the demographic groups most similar to Inupiat are Potawatomi (80.0%, a difference of 0.090%), Mexican (79.8%, a difference of 0.11%), Central American Indian (80.0%, a difference of 0.12%), Blackfeet (80.0%, a difference of 0.16%), and Spanish American (80.1%, a difference of 0.24%).
| Demographics | Rating | Rank | In Labor Force | Age 45-54 |
| Hispanics or Latinos | 0.0 /100 | #304 | Tragic 80.1% |
| Immigrants | Dominican Republic | 0.0 /100 | #305 | Tragic 80.1% |
| Spanish Americans | 0.0 /100 | #306 | Tragic 80.1% |
| Blackfeet | 0.0 /100 | #307 | Tragic 80.0% |
| Central American Indians | 0.0 /100 | #308 | Tragic 80.0% |
| Potawatomi | 0.0 /100 | #309 | Tragic 80.0% |
| Inupiat | 0.0 /100 | #310 | Tragic 79.9% |
| Mexicans | 0.0 /100 | #311 | Tragic 79.8% |
| Immigrants | Mexico | 0.0 /100 | #312 | Tragic 79.7% |
| Colville | 0.0 /100 | #313 | Tragic 79.5% |
| Ottawa | 0.0 /100 | #314 | Tragic 79.5% |
| Blacks/African Americans | 0.0 /100 | #315 | Tragic 79.3% |
| Shoshone | 0.0 /100 | #316 | Tragic 79.3% |
| Comanche | 0.0 /100 | #317 | Tragic 79.2% |
| Chickasaw | 0.0 /100 | #318 | Tragic 79.0% |
| Cherokee | 0.0 /100 | #319 | Tragic 79.0% |
| Yaqui | 0.0 /100 | #320 | Tragic 78.9% |
| Yup'ik | 0.0 /100 | #321 | Tragic 78.6% |
| Crow | 0.0 /100 | #322 | Tragic 78.3% |
| Kiowa | 0.0 /100 | #323 | Tragic 78.3% |
| Dutch West Indians | 0.0 /100 | #324 | Tragic 78.2% |