Immigrants from Zimbabwe vs Inupiat Poverty
COMPARE
Immigrants from Zimbabwe
Inupiat
Poverty
Poverty Comparison
Immigrants from Zimbabwe
Inupiat
11.6%
POVERTY
92.1/ 100
METRIC RATING
106th/ 347
METRIC RANK
15.1%
POVERTY
0.0/ 100
METRIC RATING
287th/ 347
METRIC RANK
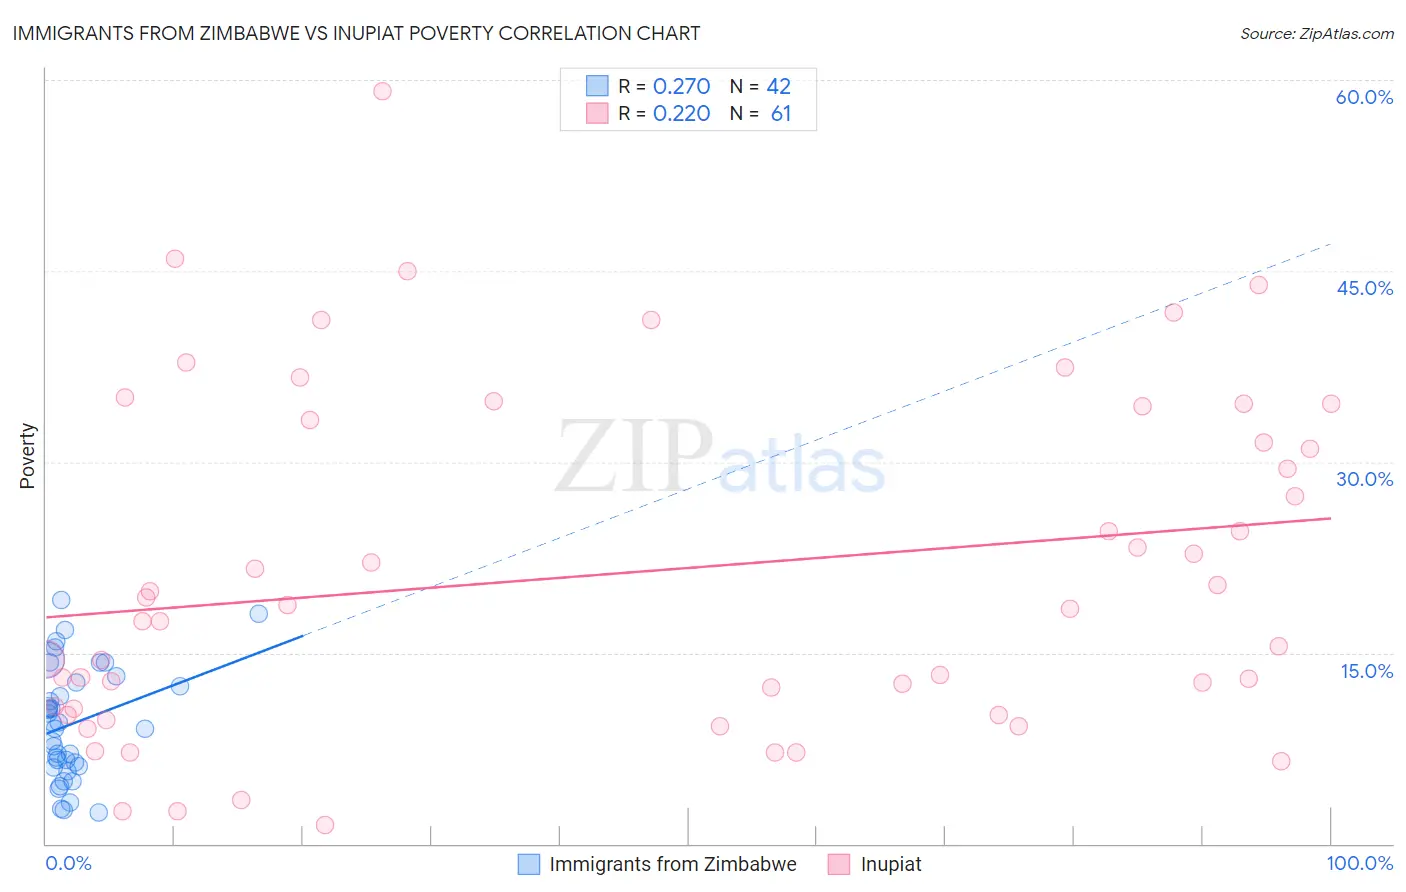
Immigrants from Zimbabwe vs Inupiat Poverty Correlation Chart
The statistical analysis conducted on geographies consisting of 117,789,316 people shows a weak positive correlation between the proportion of Immigrants from Zimbabwe and poverty level in the United States with a correlation coefficient (R) of 0.270 and weighted average of 11.6%. Similarly, the statistical analysis conducted on geographies consisting of 96,319,332 people shows a weak positive correlation between the proportion of Inupiat and poverty level in the United States with a correlation coefficient (R) of 0.220 and weighted average of 15.1%, a difference of 30.0%.
Poverty Correlation Summary
| Measurement | Immigrants from Zimbabwe | Inupiat |
| Minimum | 2.4% | 1.4% |
| Maximum | 19.2% | 59.1% |
| Range | 16.7% | 57.7% |
| Mean | 9.5% | 21.3% |
| Median | 9.3% | 18.4% |
| Interquartile 25% (IQ1) | 6.1% | 10.3% |
| Interquartile 75% (IQ3) | 12.7% | 33.9% |
| Interquartile Range (IQR) | 6.6% | 23.5% |
| Standard Deviation (Sample) | 4.4% | 13.3% |
| Standard Deviation (Population) | 4.4% | 13.2% |
Similar Demographics by Poverty
Demographics Similar to Immigrants from Zimbabwe by Poverty
In terms of poverty, the demographic groups most similar to Immigrants from Zimbabwe are Portuguese (11.6%, a difference of 0.0%), Native Hawaiian (11.6%, a difference of 0.020%), Palestinian (11.6%, a difference of 0.090%), Canadian (11.6%, a difference of 0.12%), and Laotian (11.6%, a difference of 0.13%).
| Demographics | Rating | Rank | Poverty |
| Immigrants | Indonesia | 94.2 /100 | #99 | Exceptional 11.5% |
| Scottish | 94.0 /100 | #100 | Exceptional 11.5% |
| Slavs | 93.3 /100 | #101 | Exceptional 11.5% |
| Laotians | 92.4 /100 | #102 | Exceptional 11.6% |
| Okinawans | 92.4 /100 | #103 | Exceptional 11.6% |
| Native Hawaiians | 92.1 /100 | #104 | Exceptional 11.6% |
| Portuguese | 92.1 /100 | #105 | Exceptional 11.6% |
| Immigrants | Zimbabwe | 92.1 /100 | #106 | Exceptional 11.6% |
| Palestinians | 91.8 /100 | #107 | Exceptional 11.6% |
| Canadians | 91.7 /100 | #108 | Exceptional 11.6% |
| Immigrants | Turkey | 91.7 /100 | #109 | Exceptional 11.6% |
| Welsh | 91.6 /100 | #110 | Exceptional 11.6% |
| French Canadians | 91.0 /100 | #111 | Exceptional 11.6% |
| Immigrants | Southern Europe | 90.8 /100 | #112 | Exceptional 11.6% |
| Immigrants | Belarus | 90.8 /100 | #113 | Exceptional 11.6% |
Demographics Similar to Inupiat by Poverty
In terms of poverty, the demographic groups most similar to Inupiat are Yaqui (15.1%, a difference of 0.010%), Immigrants from Belize (15.1%, a difference of 0.13%), Immigrants from Latin America (15.0%, a difference of 0.21%), Mexican (15.1%, a difference of 0.23%), and Immigrants from Cabo Verde (15.1%, a difference of 0.36%).
| Demographics | Rating | Rank | Poverty |
| Haitians | 0.0 /100 | #280 | Tragic 14.9% |
| Immigrants | Barbados | 0.0 /100 | #281 | Tragic 14.9% |
| Comanche | 0.0 /100 | #282 | Tragic 15.0% |
| Immigrants | Haiti | 0.0 /100 | #283 | Tragic 15.0% |
| West Indians | 0.0 /100 | #284 | Tragic 15.0% |
| Vietnamese | 0.0 /100 | #285 | Tragic 15.0% |
| Immigrants | Latin America | 0.0 /100 | #286 | Tragic 15.0% |
| Inupiat | 0.0 /100 | #287 | Tragic 15.1% |
| Yaqui | 0.0 /100 | #288 | Tragic 15.1% |
| Immigrants | Belize | 0.0 /100 | #289 | Tragic 15.1% |
| Mexicans | 0.0 /100 | #290 | Tragic 15.1% |
| Immigrants | Cabo Verde | 0.0 /100 | #291 | Tragic 15.1% |
| Indonesians | 0.0 /100 | #292 | Tragic 15.1% |
| Immigrants | Zaire | 0.0 /100 | #293 | Tragic 15.1% |
| Blackfeet | 0.0 /100 | #294 | Tragic 15.2% |