Basque vs Apache Single Female Poverty
COMPARE
Basque
Apache
Single Female Poverty
Single Female Poverty Comparison
Basques
Apache
21.3%
SINGLE FEMALE POVERTY
28.1/ 100
METRIC RATING
193rd/ 347
METRIC RANK
27.7%
SINGLE FEMALE POVERTY
0.0/ 100
METRIC RATING
328th/ 347
METRIC RANK
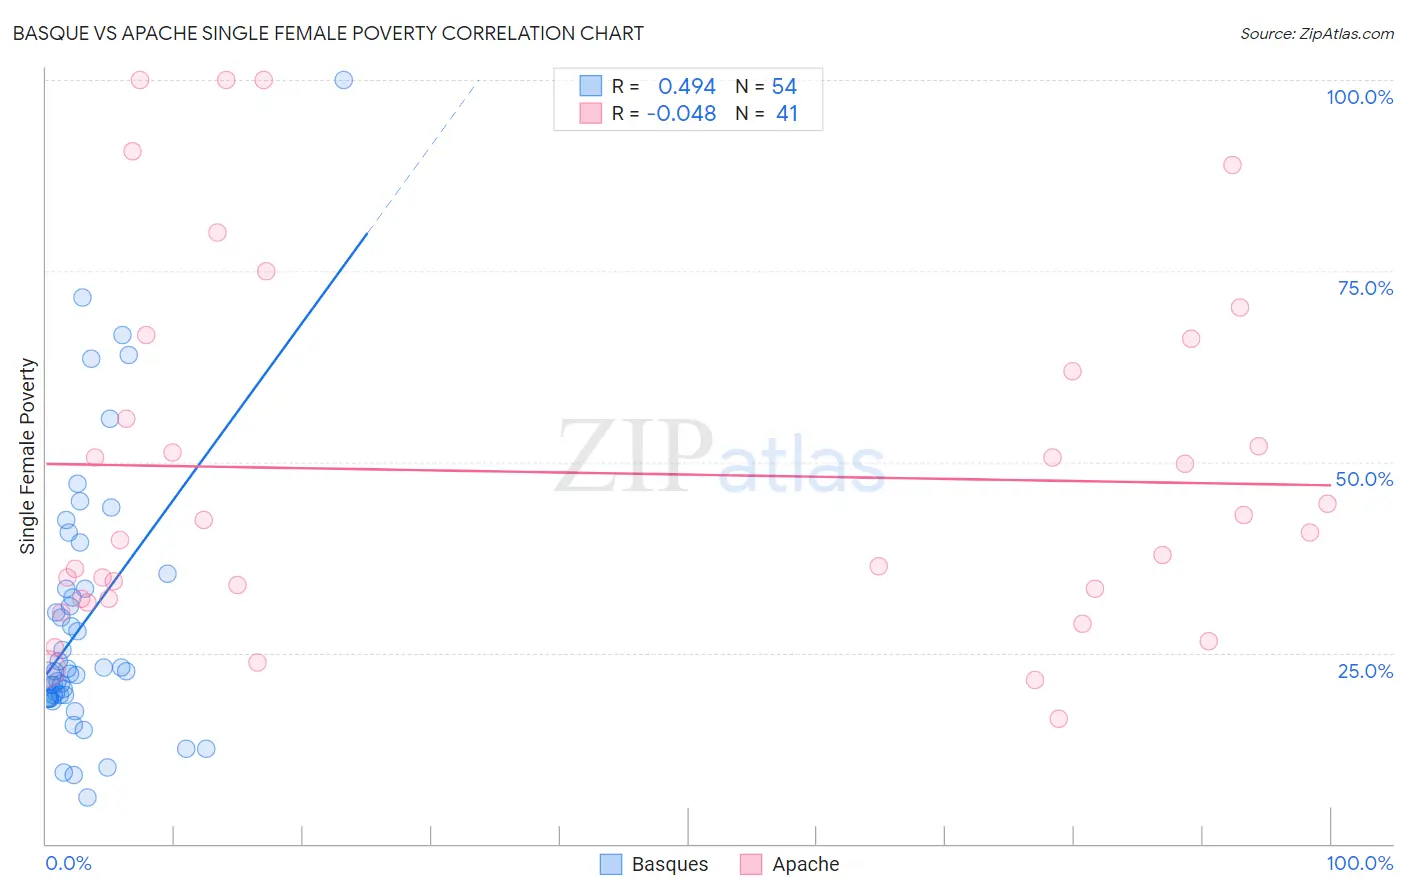
Basque vs Apache Single Female Poverty Correlation Chart
The statistical analysis conducted on geographies consisting of 164,728,632 people shows a moderate positive correlation between the proportion of Basques and poverty level among single females in the United States with a correlation coefficient (R) of 0.494 and weighted average of 21.3%. Similarly, the statistical analysis conducted on geographies consisting of 229,845,911 people shows no correlation between the proportion of Apache and poverty level among single females in the United States with a correlation coefficient (R) of -0.048 and weighted average of 27.7%, a difference of 30.0%.
Single Female Poverty Correlation Summary
| Measurement | Basque | Apache |
| Minimum | 6.1% | 16.4% |
| Maximum | 100.0% | 100.0% |
| Range | 93.9% | 83.6% |
| Mean | 29.2% | 48.6% |
| Median | 22.6% | 40.7% |
| Interquartile 25% (IQ1) | 19.2% | 32.1% |
| Interquartile 75% (IQ3) | 33.4% | 64.0% |
| Interquartile Range (IQR) | 14.2% | 31.9% |
| Standard Deviation (Sample) | 17.9% | 23.3% |
| Standard Deviation (Population) | 17.8% | 23.0% |
Similar Demographics by Single Female Poverty
Demographics Similar to Basques by Single Female Poverty
In terms of single female poverty, the demographic groups most similar to Basques are Czechoslovakian (21.3%, a difference of 0.030%), Nicaraguan (21.3%, a difference of 0.040%), Immigrants from Saudi Arabia (21.3%, a difference of 0.070%), Japanese (21.3%, a difference of 0.13%), and Immigrants from Jamaica (21.3%, a difference of 0.18%).
| Demographics | Rating | Rank | Single Female Poverty |
| Hawaiians | 37.7 /100 | #186 | Fair 21.2% |
| Immigrants | Nigeria | 36.8 /100 | #187 | Fair 21.2% |
| Yugoslavians | 35.4 /100 | #188 | Fair 21.2% |
| Immigrants | Cuba | 35.3 /100 | #189 | Fair 21.2% |
| Trinidadians and Tobagonians | 35.2 /100 | #190 | Fair 21.2% |
| Immigrants | Germany | 31.1 /100 | #191 | Fair 21.3% |
| Immigrants | Jamaica | 30.5 /100 | #192 | Fair 21.3% |
| Basques | 28.1 /100 | #193 | Fair 21.3% |
| Czechoslovakians | 27.7 /100 | #194 | Fair 21.3% |
| Nicaraguans | 27.6 /100 | #195 | Fair 21.3% |
| Immigrants | Saudi Arabia | 27.1 /100 | #196 | Fair 21.3% |
| Japanese | 26.4 /100 | #197 | Fair 21.3% |
| Swiss | 24.2 /100 | #198 | Fair 21.4% |
| Immigrants | Immigrants | 22.0 /100 | #199 | Fair 21.4% |
| Irish | 21.4 /100 | #200 | Fair 21.4% |
Demographics Similar to Apache by Single Female Poverty
In terms of single female poverty, the demographic groups most similar to Apache are Menominee (27.8%, a difference of 0.46%), Dutch West Indian (27.5%, a difference of 0.91%), Creek (27.4%, a difference of 0.99%), Hopi (28.0%, a difference of 1.2%), and Native/Alaskan (28.2%, a difference of 1.8%).
| Demographics | Rating | Rank | Single Female Poverty |
| Yup'ik | 0.0 /100 | #321 | Tragic 26.6% |
| Seminole | 0.0 /100 | #322 | Tragic 26.8% |
| Chippewa | 0.0 /100 | #323 | Tragic 26.8% |
| Kiowa | 0.0 /100 | #324 | Tragic 26.9% |
| Choctaw | 0.0 /100 | #325 | Tragic 27.2% |
| Creek | 0.0 /100 | #326 | Tragic 27.4% |
| Dutch West Indians | 0.0 /100 | #327 | Tragic 27.5% |
| Apache | 0.0 /100 | #328 | Tragic 27.7% |
| Menominee | 0.0 /100 | #329 | Tragic 27.8% |
| Hopi | 0.0 /100 | #330 | Tragic 28.0% |
| Natives/Alaskans | 0.0 /100 | #331 | Tragic 28.2% |
| Yakama | 0.0 /100 | #332 | Tragic 28.3% |
| Ute | 0.0 /100 | #333 | Tragic 28.4% |
| Pueblo | 0.0 /100 | #334 | Tragic 28.6% |
| Immigrants | Yemen | 0.0 /100 | #335 | Tragic 28.9% |