Immigrants from Canada vs Apache Single Female Poverty
COMPARE
Immigrants from Canada
Apache
Single Female Poverty
Single Female Poverty Comparison
Immigrants from Canada
Apache
20.2%
SINGLE FEMALE POVERTY
91.2/ 100
METRIC RATING
136th/ 347
METRIC RANK
27.7%
SINGLE FEMALE POVERTY
0.0/ 100
METRIC RATING
328th/ 347
METRIC RANK
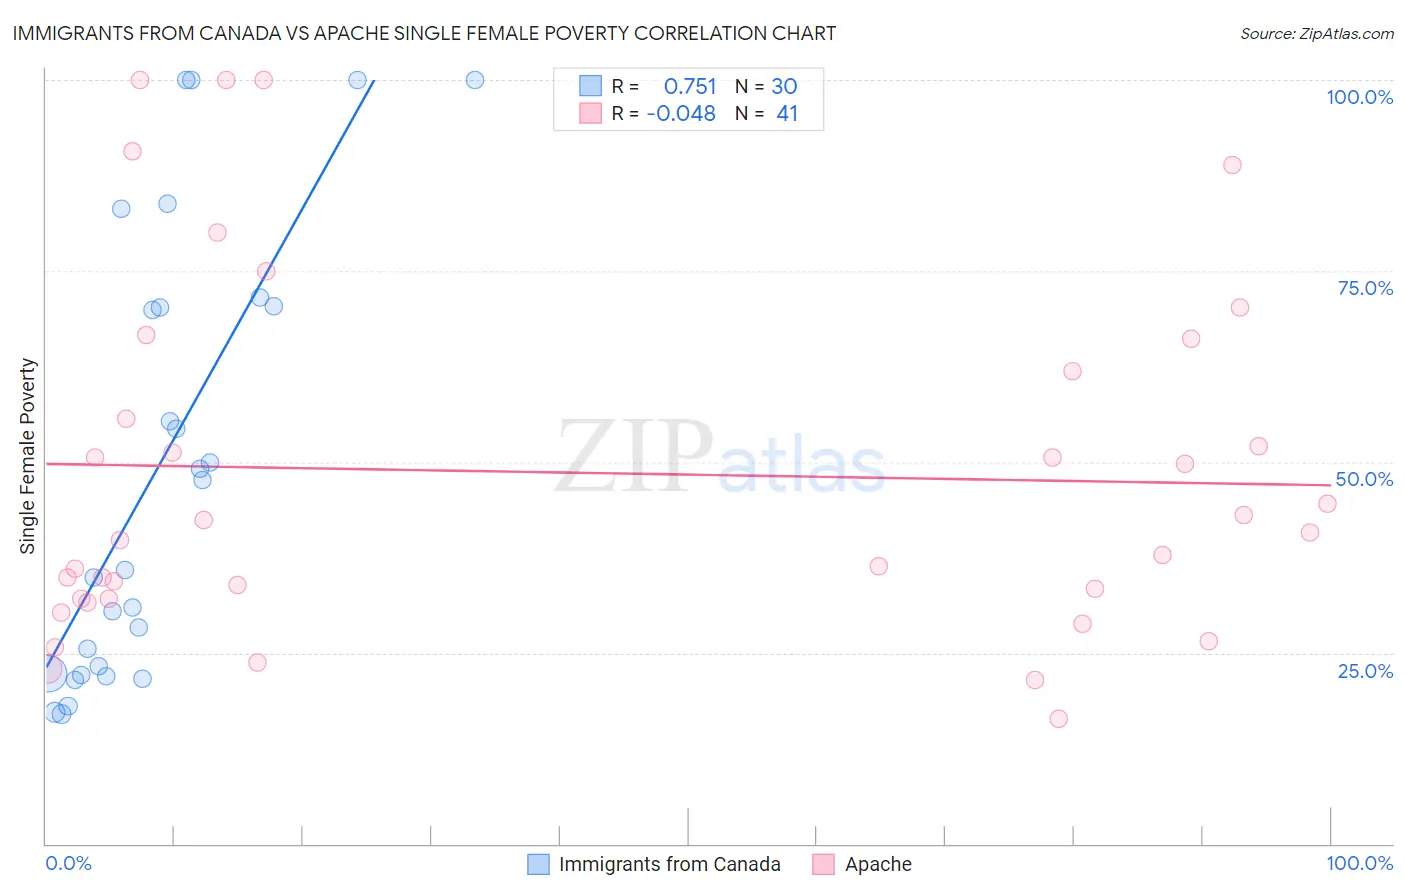
Immigrants from Canada vs Apache Single Female Poverty Correlation Chart
The statistical analysis conducted on geographies consisting of 448,621,148 people shows a strong positive correlation between the proportion of Immigrants from Canada and poverty level among single females in the United States with a correlation coefficient (R) of 0.751 and weighted average of 20.2%. Similarly, the statistical analysis conducted on geographies consisting of 229,845,911 people shows no correlation between the proportion of Apache and poverty level among single females in the United States with a correlation coefficient (R) of -0.048 and weighted average of 27.7%, a difference of 36.9%.
Single Female Poverty Correlation Summary
| Measurement | Immigrants from Canada | Apache |
| Minimum | 17.0% | 16.4% |
| Maximum | 100.0% | 100.0% |
| Range | 83.0% | 83.6% |
| Mean | 49.2% | 48.6% |
| Median | 41.8% | 40.7% |
| Interquartile 25% (IQ1) | 22.2% | 32.1% |
| Interquartile 75% (IQ3) | 70.4% | 64.0% |
| Interquartile Range (IQR) | 48.2% | 31.9% |
| Standard Deviation (Sample) | 28.8% | 23.3% |
| Standard Deviation (Population) | 28.3% | 23.0% |
Similar Demographics by Single Female Poverty
Demographics Similar to Immigrants from Canada by Single Female Poverty
In terms of single female poverty, the demographic groups most similar to Immigrants from Canada are Immigrants from Iraq (20.2%, a difference of 0.010%), Immigrants from Venezuela (20.2%, a difference of 0.060%), Immigrants from Nepal (20.3%, a difference of 0.11%), Slovene (20.3%, a difference of 0.14%), and Immigrants from England (20.2%, a difference of 0.15%).
| Demographics | Rating | Rank | Single Female Poverty |
| Immigrants | Morocco | 92.4 /100 | #129 | Exceptional 20.2% |
| Immigrants | Hungary | 92.3 /100 | #130 | Exceptional 20.2% |
| Pakistanis | 92.1 /100 | #131 | Exceptional 20.2% |
| Uruguayans | 92.1 /100 | #132 | Exceptional 20.2% |
| Immigrants | England | 91.9 /100 | #133 | Exceptional 20.2% |
| Immigrants | Venezuela | 91.5 /100 | #134 | Exceptional 20.2% |
| Immigrants | Iraq | 91.2 /100 | #135 | Exceptional 20.2% |
| Immigrants | Canada | 91.2 /100 | #136 | Exceptional 20.2% |
| Immigrants | Nepal | 90.6 /100 | #137 | Exceptional 20.3% |
| Slovenes | 90.5 /100 | #138 | Exceptional 20.3% |
| Immigrants | Kuwait | 90.4 /100 | #139 | Exceptional 20.3% |
| Syrians | 90.4 /100 | #140 | Exceptional 20.3% |
| Immigrants | North America | 89.5 /100 | #141 | Excellent 20.3% |
| Immigrants | Uganda | 89.1 /100 | #142 | Excellent 20.3% |
| Australians | 88.4 /100 | #143 | Excellent 20.3% |
Demographics Similar to Apache by Single Female Poverty
In terms of single female poverty, the demographic groups most similar to Apache are Menominee (27.8%, a difference of 0.46%), Dutch West Indian (27.5%, a difference of 0.91%), Creek (27.4%, a difference of 0.99%), Hopi (28.0%, a difference of 1.2%), and Native/Alaskan (28.2%, a difference of 1.8%).
| Demographics | Rating | Rank | Single Female Poverty |
| Yup'ik | 0.0 /100 | #321 | Tragic 26.6% |
| Seminole | 0.0 /100 | #322 | Tragic 26.8% |
| Chippewa | 0.0 /100 | #323 | Tragic 26.8% |
| Kiowa | 0.0 /100 | #324 | Tragic 26.9% |
| Choctaw | 0.0 /100 | #325 | Tragic 27.2% |
| Creek | 0.0 /100 | #326 | Tragic 27.4% |
| Dutch West Indians | 0.0 /100 | #327 | Tragic 27.5% |
| Apache | 0.0 /100 | #328 | Tragic 27.7% |
| Menominee | 0.0 /100 | #329 | Tragic 27.8% |
| Hopi | 0.0 /100 | #330 | Tragic 28.0% |
| Natives/Alaskans | 0.0 /100 | #331 | Tragic 28.2% |
| Yakama | 0.0 /100 | #332 | Tragic 28.3% |
| Ute | 0.0 /100 | #333 | Tragic 28.4% |
| Pueblo | 0.0 /100 | #334 | Tragic 28.6% |
| Immigrants | Yemen | 0.0 /100 | #335 | Tragic 28.9% |