Canadian vs Apache Single Female Poverty
COMPARE
Canadian
Apache
Single Female Poverty
Single Female Poverty Comparison
Canadians
Apache
21.1%
SINGLE FEMALE POVERTY
45.4/ 100
METRIC RATING
176th/ 347
METRIC RANK
27.7%
SINGLE FEMALE POVERTY
0.0/ 100
METRIC RATING
328th/ 347
METRIC RANK
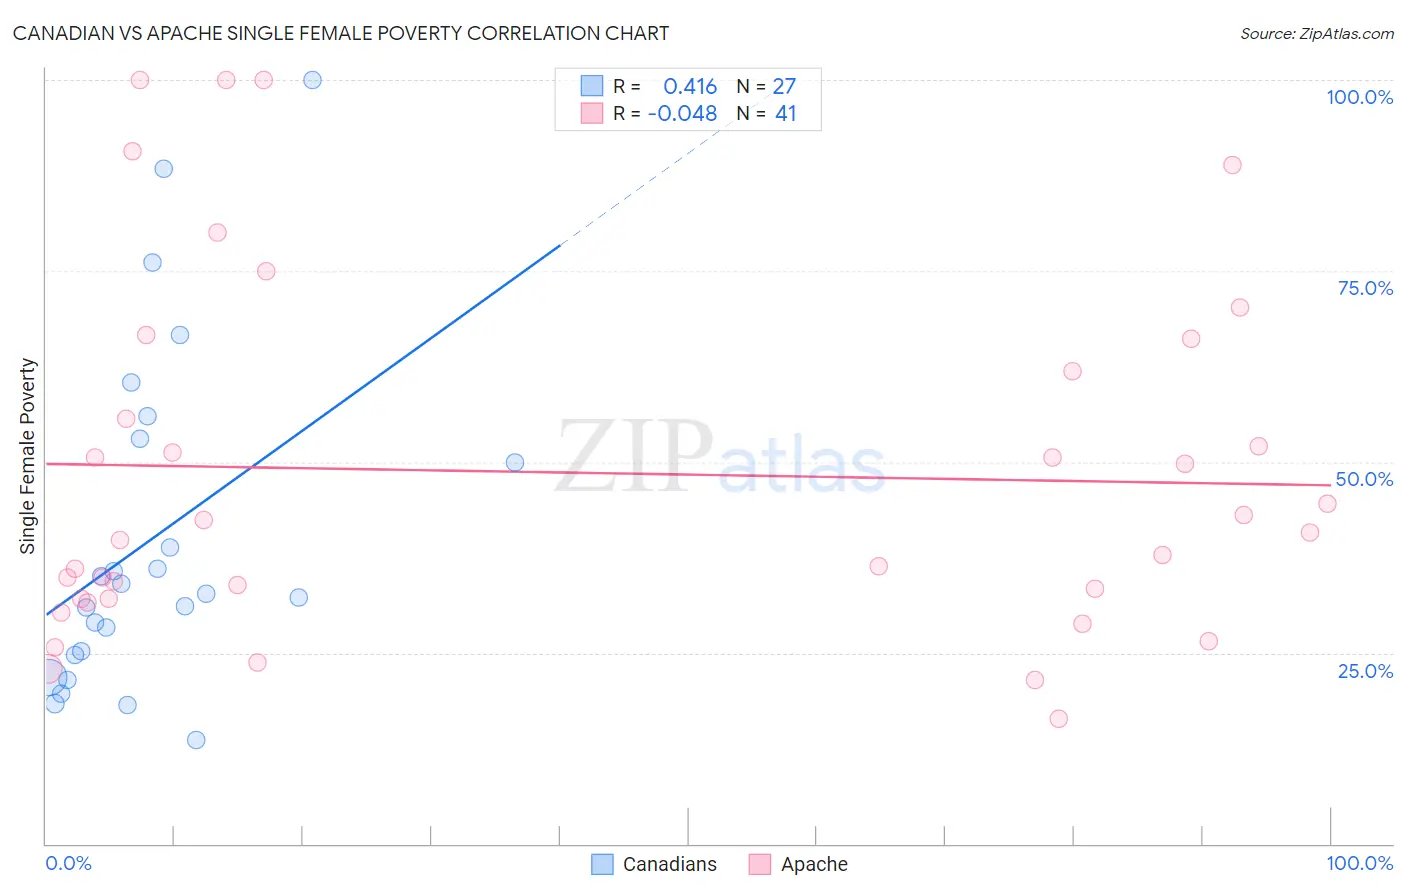
Canadian vs Apache Single Female Poverty Correlation Chart
The statistical analysis conducted on geographies consisting of 428,352,495 people shows a moderate positive correlation between the proportion of Canadians and poverty level among single females in the United States with a correlation coefficient (R) of 0.416 and weighted average of 21.1%. Similarly, the statistical analysis conducted on geographies consisting of 229,845,911 people shows no correlation between the proportion of Apache and poverty level among single females in the United States with a correlation coefficient (R) of -0.048 and weighted average of 27.7%, a difference of 31.5%.
Single Female Poverty Correlation Summary
| Measurement | Canadian | Apache |
| Minimum | 13.6% | 16.4% |
| Maximum | 100.0% | 100.0% |
| Range | 86.4% | 83.6% |
| Mean | 39.9% | 48.6% |
| Median | 32.8% | 40.7% |
| Interquartile 25% (IQ1) | 24.7% | 32.1% |
| Interquartile 75% (IQ3) | 53.0% | 64.0% |
| Interquartile Range (IQR) | 28.3% | 31.9% |
| Standard Deviation (Sample) | 22.1% | 23.3% |
| Standard Deviation (Population) | 21.7% | 23.0% |
Similar Demographics by Single Female Poverty
Demographics Similar to Canadians by Single Female Poverty
In terms of single female poverty, the demographic groups most similar to Canadians are Scandinavian (21.1%, a difference of 0.010%), Immigrants from Bosnia and Herzegovina (21.1%, a difference of 0.040%), Czech (21.0%, a difference of 0.080%), British (21.1%, a difference of 0.16%), and Spanish American Indian (21.1%, a difference of 0.19%).
| Demographics | Rating | Rank | Single Female Poverty |
| Immigrants | Trinidad and Tobago | 56.3 /100 | #169 | Average 20.9% |
| New Zealanders | 53.2 /100 | #170 | Average 21.0% |
| Moroccans | 52.8 /100 | #171 | Average 21.0% |
| Guyanese | 52.0 /100 | #172 | Average 21.0% |
| Immigrants | Guyana | 50.6 /100 | #173 | Average 21.0% |
| Cubans | 50.0 /100 | #174 | Average 21.0% |
| Czechs | 46.8 /100 | #175 | Average 21.0% |
| Canadians | 45.4 /100 | #176 | Average 21.1% |
| Scandinavians | 45.2 /100 | #177 | Average 21.1% |
| Immigrants | Bosnia and Herzegovina | 44.9 /100 | #178 | Average 21.1% |
| British | 42.9 /100 | #179 | Average 21.1% |
| Spanish American Indians | 42.5 /100 | #180 | Average 21.1% |
| Europeans | 42.3 /100 | #181 | Average 21.1% |
| Slavs | 40.5 /100 | #182 | Average 21.1% |
| Slovaks | 39.7 /100 | #183 | Fair 21.1% |
Demographics Similar to Apache by Single Female Poverty
In terms of single female poverty, the demographic groups most similar to Apache are Menominee (27.8%, a difference of 0.46%), Dutch West Indian (27.5%, a difference of 0.91%), Creek (27.4%, a difference of 0.99%), Hopi (28.0%, a difference of 1.2%), and Native/Alaskan (28.2%, a difference of 1.8%).
| Demographics | Rating | Rank | Single Female Poverty |
| Yup'ik | 0.0 /100 | #321 | Tragic 26.6% |
| Seminole | 0.0 /100 | #322 | Tragic 26.8% |
| Chippewa | 0.0 /100 | #323 | Tragic 26.8% |
| Kiowa | 0.0 /100 | #324 | Tragic 26.9% |
| Choctaw | 0.0 /100 | #325 | Tragic 27.2% |
| Creek | 0.0 /100 | #326 | Tragic 27.4% |
| Dutch West Indians | 0.0 /100 | #327 | Tragic 27.5% |
| Apache | 0.0 /100 | #328 | Tragic 27.7% |
| Menominee | 0.0 /100 | #329 | Tragic 27.8% |
| Hopi | 0.0 /100 | #330 | Tragic 28.0% |
| Natives/Alaskans | 0.0 /100 | #331 | Tragic 28.2% |
| Yakama | 0.0 /100 | #332 | Tragic 28.3% |
| Ute | 0.0 /100 | #333 | Tragic 28.4% |
| Pueblo | 0.0 /100 | #334 | Tragic 28.6% |
| Immigrants | Yemen | 0.0 /100 | #335 | Tragic 28.9% |