Basque vs Immigrants from Ukraine Single Female Poverty
COMPARE
Basque
Immigrants from Ukraine
Single Female Poverty
Single Female Poverty Comparison
Basques
Immigrants from Ukraine
21.3%
SINGLE FEMALE POVERTY
28.1/ 100
METRIC RATING
193rd/ 347
METRIC RANK
19.5%
SINGLE FEMALE POVERTY
99.0/ 100
METRIC RATING
89th/ 347
METRIC RANK
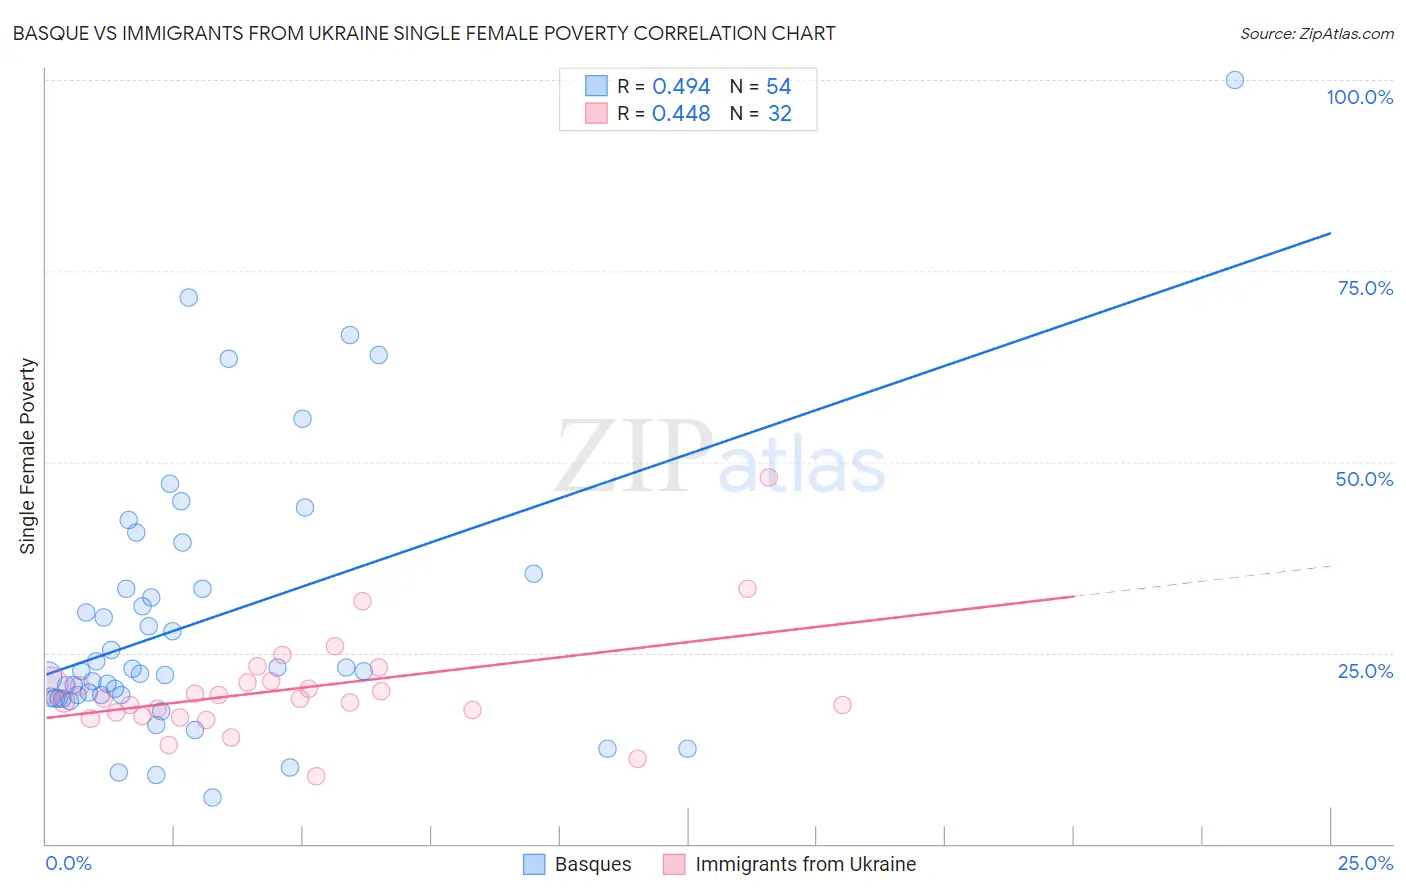
Basque vs Immigrants from Ukraine Single Female Poverty Correlation Chart
The statistical analysis conducted on geographies consisting of 164,728,632 people shows a moderate positive correlation between the proportion of Basques and poverty level among single females in the United States with a correlation coefficient (R) of 0.494 and weighted average of 21.3%. Similarly, the statistical analysis conducted on geographies consisting of 285,798,411 people shows a moderate positive correlation between the proportion of Immigrants from Ukraine and poverty level among single females in the United States with a correlation coefficient (R) of 0.448 and weighted average of 19.5%, a difference of 9.2%.
Single Female Poverty Correlation Summary
| Measurement | Basque | Immigrants from Ukraine |
| Minimum | 6.1% | 8.9% |
| Maximum | 100.0% | 48.0% |
| Range | 93.9% | 39.1% |
| Mean | 29.2% | 20.3% |
| Median | 22.6% | 19.0% |
| Interquartile 25% (IQ1) | 19.2% | 17.0% |
| Interquartile 75% (IQ3) | 33.4% | 21.2% |
| Interquartile Range (IQR) | 14.2% | 4.2% |
| Standard Deviation (Sample) | 17.9% | 7.1% |
| Standard Deviation (Population) | 17.8% | 7.0% |
Similar Demographics by Single Female Poverty
Demographics Similar to Basques by Single Female Poverty
In terms of single female poverty, the demographic groups most similar to Basques are Czechoslovakian (21.3%, a difference of 0.030%), Nicaraguan (21.3%, a difference of 0.040%), Immigrants from Saudi Arabia (21.3%, a difference of 0.070%), Japanese (21.3%, a difference of 0.13%), and Immigrants from Jamaica (21.3%, a difference of 0.18%).
| Demographics | Rating | Rank | Single Female Poverty |
| Hawaiians | 37.7 /100 | #186 | Fair 21.2% |
| Immigrants | Nigeria | 36.8 /100 | #187 | Fair 21.2% |
| Yugoslavians | 35.4 /100 | #188 | Fair 21.2% |
| Immigrants | Cuba | 35.3 /100 | #189 | Fair 21.2% |
| Trinidadians and Tobagonians | 35.2 /100 | #190 | Fair 21.2% |
| Immigrants | Germany | 31.1 /100 | #191 | Fair 21.3% |
| Immigrants | Jamaica | 30.5 /100 | #192 | Fair 21.3% |
| Basques | 28.1 /100 | #193 | Fair 21.3% |
| Czechoslovakians | 27.7 /100 | #194 | Fair 21.3% |
| Nicaraguans | 27.6 /100 | #195 | Fair 21.3% |
| Immigrants | Saudi Arabia | 27.1 /100 | #196 | Fair 21.3% |
| Japanese | 26.4 /100 | #197 | Fair 21.3% |
| Swiss | 24.2 /100 | #198 | Fair 21.4% |
| Immigrants | Immigrants | 22.0 /100 | #199 | Fair 21.4% |
| Irish | 21.4 /100 | #200 | Fair 21.4% |
Demographics Similar to Immigrants from Ukraine by Single Female Poverty
In terms of single female poverty, the demographic groups most similar to Immigrants from Ukraine are Afghan (19.5%, a difference of 0.010%), Zimbabwean (19.5%, a difference of 0.030%), Immigrants from Lebanon (19.6%, a difference of 0.17%), Soviet Union (19.6%, a difference of 0.24%), and Italian (19.6%, a difference of 0.29%).
| Demographics | Rating | Rank | Single Female Poverty |
| Immigrants | Malaysia | 99.2 /100 | #82 | Exceptional 19.4% |
| Taiwanese | 99.2 /100 | #83 | Exceptional 19.4% |
| Immigrants | Sweden | 99.2 /100 | #84 | Exceptional 19.4% |
| Immigrants | Albania | 99.2 /100 | #85 | Exceptional 19.4% |
| Greeks | 99.2 /100 | #86 | Exceptional 19.4% |
| Zimbabweans | 99.0 /100 | #87 | Exceptional 19.5% |
| Afghans | 99.0 /100 | #88 | Exceptional 19.5% |
| Immigrants | Ukraine | 99.0 /100 | #89 | Exceptional 19.5% |
| Immigrants | Lebanon | 98.8 /100 | #90 | Exceptional 19.6% |
| Soviet Union | 98.8 /100 | #91 | Exceptional 19.6% |
| Italians | 98.8 /100 | #92 | Exceptional 19.6% |
| Immigrants | Austria | 98.8 /100 | #93 | Exceptional 19.6% |
| Romanians | 98.6 /100 | #94 | Exceptional 19.6% |
| Estonians | 98.2 /100 | #95 | Exceptional 19.7% |
| Immigrants | Brazil | 98.2 /100 | #96 | Exceptional 19.7% |