Ghanaian vs Apache Single Female Poverty
COMPARE
Ghanaian
Apache
Single Female Poverty
Single Female Poverty Comparison
Ghanaians
Apache
21.6%
SINGLE FEMALE POVERTY
15.7/ 100
METRIC RATING
207th/ 347
METRIC RANK
27.7%
SINGLE FEMALE POVERTY
0.0/ 100
METRIC RATING
328th/ 347
METRIC RANK
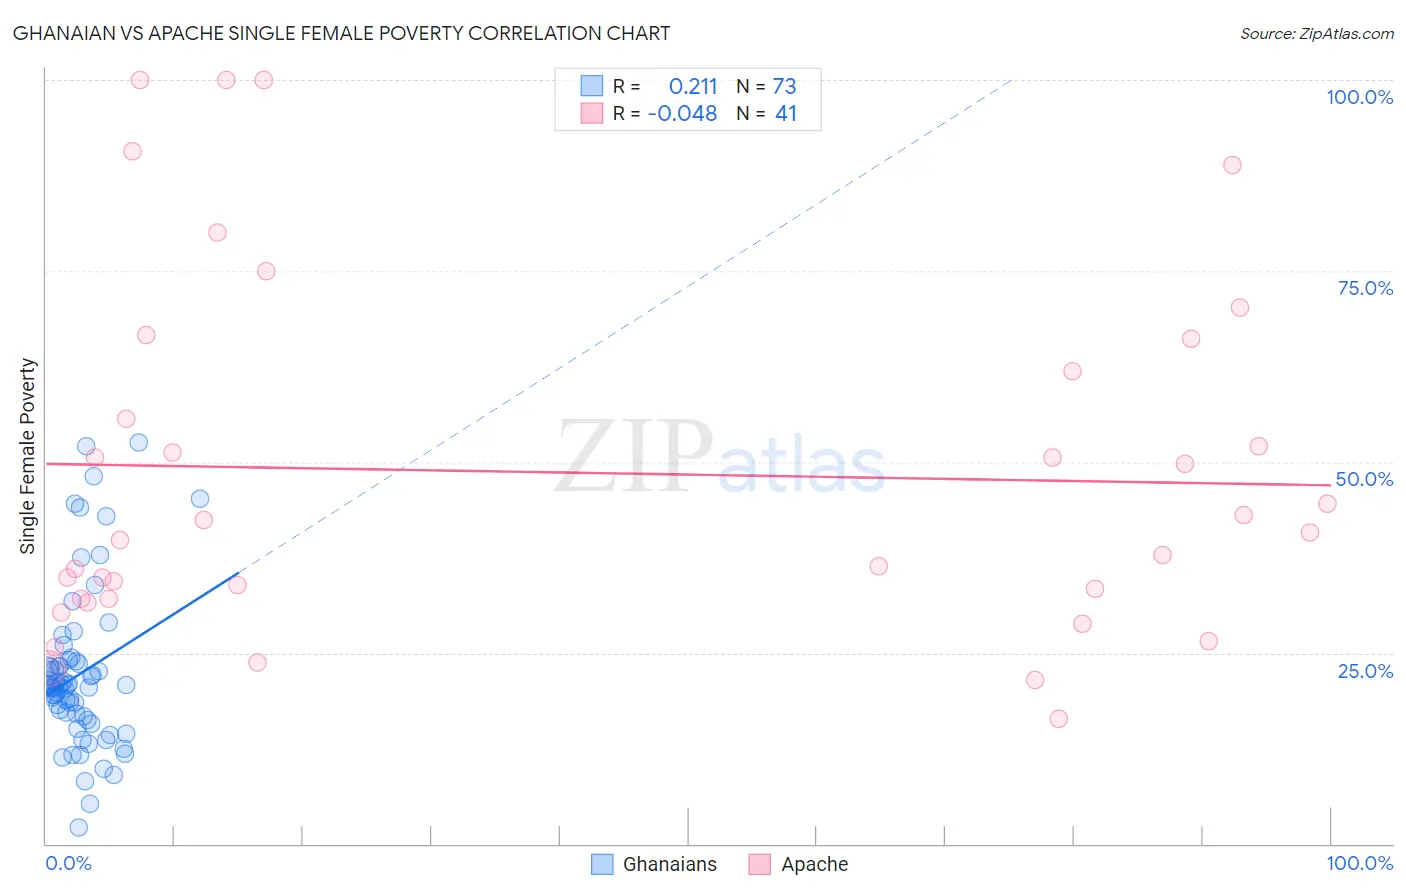
Ghanaian vs Apache Single Female Poverty Correlation Chart
The statistical analysis conducted on geographies consisting of 189,278,551 people shows a weak positive correlation between the proportion of Ghanaians and poverty level among single females in the United States with a correlation coefficient (R) of 0.211 and weighted average of 21.6%. Similarly, the statistical analysis conducted on geographies consisting of 229,845,911 people shows no correlation between the proportion of Apache and poverty level among single females in the United States with a correlation coefficient (R) of -0.048 and weighted average of 27.7%, a difference of 28.6%.
Single Female Poverty Correlation Summary
| Measurement | Ghanaian | Apache |
| Minimum | 2.1% | 16.4% |
| Maximum | 52.6% | 100.0% |
| Range | 50.5% | 83.6% |
| Mean | 22.2% | 48.6% |
| Median | 20.7% | 40.7% |
| Interquartile 25% (IQ1) | 16.5% | 32.1% |
| Interquartile 75% (IQ3) | 23.7% | 64.0% |
| Interquartile Range (IQR) | 7.2% | 31.9% |
| Standard Deviation (Sample) | 10.4% | 23.3% |
| Standard Deviation (Population) | 10.3% | 23.0% |
Similar Demographics by Single Female Poverty
Demographics Similar to Ghanaians by Single Female Poverty
In terms of single female poverty, the demographic groups most similar to Ghanaians are Belgian (21.5%, a difference of 0.040%), Haitian (21.6%, a difference of 0.040%), Finnish (21.5%, a difference of 0.050%), Immigrants from Eastern Africa (21.6%, a difference of 0.070%), and Immigrants from Africa (21.5%, a difference of 0.11%).
| Demographics | Rating | Rank | Single Female Poverty |
| Irish | 21.4 /100 | #200 | Fair 21.4% |
| Nigerians | 20.9 /100 | #201 | Fair 21.4% |
| Immigrants | Kenya | 20.7 /100 | #202 | Fair 21.4% |
| Immigrants | Haiti | 18.8 /100 | #203 | Poor 21.5% |
| Immigrants | Africa | 16.7 /100 | #204 | Poor 21.5% |
| Finns | 16.2 /100 | #205 | Poor 21.5% |
| Belgians | 16.1 /100 | #206 | Poor 21.5% |
| Ghanaians | 15.7 /100 | #207 | Poor 21.6% |
| Haitians | 15.4 /100 | #208 | Poor 21.6% |
| Immigrants | Eastern Africa | 15.1 /100 | #209 | Poor 21.6% |
| Immigrants | Panama | 14.4 /100 | #210 | Poor 21.6% |
| Icelanders | 14.0 /100 | #211 | Poor 21.6% |
| Jamaicans | 14.0 /100 | #212 | Poor 21.6% |
| Guamanians/Chamorros | 13.7 /100 | #213 | Poor 21.6% |
| Immigrants | Nicaragua | 13.3 /100 | #214 | Poor 21.6% |
Demographics Similar to Apache by Single Female Poverty
In terms of single female poverty, the demographic groups most similar to Apache are Menominee (27.8%, a difference of 0.46%), Dutch West Indian (27.5%, a difference of 0.91%), Creek (27.4%, a difference of 0.99%), Hopi (28.0%, a difference of 1.2%), and Native/Alaskan (28.2%, a difference of 1.8%).
| Demographics | Rating | Rank | Single Female Poverty |
| Yup'ik | 0.0 /100 | #321 | Tragic 26.6% |
| Seminole | 0.0 /100 | #322 | Tragic 26.8% |
| Chippewa | 0.0 /100 | #323 | Tragic 26.8% |
| Kiowa | 0.0 /100 | #324 | Tragic 26.9% |
| Choctaw | 0.0 /100 | #325 | Tragic 27.2% |
| Creek | 0.0 /100 | #326 | Tragic 27.4% |
| Dutch West Indians | 0.0 /100 | #327 | Tragic 27.5% |
| Apache | 0.0 /100 | #328 | Tragic 27.7% |
| Menominee | 0.0 /100 | #329 | Tragic 27.8% |
| Hopi | 0.0 /100 | #330 | Tragic 28.0% |
| Natives/Alaskans | 0.0 /100 | #331 | Tragic 28.2% |
| Yakama | 0.0 /100 | #332 | Tragic 28.3% |
| Ute | 0.0 /100 | #333 | Tragic 28.4% |
| Pueblo | 0.0 /100 | #334 | Tragic 28.6% |
| Immigrants | Yemen | 0.0 /100 | #335 | Tragic 28.9% |