Basque vs Immigrants from Cuba Single Female Poverty
COMPARE
Basque
Immigrants from Cuba
Single Female Poverty
Single Female Poverty Comparison
Basques
Immigrants from Cuba
21.3%
SINGLE FEMALE POVERTY
28.1/ 100
METRIC RATING
193rd/ 347
METRIC RANK
21.2%
SINGLE FEMALE POVERTY
35.3/ 100
METRIC RATING
189th/ 347
METRIC RANK
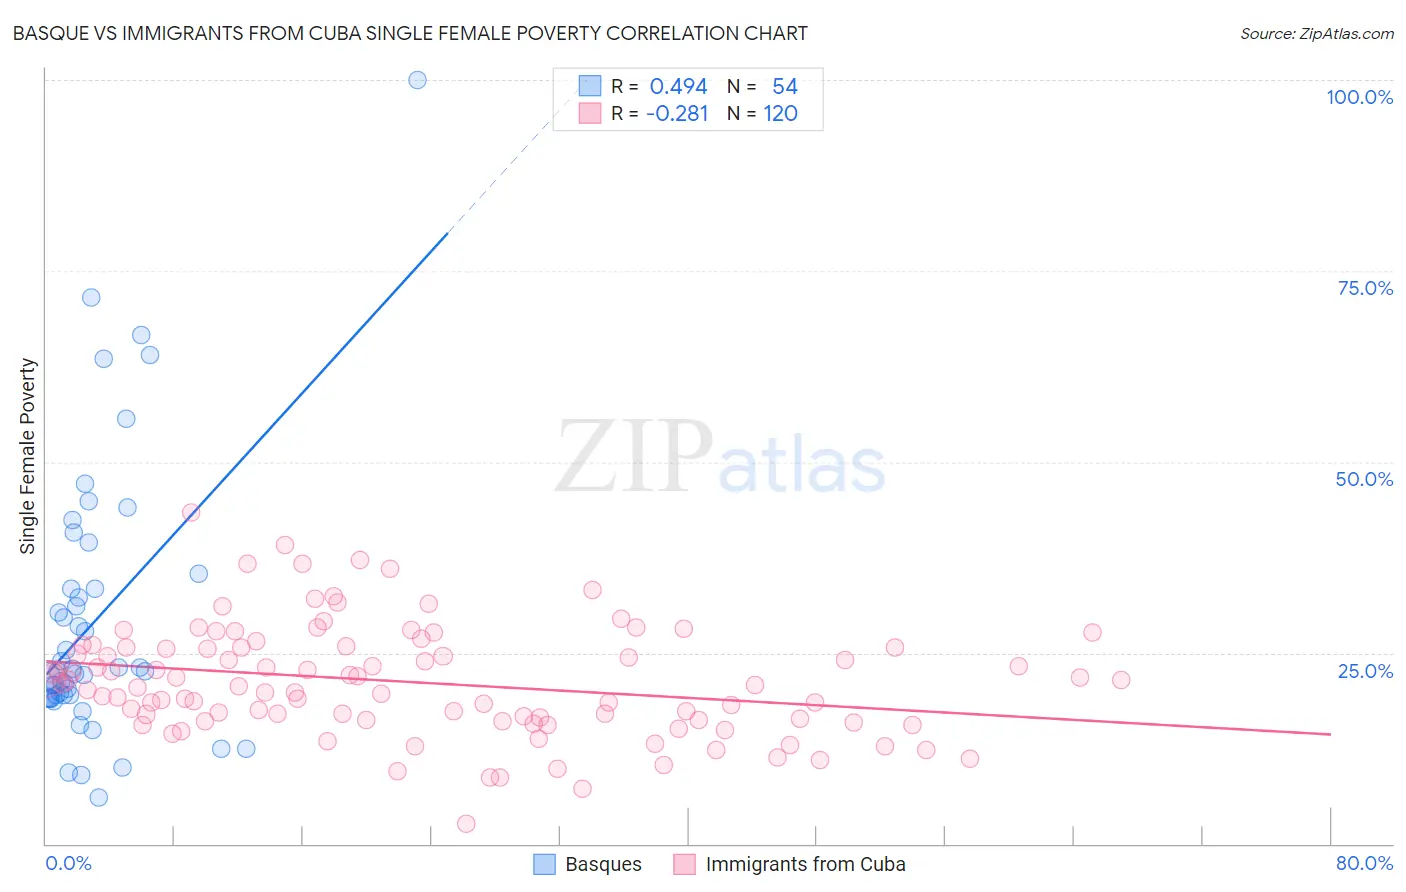
Basque vs Immigrants from Cuba Single Female Poverty Correlation Chart
The statistical analysis conducted on geographies consisting of 164,728,632 people shows a moderate positive correlation between the proportion of Basques and poverty level among single females in the United States with a correlation coefficient (R) of 0.494 and weighted average of 21.3%. Similarly, the statistical analysis conducted on geographies consisting of 322,497,975 people shows a weak negative correlation between the proportion of Immigrants from Cuba and poverty level among single females in the United States with a correlation coefficient (R) of -0.281 and weighted average of 21.2%, a difference of 0.51%.
Single Female Poverty Correlation Summary
| Measurement | Basque | Immigrants from Cuba |
| Minimum | 6.1% | 2.6% |
| Maximum | 100.0% | 43.3% |
| Range | 93.9% | 40.7% |
| Mean | 29.2% | 21.1% |
| Median | 22.6% | 20.7% |
| Interquartile 25% (IQ1) | 19.2% | 16.2% |
| Interquartile 75% (IQ3) | 33.4% | 25.7% |
| Interquartile Range (IQR) | 14.2% | 9.5% |
| Standard Deviation (Sample) | 17.9% | 7.2% |
| Standard Deviation (Population) | 17.8% | 7.2% |
Demographics Similar to Basques and Immigrants from Cuba by Single Female Poverty
In terms of single female poverty, the demographic groups most similar to Basques are Czechoslovakian (21.3%, a difference of 0.030%), Nicaraguan (21.3%, a difference of 0.040%), Immigrants from Saudi Arabia (21.3%, a difference of 0.070%), Japanese (21.3%, a difference of 0.13%), and Immigrants from Jamaica (21.3%, a difference of 0.18%). Similarly, the demographic groups most similar to Immigrants from Cuba are Trinidadian and Tobagonian (21.2%, a difference of 0.0%), Yugoslavian (21.2%, a difference of 0.010%), Immigrants from Nigeria (21.2%, a difference of 0.10%), Hawaiian (21.2%, a difference of 0.16%), and Immigrants from Cambodia (21.2%, a difference of 0.20%).
| Demographics | Rating | Rank | Single Female Poverty |
| Europeans | 42.3 /100 | #181 | Average 21.1% |
| Slavs | 40.5 /100 | #182 | Average 21.1% |
| Slovaks | 39.7 /100 | #183 | Fair 21.1% |
| Hungarians | 39.6 /100 | #184 | Fair 21.1% |
| Immigrants | Cambodia | 38.2 /100 | #185 | Fair 21.2% |
| Hawaiians | 37.7 /100 | #186 | Fair 21.2% |
| Immigrants | Nigeria | 36.8 /100 | #187 | Fair 21.2% |
| Yugoslavians | 35.4 /100 | #188 | Fair 21.2% |
| Immigrants | Cuba | 35.3 /100 | #189 | Fair 21.2% |
| Trinidadians and Tobagonians | 35.2 /100 | #190 | Fair 21.2% |
| Immigrants | Germany | 31.1 /100 | #191 | Fair 21.3% |
| Immigrants | Jamaica | 30.5 /100 | #192 | Fair 21.3% |
| Basques | 28.1 /100 | #193 | Fair 21.3% |
| Czechoslovakians | 27.7 /100 | #194 | Fair 21.3% |
| Nicaraguans | 27.6 /100 | #195 | Fair 21.3% |
| Immigrants | Saudi Arabia | 27.1 /100 | #196 | Fair 21.3% |
| Japanese | 26.4 /100 | #197 | Fair 21.3% |
| Swiss | 24.2 /100 | #198 | Fair 21.4% |
| Immigrants | Immigrants | 22.0 /100 | #199 | Fair 21.4% |
| Irish | 21.4 /100 | #200 | Fair 21.4% |
| Nigerians | 20.9 /100 | #201 | Fair 21.4% |