Basque vs Immigrants from Denmark Single Female Poverty
COMPARE
Basque
Immigrants from Denmark
Single Female Poverty
Single Female Poverty Comparison
Basques
Immigrants from Denmark
21.3%
SINGLE FEMALE POVERTY
28.1/ 100
METRIC RATING
193rd/ 347
METRIC RANK
20.5%
SINGLE FEMALE POVERTY
80.5/ 100
METRIC RATING
150th/ 347
METRIC RANK
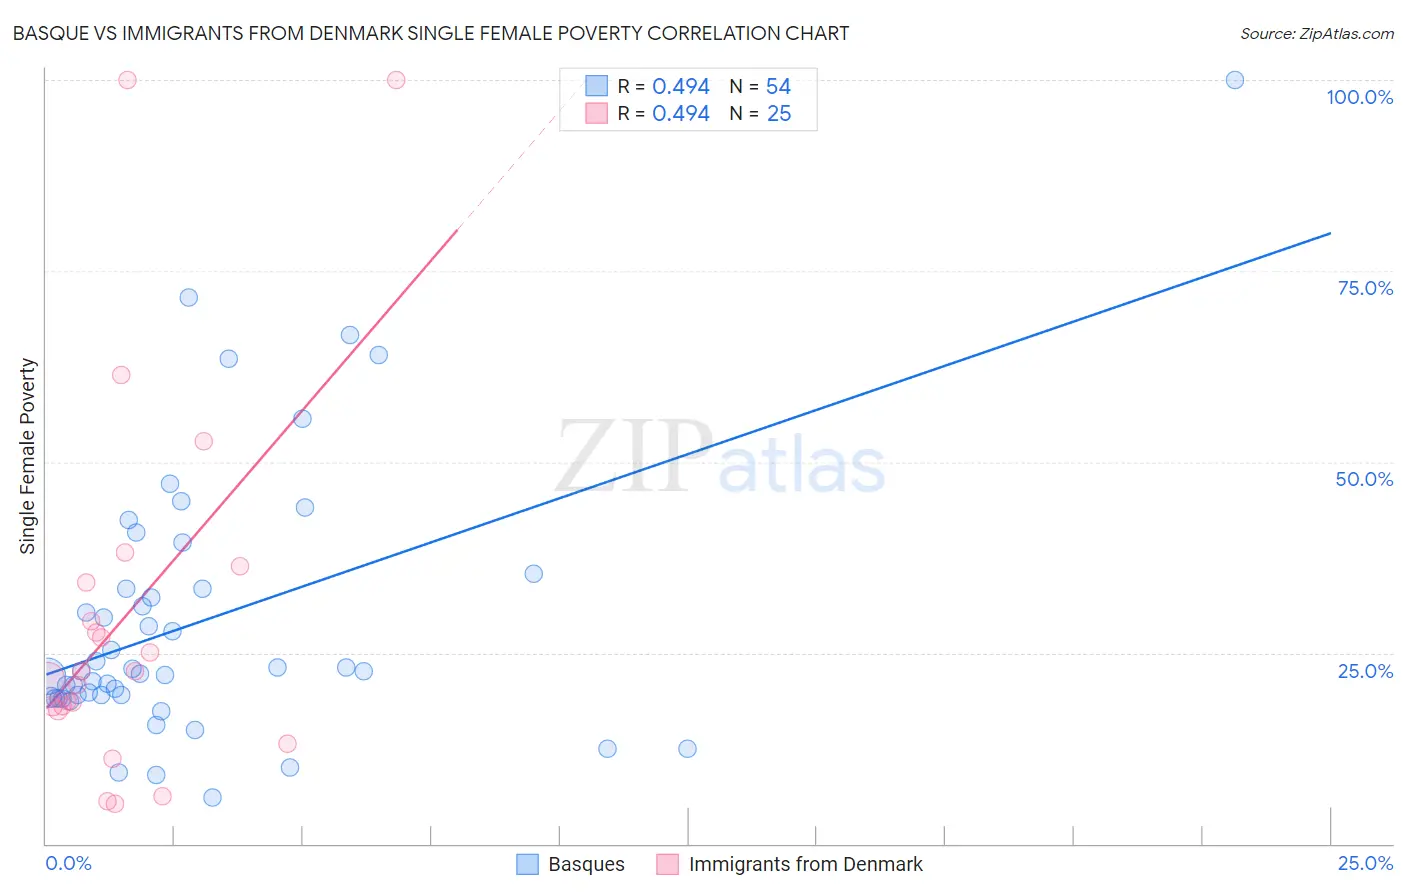
Basque vs Immigrants from Denmark Single Female Poverty Correlation Chart
The statistical analysis conducted on geographies consisting of 164,728,632 people shows a moderate positive correlation between the proportion of Basques and poverty level among single females in the United States with a correlation coefficient (R) of 0.494 and weighted average of 21.3%. Similarly, the statistical analysis conducted on geographies consisting of 135,190,305 people shows a moderate positive correlation between the proportion of Immigrants from Denmark and poverty level among single females in the United States with a correlation coefficient (R) of 0.494 and weighted average of 20.5%, a difference of 3.8%.
Single Female Poverty Correlation Summary
| Measurement | Basque | Immigrants from Denmark |
| Minimum | 6.1% | 5.3% |
| Maximum | 100.0% | 100.0% |
| Range | 93.9% | 94.7% |
| Mean | 29.2% | 30.0% |
| Median | 22.6% | 22.5% |
| Interquartile 25% (IQ1) | 19.2% | 17.7% |
| Interquartile 75% (IQ3) | 33.4% | 35.3% |
| Interquartile Range (IQR) | 14.2% | 17.6% |
| Standard Deviation (Sample) | 17.9% | 24.9% |
| Standard Deviation (Population) | 17.8% | 24.4% |
Similar Demographics by Single Female Poverty
Demographics Similar to Basques by Single Female Poverty
In terms of single female poverty, the demographic groups most similar to Basques are Czechoslovakian (21.3%, a difference of 0.030%), Nicaraguan (21.3%, a difference of 0.040%), Immigrants from Saudi Arabia (21.3%, a difference of 0.070%), Japanese (21.3%, a difference of 0.13%), and Immigrants from Jamaica (21.3%, a difference of 0.18%).
| Demographics | Rating | Rank | Single Female Poverty |
| Hawaiians | 37.7 /100 | #186 | Fair 21.2% |
| Immigrants | Nigeria | 36.8 /100 | #187 | Fair 21.2% |
| Yugoslavians | 35.4 /100 | #188 | Fair 21.2% |
| Immigrants | Cuba | 35.3 /100 | #189 | Fair 21.2% |
| Trinidadians and Tobagonians | 35.2 /100 | #190 | Fair 21.2% |
| Immigrants | Germany | 31.1 /100 | #191 | Fair 21.3% |
| Immigrants | Jamaica | 30.5 /100 | #192 | Fair 21.3% |
| Basques | 28.1 /100 | #193 | Fair 21.3% |
| Czechoslovakians | 27.7 /100 | #194 | Fair 21.3% |
| Nicaraguans | 27.6 /100 | #195 | Fair 21.3% |
| Immigrants | Saudi Arabia | 27.1 /100 | #196 | Fair 21.3% |
| Japanese | 26.4 /100 | #197 | Fair 21.3% |
| Swiss | 24.2 /100 | #198 | Fair 21.4% |
| Immigrants | Immigrants | 22.0 /100 | #199 | Fair 21.4% |
| Irish | 21.4 /100 | #200 | Fair 21.4% |
Demographics Similar to Immigrants from Denmark by Single Female Poverty
In terms of single female poverty, the demographic groups most similar to Immigrants from Denmark are Puget Sound Salish (20.6%, a difference of 0.090%), Portuguese (20.5%, a difference of 0.10%), Immigrants from Uruguay (20.6%, a difference of 0.28%), Swedish (20.6%, a difference of 0.33%), and Immigrants from Western Europe (20.6%, a difference of 0.36%).
| Demographics | Rating | Rank | Single Female Poverty |
| Australians | 88.4 /100 | #143 | Excellent 20.3% |
| Immigrants | Uzbekistan | 88.3 /100 | #144 | Excellent 20.3% |
| Austrians | 85.8 /100 | #145 | Excellent 20.4% |
| Venezuelans | 85.5 /100 | #146 | Excellent 20.4% |
| South Africans | 85.3 /100 | #147 | Excellent 20.4% |
| Luxembourgers | 84.9 /100 | #148 | Excellent 20.4% |
| Portuguese | 81.5 /100 | #149 | Excellent 20.5% |
| Immigrants | Denmark | 80.5 /100 | #150 | Excellent 20.5% |
| Puget Sound Salish | 79.6 /100 | #151 | Good 20.6% |
| Immigrants | Uruguay | 77.7 /100 | #152 | Good 20.6% |
| Swedes | 77.1 /100 | #153 | Good 20.6% |
| Immigrants | Western Europe | 76.7 /100 | #154 | Good 20.6% |
| Samoans | 76.0 /100 | #155 | Good 20.6% |
| South American Indians | 75.7 /100 | #156 | Good 20.6% |
| Immigrants | Oceania | 74.3 /100 | #157 | Good 20.7% |