Yuman vs Apache Single Female Poverty
COMPARE
Yuman
Apache
Single Female Poverty
Single Female Poverty Comparison
Yuman
Apache
29.4%
SINGLE FEMALE POVERTY
0.0/ 100
METRIC RATING
337th/ 347
METRIC RANK
27.7%
SINGLE FEMALE POVERTY
0.0/ 100
METRIC RATING
328th/ 347
METRIC RANK
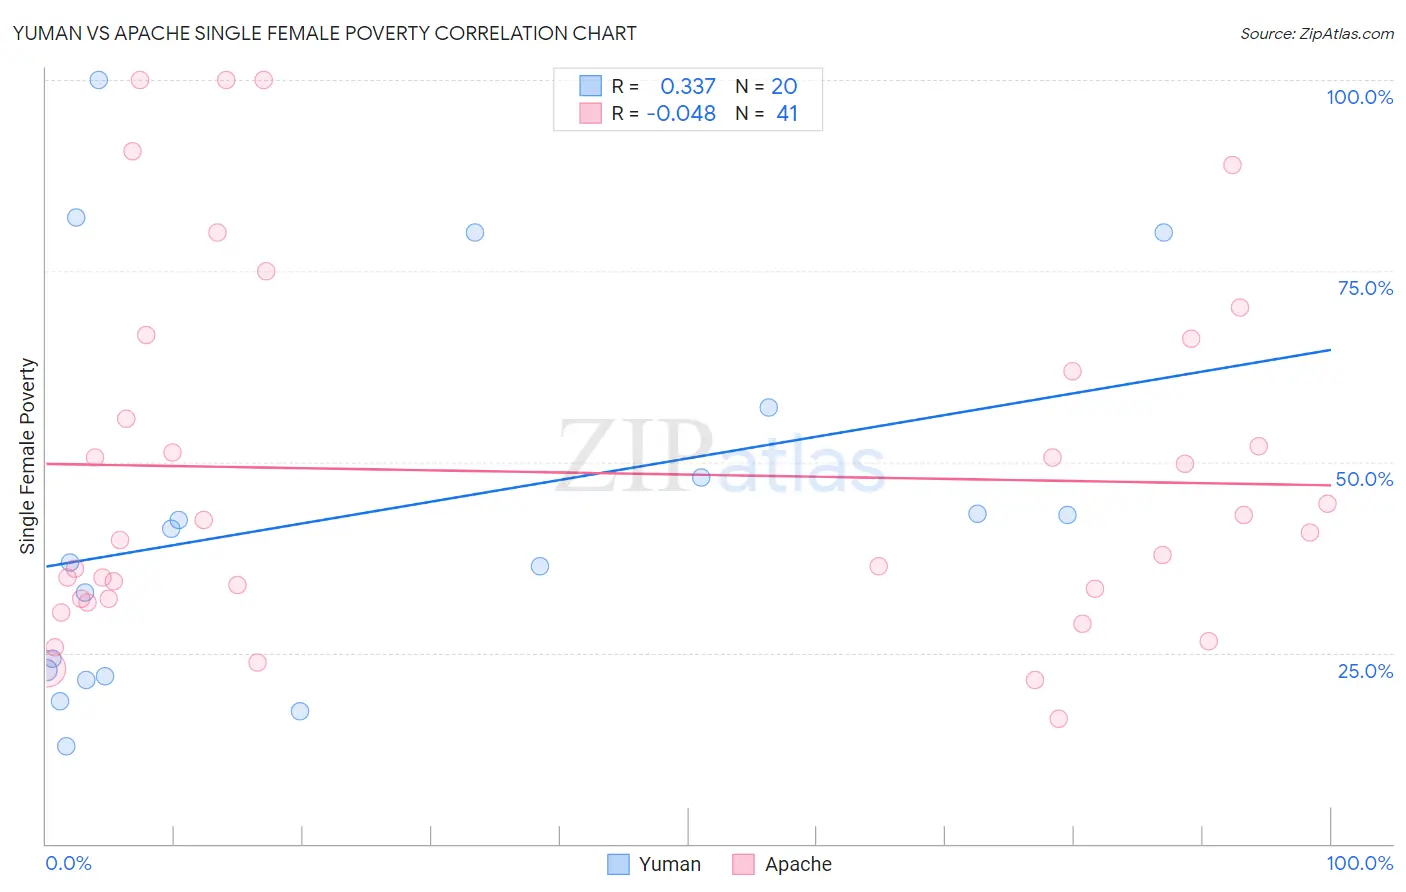
Yuman vs Apache Single Female Poverty Correlation Chart
The statistical analysis conducted on geographies consisting of 40,574,686 people shows a mild positive correlation between the proportion of Yuman and poverty level among single females in the United States with a correlation coefficient (R) of 0.337 and weighted average of 29.4%. Similarly, the statistical analysis conducted on geographies consisting of 229,845,911 people shows no correlation between the proportion of Apache and poverty level among single females in the United States with a correlation coefficient (R) of -0.048 and weighted average of 27.7%, a difference of 6.2%.
Single Female Poverty Correlation Summary
| Measurement | Yuman | Apache |
| Minimum | 12.7% | 16.4% |
| Maximum | 100.0% | 100.0% |
| Range | 87.3% | 83.6% |
| Mean | 43.1% | 48.6% |
| Median | 39.0% | 40.7% |
| Interquartile 25% (IQ1) | 22.3% | 32.1% |
| Interquartile 75% (IQ3) | 52.6% | 64.0% |
| Interquartile Range (IQR) | 30.3% | 31.9% |
| Standard Deviation (Sample) | 24.9% | 23.3% |
| Standard Deviation (Population) | 24.2% | 23.0% |
Demographics Similar to Yuman and Apache by Single Female Poverty
In terms of single female poverty, the demographic groups most similar to Yuman are Colville (29.1%, a difference of 1.3%), Immigrants from Yemen (28.9%, a difference of 1.8%), Pueblo (28.6%, a difference of 2.9%), Pima (30.3%, a difference of 3.0%), and Cheyenne (30.4%, a difference of 3.2%). Similarly, the demographic groups most similar to Apache are Menominee (27.8%, a difference of 0.46%), Dutch West Indian (27.5%, a difference of 0.91%), Creek (27.4%, a difference of 0.99%), Hopi (28.0%, a difference of 1.2%), and Native/Alaskan (28.2%, a difference of 1.8%).
| Demographics | Rating | Rank | Single Female Poverty |
| Seminole | 0.0 /100 | #322 | Tragic 26.8% |
| Chippewa | 0.0 /100 | #323 | Tragic 26.8% |
| Kiowa | 0.0 /100 | #324 | Tragic 26.9% |
| Choctaw | 0.0 /100 | #325 | Tragic 27.2% |
| Creek | 0.0 /100 | #326 | Tragic 27.4% |
| Dutch West Indians | 0.0 /100 | #327 | Tragic 27.5% |
| Apache | 0.0 /100 | #328 | Tragic 27.7% |
| Menominee | 0.0 /100 | #329 | Tragic 27.8% |
| Hopi | 0.0 /100 | #330 | Tragic 28.0% |
| Natives/Alaskans | 0.0 /100 | #331 | Tragic 28.2% |
| Yakama | 0.0 /100 | #332 | Tragic 28.3% |
| Ute | 0.0 /100 | #333 | Tragic 28.4% |
| Pueblo | 0.0 /100 | #334 | Tragic 28.6% |
| Immigrants | Yemen | 0.0 /100 | #335 | Tragic 28.9% |
| Colville | 0.0 /100 | #336 | Tragic 29.1% |
| Yuman | 0.0 /100 | #337 | Tragic 29.4% |
| Pima | 0.0 /100 | #338 | Tragic 30.3% |
| Cheyenne | 0.0 /100 | #339 | Tragic 30.4% |
| Cajuns | 0.0 /100 | #340 | Tragic 30.6% |
| Sioux | 0.0 /100 | #341 | Tragic 31.3% |
| Navajo | 0.0 /100 | #342 | Tragic 31.7% |