Basque vs Apache Median Male Earnings
COMPARE
Basque
Apache
Median Male Earnings
Median Male Earnings Comparison
Basques
Apache
$55,370
MEDIAN MALE EARNINGS
70.3/ 100
METRIC RATING
160th/ 347
METRIC RANK
$46,429
MEDIAN MALE EARNINGS
0.0/ 100
METRIC RATING
311th/ 347
METRIC RANK
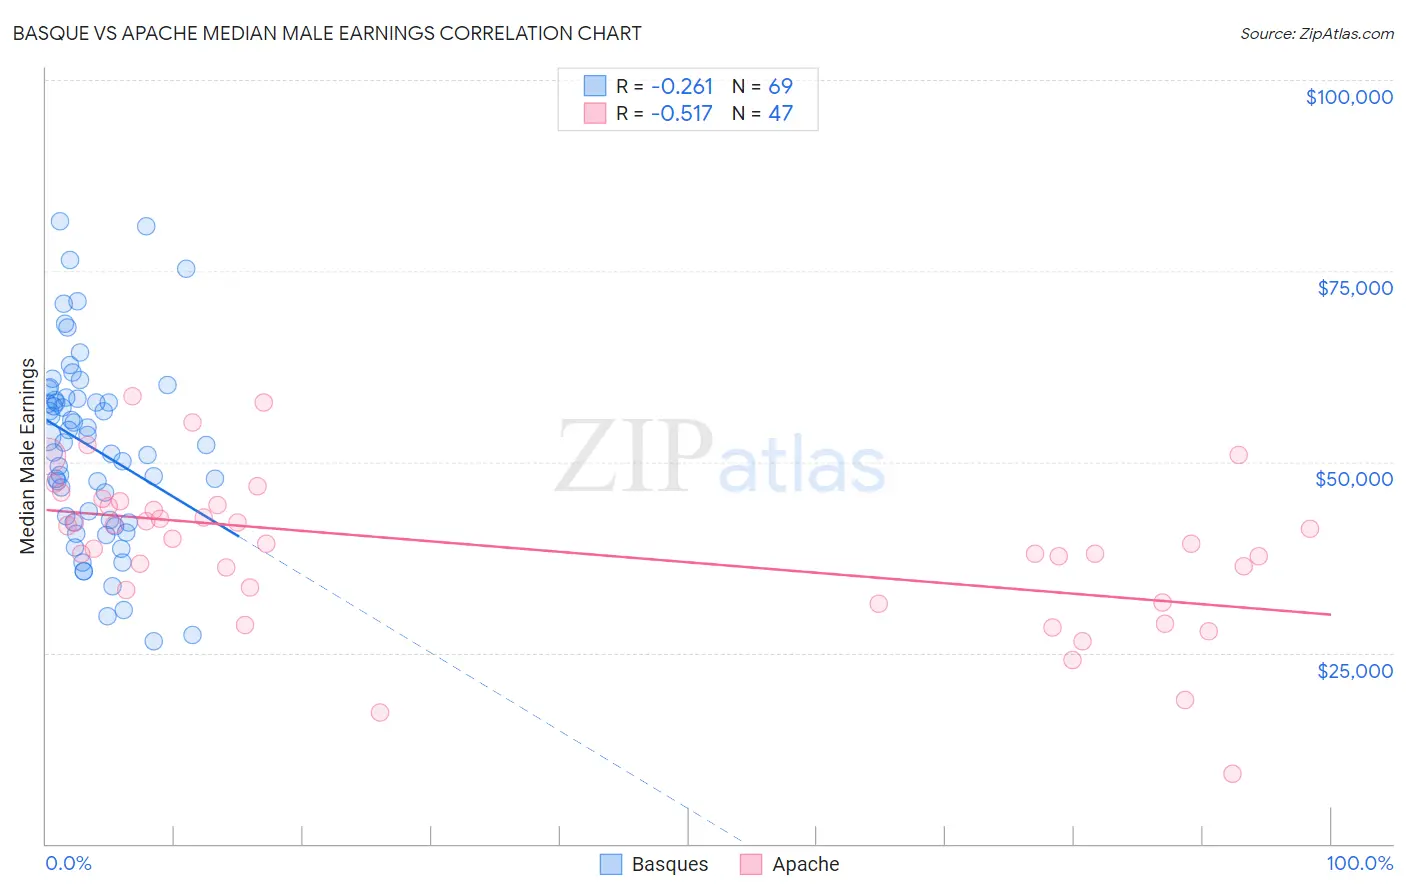
Basque vs Apache Median Male Earnings Correlation Chart
The statistical analysis conducted on geographies consisting of 165,750,902 people shows a weak negative correlation between the proportion of Basques and median male earnings in the United States with a correlation coefficient (R) of -0.261 and weighted average of $55,370. Similarly, the statistical analysis conducted on geographies consisting of 231,058,501 people shows a substantial negative correlation between the proportion of Apache and median male earnings in the United States with a correlation coefficient (R) of -0.517 and weighted average of $46,429, a difference of 19.3%.
Median Male Earnings Correlation Summary
| Measurement | Basque | Apache |
| Minimum | $26,442 | $9,161 |
| Maximum | $81,428 | $58,566 |
| Range | $54,986 | $49,405 |
| Mean | $51,886 | $38,686 |
| Median | $52,492 | $39,318 |
| Interquartile 25% (IQ1) | $42,224 | $33,190 |
| Interquartile 75% (IQ3) | $58,280 | $44,375 |
| Interquartile Range (IQR) | $16,056 | $11,185 |
| Standard Deviation (Sample) | $12,223 | $10,062 |
| Standard Deviation (Population) | $12,134 | $9,955 |
Similar Demographics by Median Male Earnings
Demographics Similar to Basques by Median Male Earnings
In terms of median male earnings, the demographic groups most similar to Basques are Czechoslovakian ($55,382, a difference of 0.020%), Alsatian ($55,380, a difference of 0.020%), Belgian ($55,361, a difference of 0.020%), French ($55,350, a difference of 0.040%), and Icelander ($55,415, a difference of 0.080%).
| Demographics | Rating | Rank | Median Male Earnings |
| Immigrants | Nepal | 75.0 /100 | #153 | Good $55,615 |
| Taiwanese | 73.9 /100 | #154 | Good $55,556 |
| Scandinavians | 73.4 /100 | #155 | Good $55,527 |
| Immigrants | Ethiopia | 71.6 /100 | #156 | Good $55,434 |
| Icelanders | 71.2 /100 | #157 | Good $55,415 |
| Czechoslovakians | 70.5 /100 | #158 | Good $55,382 |
| Alsatians | 70.5 /100 | #159 | Good $55,380 |
| Basques | 70.3 /100 | #160 | Good $55,370 |
| Belgians | 70.1 /100 | #161 | Good $55,361 |
| French | 69.9 /100 | #162 | Good $55,350 |
| Ugandans | 68.6 /100 | #163 | Good $55,290 |
| Immigrants | South Eastern Asia | 67.6 /100 | #164 | Good $55,241 |
| Immigrants | Portugal | 66.3 /100 | #165 | Good $55,182 |
| Germans | 61.6 /100 | #166 | Good $54,974 |
| Immigrants | Fiji | 61.2 /100 | #167 | Good $54,958 |
Demographics Similar to Apache by Median Male Earnings
In terms of median male earnings, the demographic groups most similar to Apache are Hispanic or Latino ($46,419, a difference of 0.020%), Honduran ($46,374, a difference of 0.12%), Chippewa ($46,368, a difference of 0.13%), Cuban ($46,580, a difference of 0.33%), and Creek ($46,594, a difference of 0.36%).
| Demographics | Rating | Rank | Median Male Earnings |
| Bangladeshis | 0.1 /100 | #304 | Tragic $46,744 |
| Guatemalans | 0.0 /100 | #305 | Tragic $46,736 |
| Dutch West Indians | 0.0 /100 | #306 | Tragic $46,656 |
| Immigrants | Dominican Republic | 0.0 /100 | #307 | Tragic $46,655 |
| Ottawa | 0.0 /100 | #308 | Tragic $46,611 |
| Creek | 0.0 /100 | #309 | Tragic $46,594 |
| Cubans | 0.0 /100 | #310 | Tragic $46,580 |
| Apache | 0.0 /100 | #311 | Tragic $46,429 |
| Hispanics or Latinos | 0.0 /100 | #312 | Tragic $46,419 |
| Hondurans | 0.0 /100 | #313 | Tragic $46,374 |
| Chippewa | 0.0 /100 | #314 | Tragic $46,368 |
| Immigrants | Guatemala | 0.0 /100 | #315 | Tragic $46,244 |
| Immigrants | Caribbean | 0.0 /100 | #316 | Tragic $46,193 |
| Mexicans | 0.0 /100 | #317 | Tragic $46,147 |
| Cheyenne | 0.0 /100 | #318 | Tragic $46,062 |