Paiute vs Apache Single Female Poverty
COMPARE
Paiute
Apache
Single Female Poverty
Single Female Poverty Comparison
Paiute
Apache
25.5%
SINGLE FEMALE POVERTY
0.0/ 100
METRIC RATING
312th/ 347
METRIC RANK
27.7%
SINGLE FEMALE POVERTY
0.0/ 100
METRIC RATING
328th/ 347
METRIC RANK
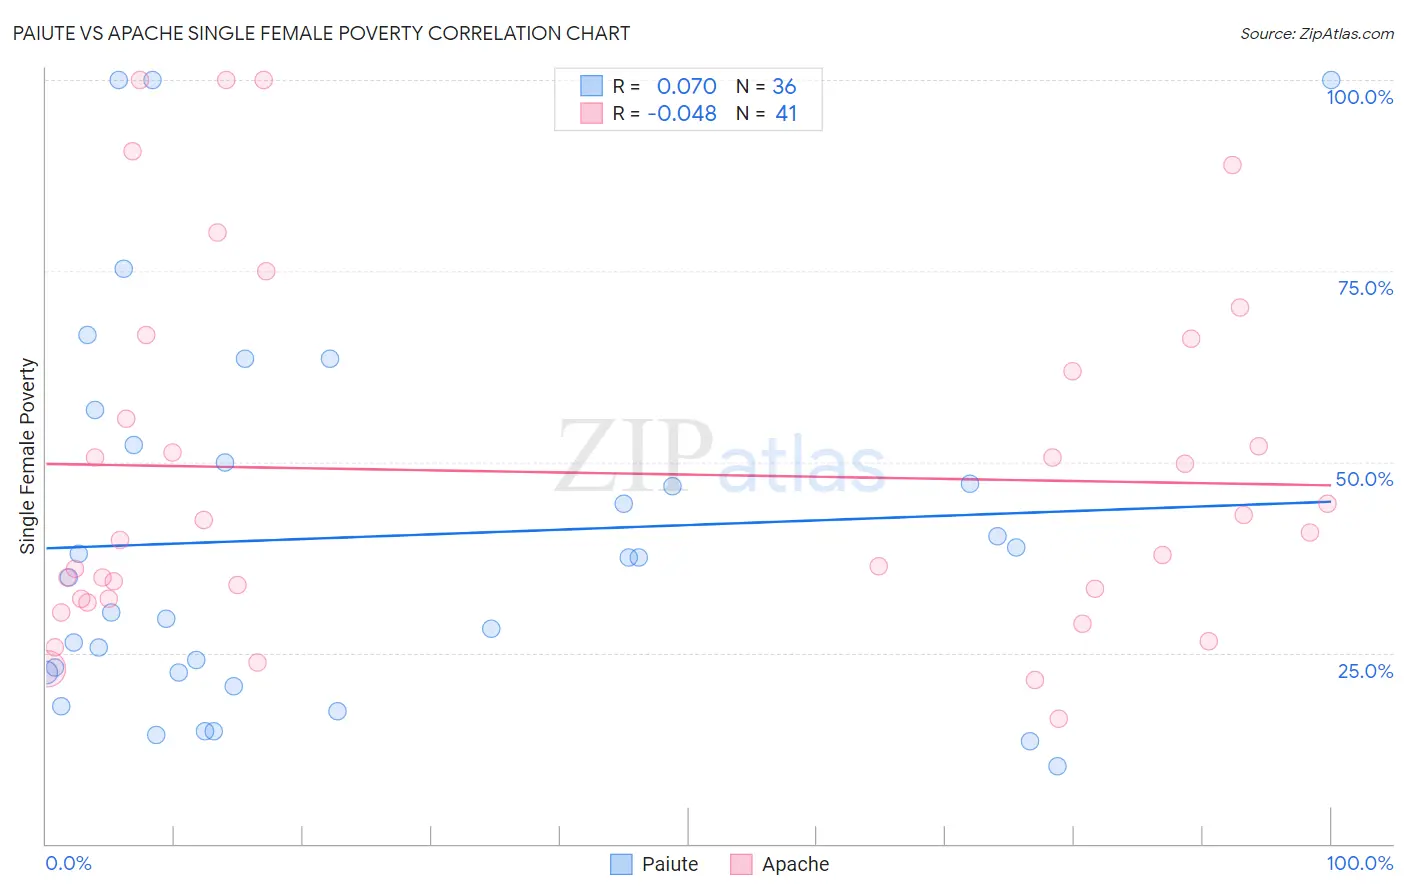
Paiute vs Apache Single Female Poverty Correlation Chart
The statistical analysis conducted on geographies consisting of 58,262,204 people shows a slight positive correlation between the proportion of Paiute and poverty level among single females in the United States with a correlation coefficient (R) of 0.070 and weighted average of 25.5%. Similarly, the statistical analysis conducted on geographies consisting of 229,845,911 people shows no correlation between the proportion of Apache and poverty level among single females in the United States with a correlation coefficient (R) of -0.048 and weighted average of 27.7%, a difference of 8.5%.
Single Female Poverty Correlation Summary
| Measurement | Paiute | Apache |
| Minimum | 10.1% | 16.4% |
| Maximum | 100.0% | 100.0% |
| Range | 89.9% | 83.6% |
| Mean | 40.2% | 48.6% |
| Median | 36.2% | 40.7% |
| Interquartile 25% (IQ1) | 22.3% | 32.1% |
| Interquartile 75% (IQ3) | 51.1% | 64.0% |
| Interquartile Range (IQR) | 28.8% | 31.9% |
| Standard Deviation (Sample) | 24.7% | 23.3% |
| Standard Deviation (Population) | 24.4% | 23.0% |
Demographics Similar to Paiute and Apache by Single Female Poverty
In terms of single female poverty, the demographic groups most similar to Paiute are Immigrants from Honduras (25.5%, a difference of 0.050%), Comanche (25.6%, a difference of 0.11%), Central American Indian (25.5%, a difference of 0.33%), Cherokee (25.7%, a difference of 0.47%), and Iroquois (25.7%, a difference of 0.79%). Similarly, the demographic groups most similar to Apache are Menominee (27.8%, a difference of 0.46%), Dutch West Indian (27.5%, a difference of 0.91%), Creek (27.4%, a difference of 0.99%), Hopi (28.0%, a difference of 1.2%), and Choctaw (27.2%, a difference of 1.9%).
| Demographics | Rating | Rank | Single Female Poverty |
| Central American Indians | 0.0 /100 | #310 | Tragic 25.5% |
| Immigrants | Honduras | 0.0 /100 | #311 | Tragic 25.5% |
| Paiute | 0.0 /100 | #312 | Tragic 25.5% |
| Comanche | 0.0 /100 | #313 | Tragic 25.6% |
| Cherokee | 0.0 /100 | #314 | Tragic 25.7% |
| Iroquois | 0.0 /100 | #315 | Tragic 25.7% |
| Immigrants | Somalia | 0.0 /100 | #316 | Tragic 25.8% |
| Ottawa | 0.0 /100 | #317 | Tragic 26.0% |
| Chickasaw | 0.0 /100 | #318 | Tragic 26.3% |
| Blacks/African Americans | 0.0 /100 | #319 | Tragic 26.4% |
| Arapaho | 0.0 /100 | #320 | Tragic 26.4% |
| Yup'ik | 0.0 /100 | #321 | Tragic 26.6% |
| Seminole | 0.0 /100 | #322 | Tragic 26.8% |
| Chippewa | 0.0 /100 | #323 | Tragic 26.8% |
| Kiowa | 0.0 /100 | #324 | Tragic 26.9% |
| Choctaw | 0.0 /100 | #325 | Tragic 27.2% |
| Creek | 0.0 /100 | #326 | Tragic 27.4% |
| Dutch West Indians | 0.0 /100 | #327 | Tragic 27.5% |
| Apache | 0.0 /100 | #328 | Tragic 27.7% |
| Menominee | 0.0 /100 | #329 | Tragic 27.8% |
| Hopi | 0.0 /100 | #330 | Tragic 28.0% |