Basque vs Serbian Single Female Poverty
COMPARE
Basque
Serbian
Single Female Poverty
Single Female Poverty Comparison
Basques
Serbians
21.3%
SINGLE FEMALE POVERTY
28.1/ 100
METRIC RATING
193rd/ 347
METRIC RANK
20.1%
SINGLE FEMALE POVERTY
93.3/ 100
METRIC RATING
126th/ 347
METRIC RANK
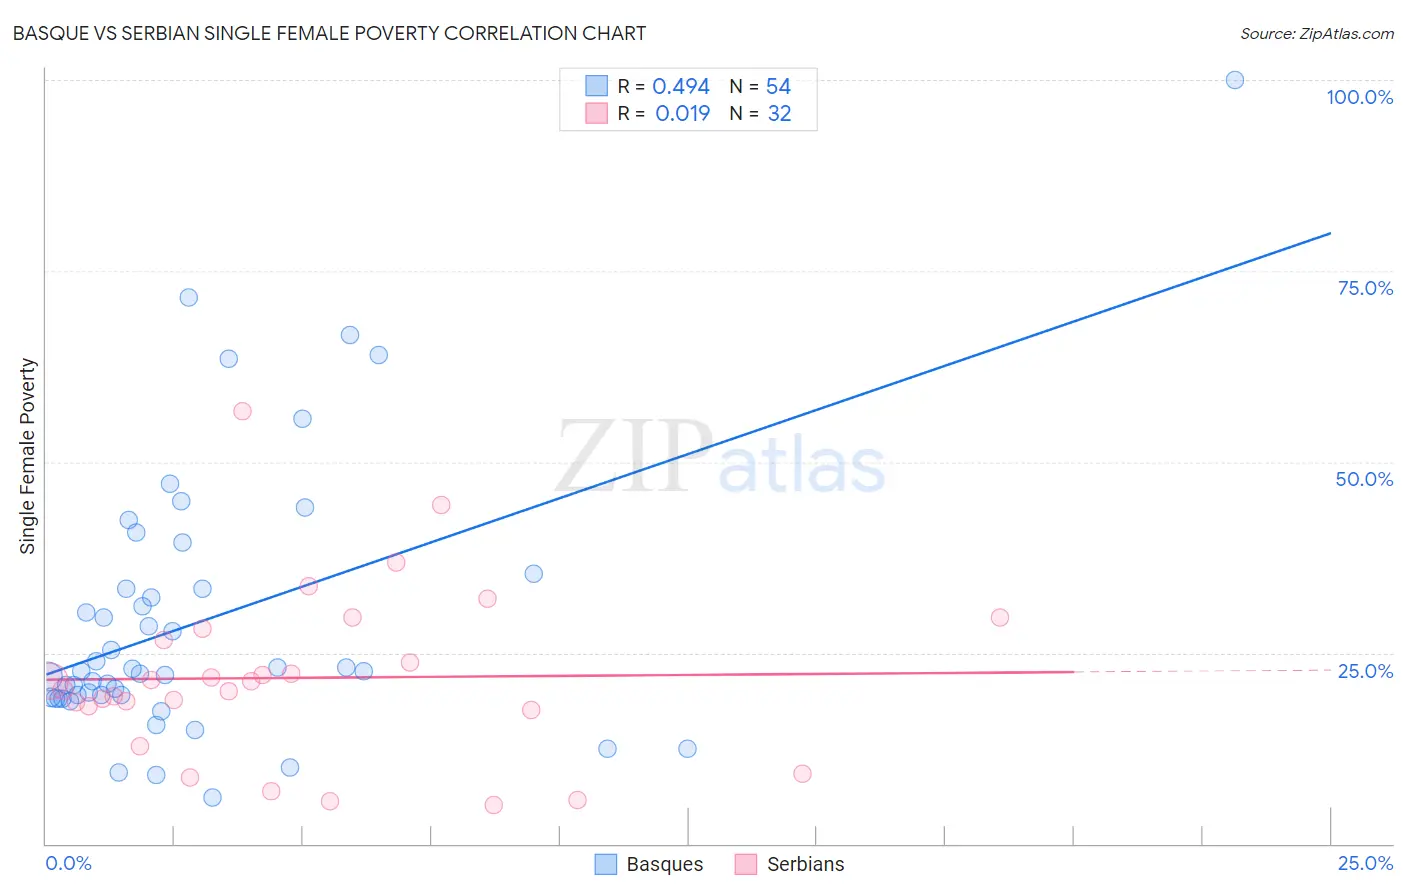
Basque vs Serbian Single Female Poverty Correlation Chart
The statistical analysis conducted on geographies consisting of 164,728,632 people shows a moderate positive correlation between the proportion of Basques and poverty level among single females in the United States with a correlation coefficient (R) of 0.494 and weighted average of 21.3%. Similarly, the statistical analysis conducted on geographies consisting of 264,350,230 people shows no correlation between the proportion of Serbians and poverty level among single females in the United States with a correlation coefficient (R) of 0.019 and weighted average of 20.1%, a difference of 5.8%.
Single Female Poverty Correlation Summary
| Measurement | Basque | Serbian |
| Minimum | 6.1% | 5.0% |
| Maximum | 100.0% | 56.7% |
| Range | 93.9% | 51.7% |
| Mean | 29.2% | 21.7% |
| Median | 22.6% | 20.7% |
| Interquartile 25% (IQ1) | 19.2% | 17.8% |
| Interquartile 75% (IQ3) | 33.4% | 27.4% |
| Interquartile Range (IQR) | 14.2% | 9.6% |
| Standard Deviation (Sample) | 17.9% | 11.2% |
| Standard Deviation (Population) | 17.8% | 11.1% |
Similar Demographics by Single Female Poverty
Demographics Similar to Basques by Single Female Poverty
In terms of single female poverty, the demographic groups most similar to Basques are Czechoslovakian (21.3%, a difference of 0.030%), Nicaraguan (21.3%, a difference of 0.040%), Immigrants from Saudi Arabia (21.3%, a difference of 0.070%), Japanese (21.3%, a difference of 0.13%), and Immigrants from Jamaica (21.3%, a difference of 0.18%).
| Demographics | Rating | Rank | Single Female Poverty |
| Hawaiians | 37.7 /100 | #186 | Fair 21.2% |
| Immigrants | Nigeria | 36.8 /100 | #187 | Fair 21.2% |
| Yugoslavians | 35.4 /100 | #188 | Fair 21.2% |
| Immigrants | Cuba | 35.3 /100 | #189 | Fair 21.2% |
| Trinidadians and Tobagonians | 35.2 /100 | #190 | Fair 21.2% |
| Immigrants | Germany | 31.1 /100 | #191 | Fair 21.3% |
| Immigrants | Jamaica | 30.5 /100 | #192 | Fair 21.3% |
| Basques | 28.1 /100 | #193 | Fair 21.3% |
| Czechoslovakians | 27.7 /100 | #194 | Fair 21.3% |
| Nicaraguans | 27.6 /100 | #195 | Fair 21.3% |
| Immigrants | Saudi Arabia | 27.1 /100 | #196 | Fair 21.3% |
| Japanese | 26.4 /100 | #197 | Fair 21.3% |
| Swiss | 24.2 /100 | #198 | Fair 21.4% |
| Immigrants | Immigrants | 22.0 /100 | #199 | Fair 21.4% |
| Irish | 21.4 /100 | #200 | Fair 21.4% |
Demographics Similar to Serbians by Single Female Poverty
In terms of single female poverty, the demographic groups most similar to Serbians are Mongolian (20.2%, a difference of 0.020%), Immigrants from Spain (20.2%, a difference of 0.13%), Immigrants from South Africa (20.1%, a difference of 0.17%), Immigrants from Morocco (20.2%, a difference of 0.21%), and Immigrants from Hungary (20.2%, a difference of 0.23%).
| Demographics | Rating | Rank | Single Female Poverty |
| Immigrants | Ethiopia | 95.4 /100 | #119 | Exceptional 20.0% |
| South Americans | 95.1 /100 | #120 | Exceptional 20.0% |
| Immigrants | Switzerland | 95.1 /100 | #121 | Exceptional 20.0% |
| Immigrants | South America | 95.0 /100 | #122 | Exceptional 20.0% |
| Brazilians | 94.4 /100 | #123 | Exceptional 20.1% |
| Immigrants | Chile | 94.3 /100 | #124 | Exceptional 20.1% |
| Immigrants | South Africa | 93.9 /100 | #125 | Exceptional 20.1% |
| Serbians | 93.3 /100 | #126 | Exceptional 20.1% |
| Mongolians | 93.2 /100 | #127 | Exceptional 20.2% |
| Immigrants | Spain | 92.7 /100 | #128 | Exceptional 20.2% |
| Immigrants | Morocco | 92.4 /100 | #129 | Exceptional 20.2% |
| Immigrants | Hungary | 92.3 /100 | #130 | Exceptional 20.2% |
| Pakistanis | 92.1 /100 | #131 | Exceptional 20.2% |
| Uruguayans | 92.1 /100 | #132 | Exceptional 20.2% |
| Immigrants | England | 91.9 /100 | #133 | Exceptional 20.2% |