Zip Codes with the Highest Percentage of Households with Income Below $10,000 in Vineland, NJ
RELATED REPORTS & OPTIONS
Household Income | $0-10k
Vineland
Compare Zip Codes
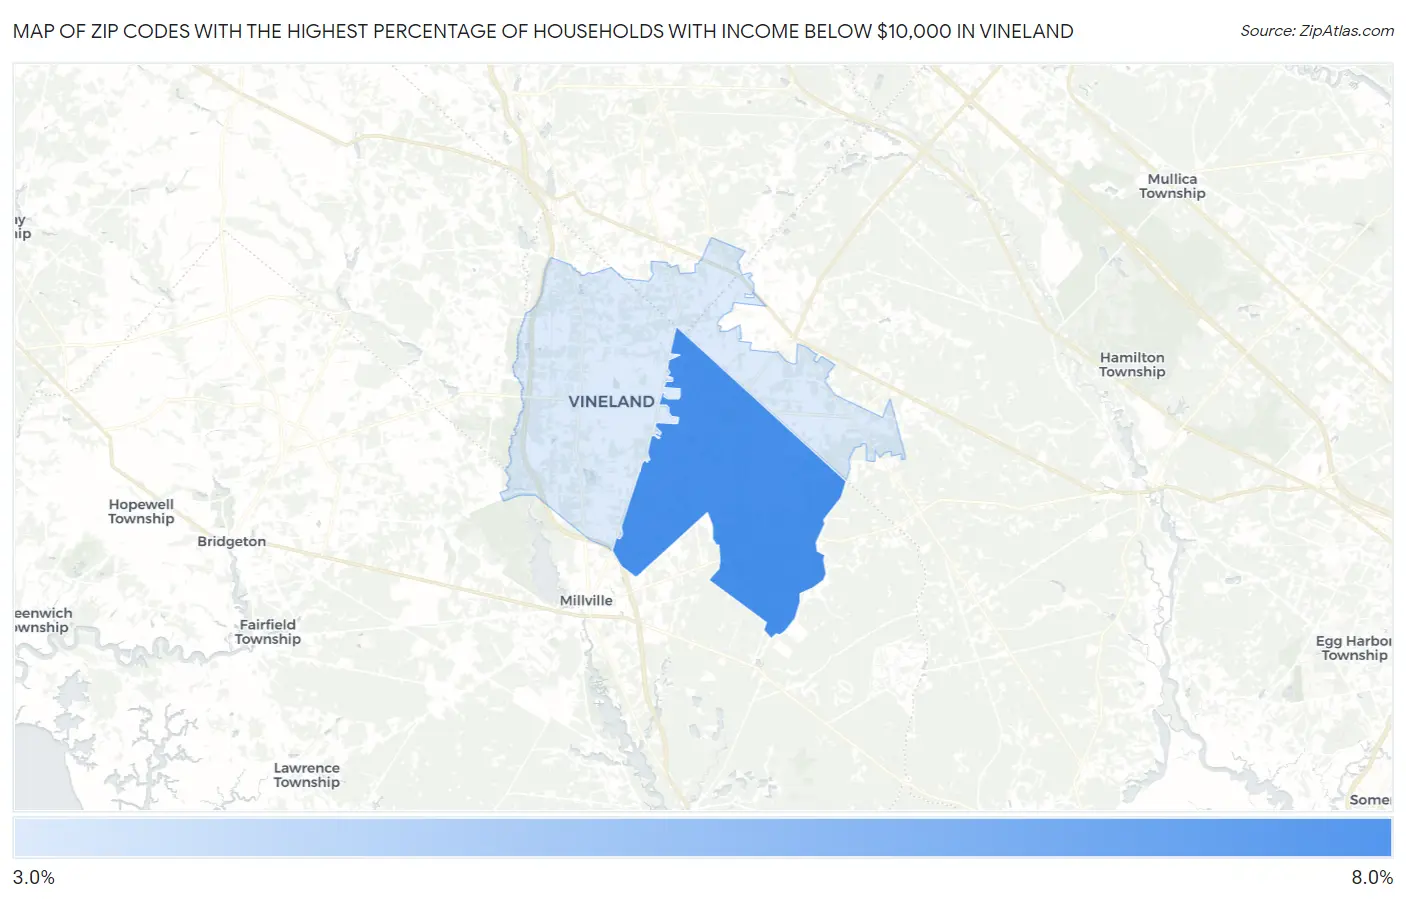
Map of Zip Codes with the Highest Percentage of Households with Income Below $10,000 in Vineland
3.6%
7.1%
Zip Codes with the Highest Percentage of Households with Income Below $10,000 in Vineland, NJ
| Zip Code | Households with Income < $10k | vs State | vs National | |
| 1. | 08361 | 7.1% | 4.1%(+3.00)#49 | 4.9%(+2.20)#6,801 |
| 2. | 08360 | 3.6% | 4.1%(-0.500)#204 | 4.9%(-1.30)#16,792 |
1
Common Questions
What are the Top Zip Codes with the Highest Percentage of Households with Income Below $10,000 in Vineland, NJ?
Top Zip Codes with the Highest Percentage of Households with Income Below $10,000 in Vineland, NJ are:
What zip code has the Highest Percentage of Households with Income Below $10,000 in Vineland, NJ?
08361 has the Highest Percentage of Households with Income Below $10,000 in Vineland, NJ with 7.1%.
What is the Percentage of Households with Income Below $10,000 in Vineland, NJ?
Percentage of Households with Income Below $10,000 in Vineland is 4.7%.
What is the Percentage of Households with Income Below $10,000 in New Jersey?
Percentage of Households with Income Below $10,000 in New Jersey is 4.1%.
What is the Percentage of Households with Income Below $10,000 in the United States?
Percentage of Households with Income Below $10,000 in the United States is 4.9%.