Zip Codes with the Highest Percentage of Households Without a Vehicle in Grand Island, NE
RELATED REPORTS & OPTIONS
Households without a Cars
Grand Island
Compare Zip Codes
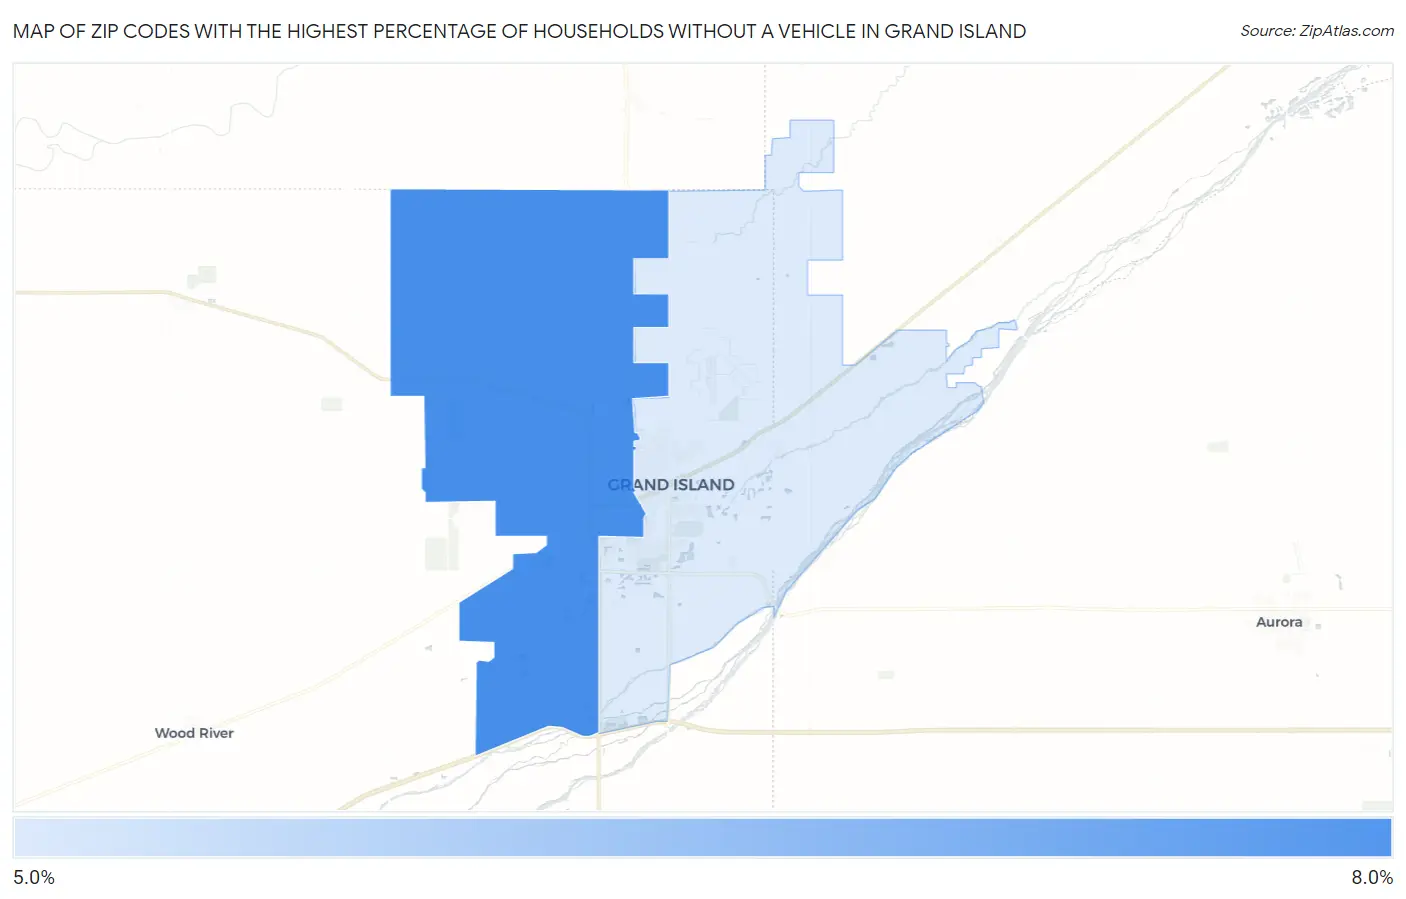
Map of Zip Codes with the Highest Percentage of Households Without a Vehicle in Grand Island
5.3%
6.2%
Zip Codes with the Highest Percentage of Households Without a Vehicle in Grand Island, NE
| Zip Code | Housholds Without a Car | vs State | vs National | |
| 1. | 68803 | 6.2% | 5.1%(+1.10)#84 | 8.3%(-2.10)#10,015 |
| 2. | 68801 | 5.3% | 5.1%(+0.200)#104 | 8.3%(-3.00)#12,095 |
1
Common Questions
What are the Top Zip Codes with the Highest Percentage of Households Without a Vehicle in Grand Island, NE?
Top Zip Codes with the Highest Percentage of Households Without a Vehicle in Grand Island, NE are:
What zip code has the Highest Percentage of Households Without a Vehicle in Grand Island, NE?
68803 has the Highest Percentage of Households Without a Vehicle in Grand Island, NE with 6.2%.
What is the Percentage of Households Without a Vehicle in Grand Island, NE?
Percentage of Households Without a Vehicle in Grand Island is 5.9%.
What is the Percentage of Households Without a Vehicle in Nebraska?
Percentage of Households Without a Vehicle in Nebraska is 5.1%.
What is the Percentage of Households Without a Vehicle in the United States?
Percentage of Households Without a Vehicle in the United States is 8.3%.