Zip Codes with the Lowest Per Capita Income in Northampton, MA
RELATED REPORTS & OPTIONS
Lowest Per Capita Income
Northampton
Compare Zip Codes
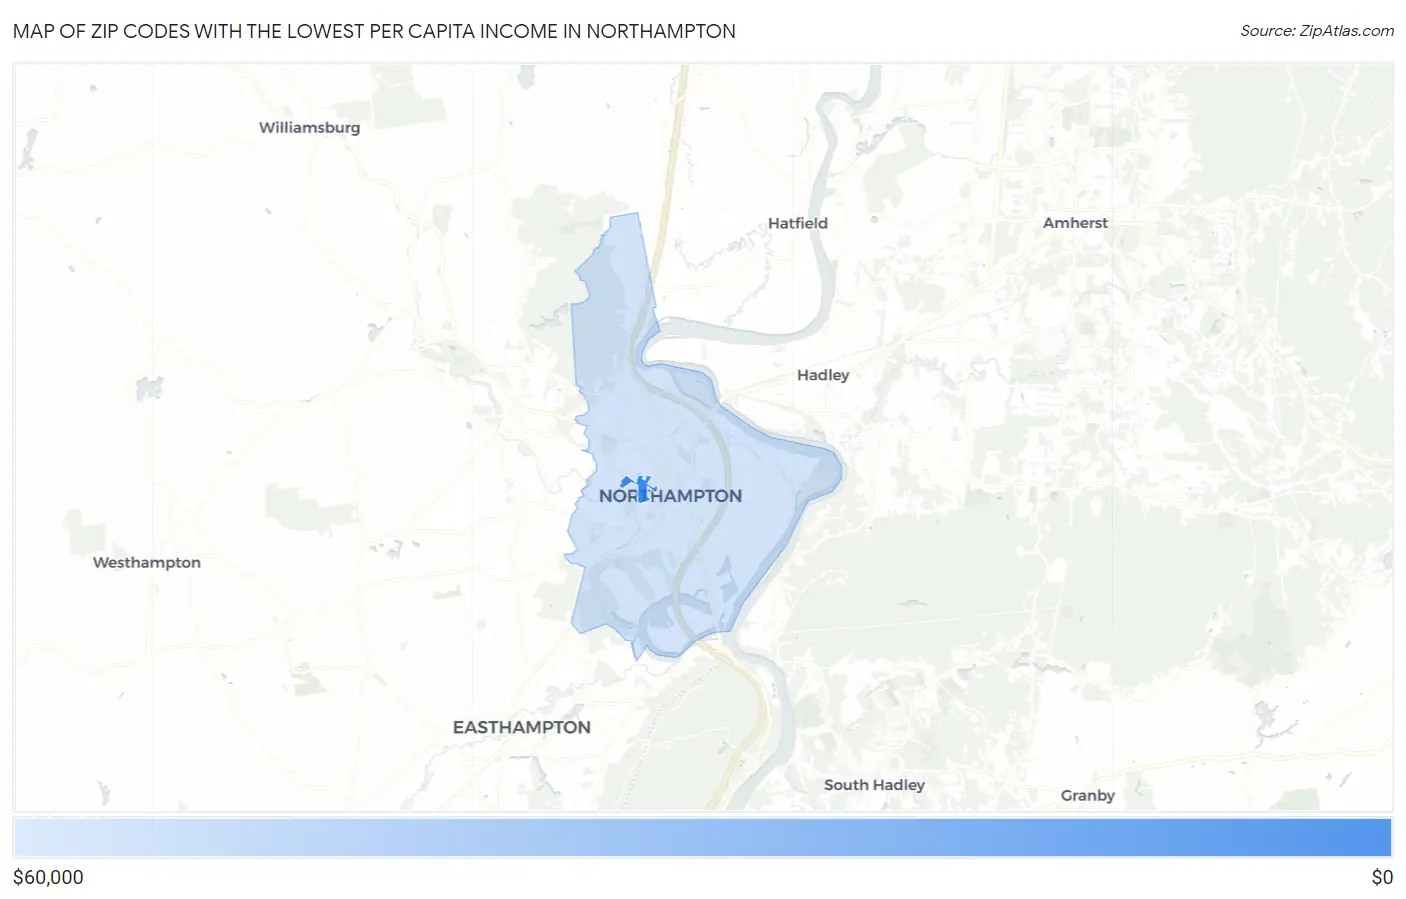
Map of Zip Codes with the Lowest Per Capita Income in Northampton
$54,147
$6,259
Zip Codes with the Lowest Per Capita Income in Northampton, MA
| Zip Code | Per Capita Income | vs State | vs National | |
| 1. | 01063 | $6,259 | $53,513(-47.3k)#4 | $41,261(-35.0k)#254 |
| 2. | 01060 | $54,147 | $53,513(+634)#300 | $41,261(+12.9k)#29,029 |
1
Common Questions
What are the Top Zip Codes with the Lowest Per Capita Income in Northampton, MA?
Top Zip Codes with the Lowest Per Capita Income in Northampton, MA are:
What zip code has the Lowest Per Capita Income in Northampton, MA?
01063 has the Lowest Per Capita Income in Northampton, MA with $6,259.
What is the Per Capita Income in Northampton, MA?
Per Capita Income in Northampton is $49,679.
What is the Per Capita Income in Massachusetts?
Per Capita Income in Massachusetts is $53,513.
What is the Per Capita Income in the United States?
Per Capita Income in the United States is $41,261.