Zip Codes with the Highest Percentage of Population Employed in Accommodation & Food Services in Marianna, FL
RELATED REPORTS & OPTIONS
Accommodation & Food Services
Marianna
Compare Zip Codes
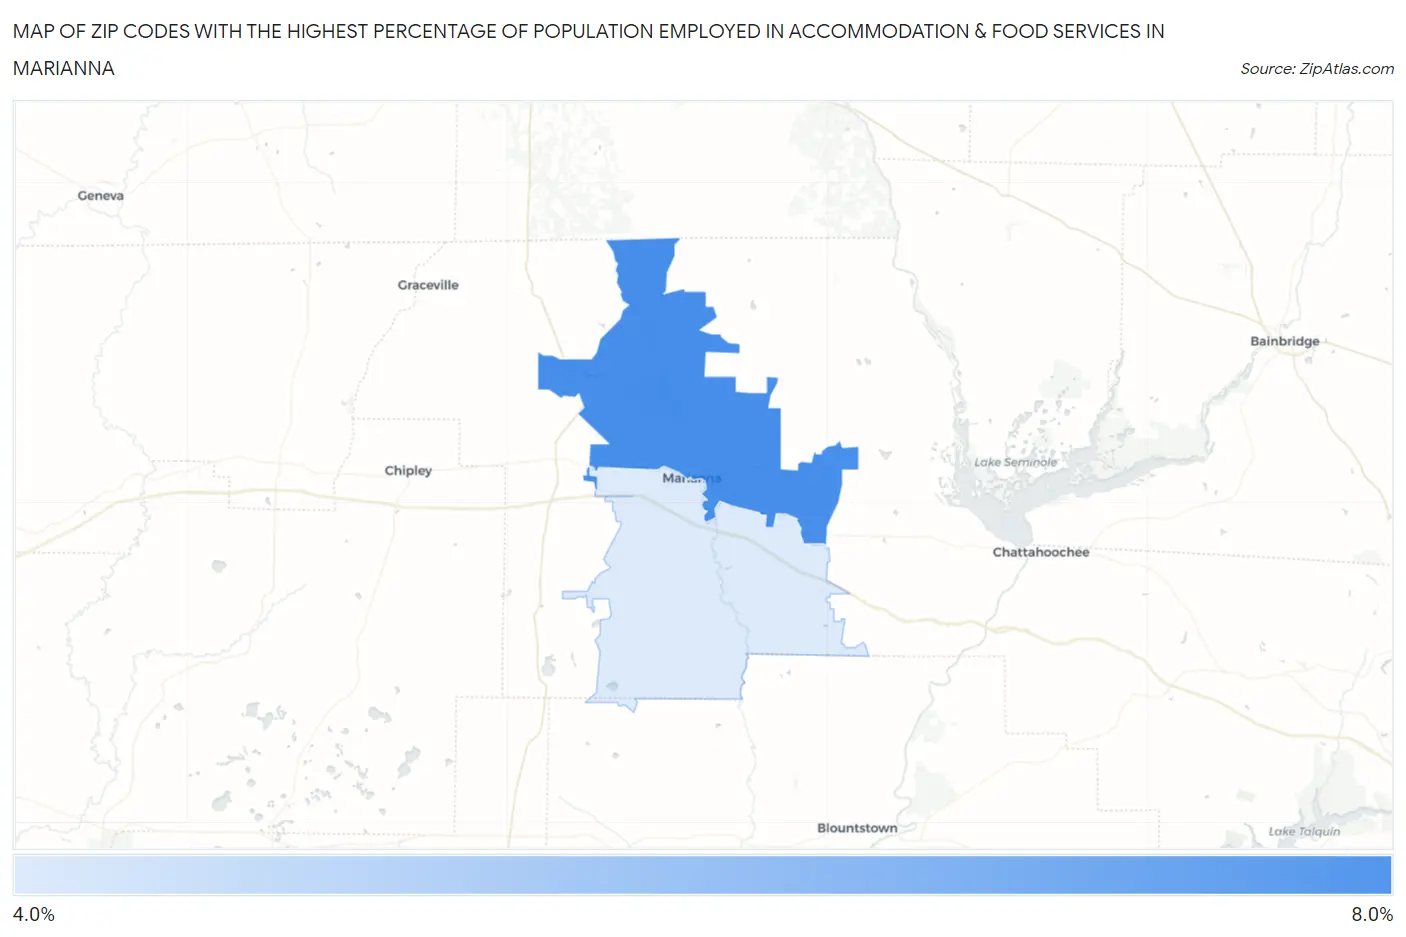
Map of Zip Codes with the Highest Percentage of Population Employed in Accommodation & Food Services in Marianna
4.5%
7.3%
Zip Codes with the Highest Percentage of Population Employed in Accommodation & Food Services in Marianna, FL
| Zip Code | % Employed | vs State | vs National | |
| 1. | 32446 | 7.3% | 8.4%(-1.06)#528 | 6.9%(+0.431)#9,482 |
| 2. | 32448 | 4.5% | 8.4%(-3.89)#837 | 6.9%(-2.40)#18,568 |
1
Common Questions
What are the Top Zip Codes with the Highest Percentage of Population Employed in Accommodation & Food Services in Marianna, FL?
Top Zip Codes with the Highest Percentage of Population Employed in Accommodation & Food Services in Marianna, FL are:
What zip code has the Highest Percentage of Population Employed in Accommodation & Food Services in Marianna, FL?
32446 has the Highest Percentage of Population Employed in Accommodation & Food Services in Marianna, FL with 7.3%.
What is the Percentage of Population Employed in Accommodation & Food Services in Marianna, FL?
Percentage of Population Employed in Accommodation & Food Services in Marianna is 4.1%.
What is the Percentage of Population Employed in Accommodation & Food Services in Florida?
Percentage of Population Employed in Accommodation & Food Services in Florida is 8.4%.
What is the Percentage of Population Employed in Accommodation & Food Services in the United States?
Percentage of Population Employed in Accommodation & Food Services in the United States is 6.9%.