Zip Codes with the Highest Percentage of Population Employed in Accommodation & Food Services in Defuniak Springs, FL
RELATED REPORTS & OPTIONS
Accommodation & Food Services
Defuniak Springs
Compare Zip Codes
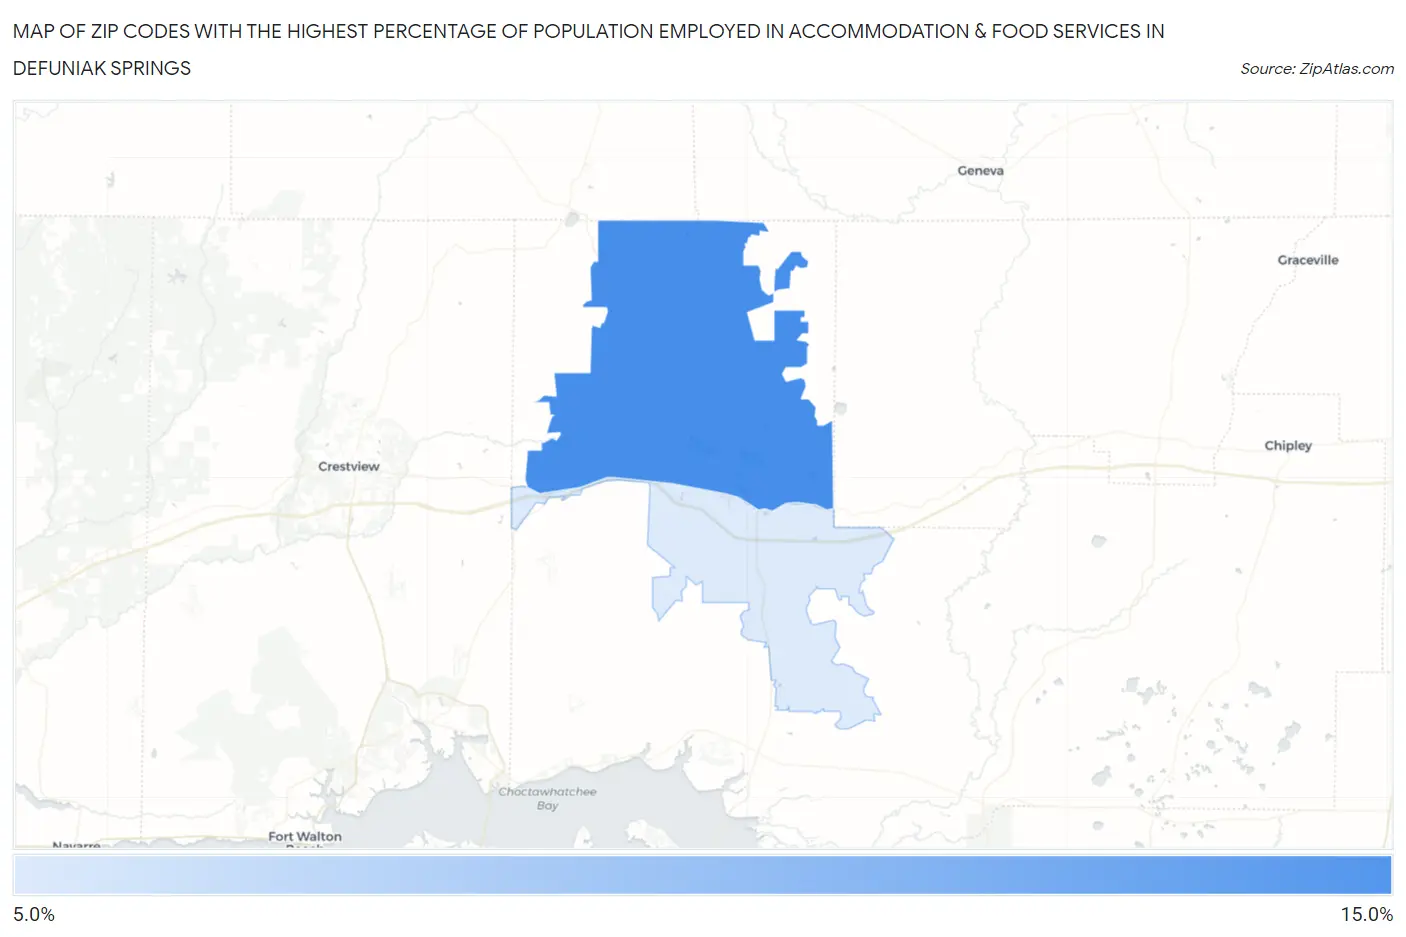
Map of Zip Codes with the Highest Percentage of Population Employed in Accommodation & Food Services in Defuniak Springs
5.1%
10.1%
Zip Codes with the Highest Percentage of Population Employed in Accommodation & Food Services in Defuniak Springs, FL
| Zip Code | % Employed | vs State | vs National | |
| 1. | 32433 | 10.1% | 8.4%(+1.74)#244 | 6.9%(+3.23)#4,400 |
| 2. | 32435 | 5.1% | 8.4%(-3.28)#788 | 6.9%(-1.79)#16,492 |
1
Common Questions
What are the Top Zip Codes with the Highest Percentage of Population Employed in Accommodation & Food Services in Defuniak Springs, FL?
Top Zip Codes with the Highest Percentage of Population Employed in Accommodation & Food Services in Defuniak Springs, FL are:
What zip code has the Highest Percentage of Population Employed in Accommodation & Food Services in Defuniak Springs, FL?
32433 has the Highest Percentage of Population Employed in Accommodation & Food Services in Defuniak Springs, FL with 10.1%.
What is the Percentage of Population Employed in Accommodation & Food Services in Defuniak Springs, FL?
Percentage of Population Employed in Accommodation & Food Services in Defuniak Springs is 10.5%.
What is the Percentage of Population Employed in Accommodation & Food Services in Florida?
Percentage of Population Employed in Accommodation & Food Services in Florida is 8.4%.
What is the Percentage of Population Employed in Accommodation & Food Services in the United States?
Percentage of Population Employed in Accommodation & Food Services in the United States is 6.9%.