Zip Codes with the Highest Percentage of Population Employed in Accommodation & Food Services in Quincy, FL
RELATED REPORTS & OPTIONS
Accommodation & Food Services
Quincy
Compare Zip Codes
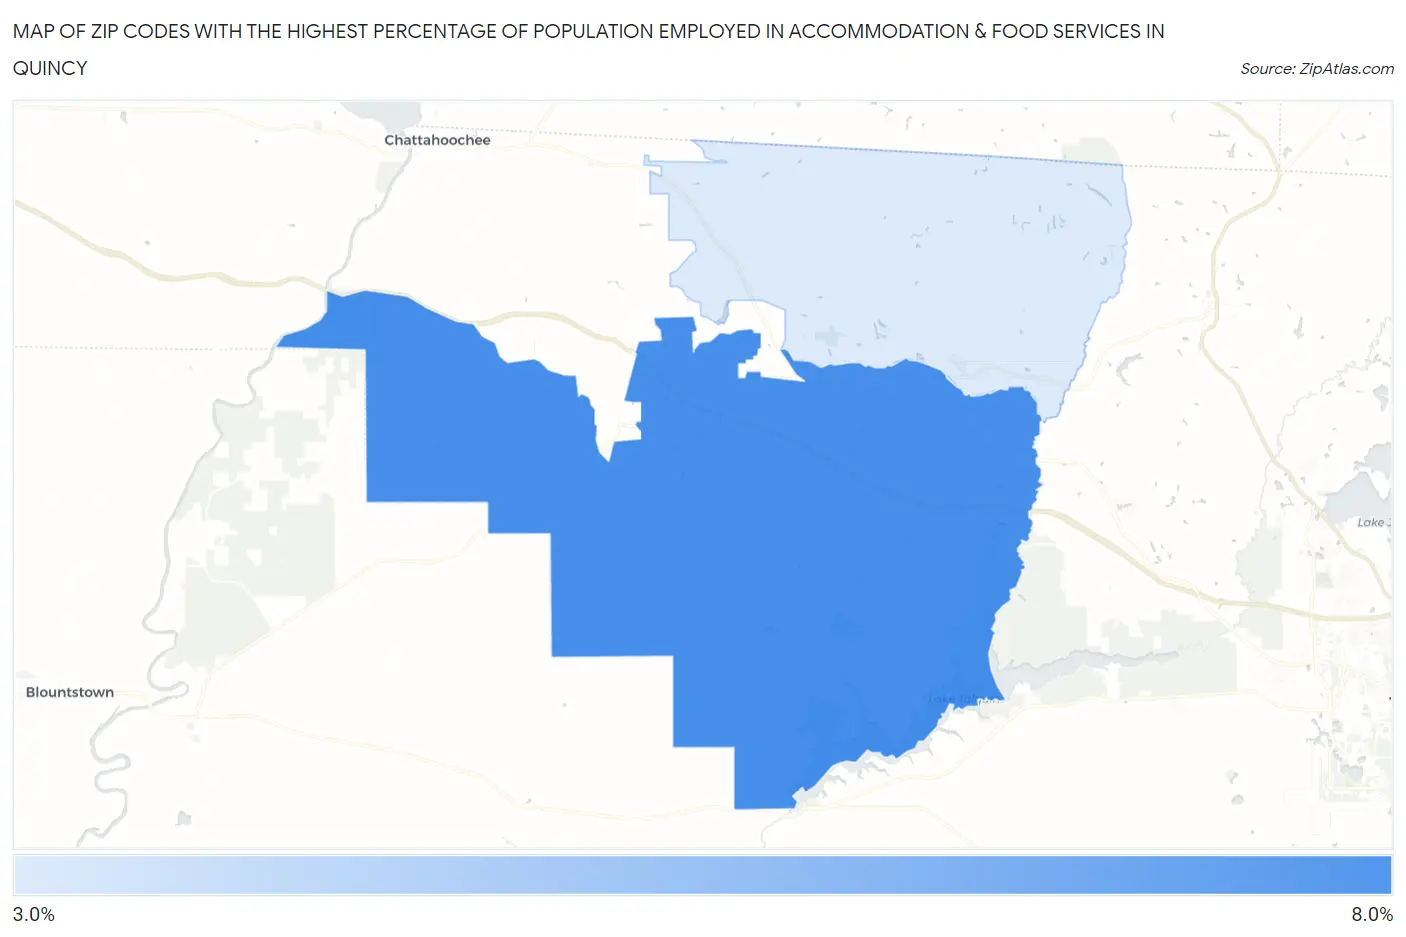
Map of Zip Codes with the Highest Percentage of Population Employed in Accommodation & Food Services in Quincy
3.6%
7.0%
Zip Codes with the Highest Percentage of Population Employed in Accommodation & Food Services in Quincy, FL
| Zip Code | % Employed | vs State | vs National | |
| 1. | 32351 | 7.0% | 8.4%(-1.42)#582 | 6.9%(+0.071)#10,464 |
| 2. | 32352 | 3.6% | 8.4%(-4.75)#880 | 6.9%(-3.26)#21,405 |
1
Common Questions
What are the Top Zip Codes with the Highest Percentage of Population Employed in Accommodation & Food Services in Quincy, FL?
Top Zip Codes with the Highest Percentage of Population Employed in Accommodation & Food Services in Quincy, FL are:
What zip code has the Highest Percentage of Population Employed in Accommodation & Food Services in Quincy, FL?
32351 has the Highest Percentage of Population Employed in Accommodation & Food Services in Quincy, FL with 7.0%.
What is the Percentage of Population Employed in Accommodation & Food Services in Quincy, FL?
Percentage of Population Employed in Accommodation & Food Services in Quincy is 11.6%.
What is the Percentage of Population Employed in Accommodation & Food Services in Florida?
Percentage of Population Employed in Accommodation & Food Services in Florida is 8.4%.
What is the Percentage of Population Employed in Accommodation & Food Services in the United States?
Percentage of Population Employed in Accommodation & Food Services in the United States is 6.9%.